Full Length Research Paper
ABSTRACT
This study assessed the impact of climate change and climate variability on food security in Kenya based on a sample size of 270 farmers randomly selected from semi-arid agro-ecological zones in Kenya. Both primary and secondary data were used in the present study. Data analysis was conducted using descriptive statistics and regression models. The results revealed that increase in temperature and reduction in rainfall had significant effect (p<0.01) on food security in Kenya. Increase in the amount of rainfall by 1 mm in the semi-arid areas enhanced food security by 0.01 kg while increase in maximum temperatures by 1°C reduced food security among households by 0.03 kg. Further, food security of Kenya is affected by increase in temperature and decline in rainfall. One unit increase in temperature would cause USD 3.9 million worth of value to become at risk as compared to USD 118,942 worth when rainfall decreased by 1 mm. Overall, the value at risk in the Kenyan economy is USD 112,351,112.46.
Key words: Food security, climate change, temperature, rainfall, risk.
INTRODUCTION
In Africa, Climate Change manifests itself as increasing trends in drought, temperature and reducing amounts and distribution of rainfall (Butt et al 2005). Drought, high temperatures, shortage of rainfall and floods exert heavy pressure on food resource availability, thereby, causing food insecurity (Dinar et al 2008; Mendelsohn and Tiwari, 2000). IPCC (2007) includes variability in the definition of climate change and state that climate change refers to a change of climate that is attributed directly or indirectly to human activity that alters the composition of the global atmosphere and that it is in addition to natural climate variability observed over comparable time periods. In order to ensure food security, it is necessary to minimize the impact of climate change and climate variability. This can be achieved by undertaking mitigation and adaptation measures. Food security is a situation when all people, at all times, have physical, social and economic access to sufficient, safe and nutritious food which meets their dietary needs and food preferences for an active and healthy life. Household food security is the application of this concept to the family level, with individuals within households as the focus of concern (FAO, 2002). Conversely, food insecurity is a situation when people at any specified level, household, community, village, or country do not have adequate physical, social or economic access to food. Climate Change has negative affect on food security in sub-Saharan African (Downing, 1992). There have been limited studies in Kenya to establish quantitatively the impact of climate change and variability on crop and livestock production systems (KPSA 2014; IPCC, 2007). The food crops used in this study included maize, potatoes and beans.
The climatic conditions required for maize, potatoes and beans production are: (i) maize is grown under divergent physical conditions but best climatic conditions; a) temperatures between 18 and 27°C during the day and around 14°C during the night, b) annual rainfall between 60 and 110 cm but it is also grown in areas having rainfall as low as 40 cm and moderate altitude; ii) sweet potato requires warm weather of at least four to five months. It requires temperature range of 21 to 27°C and a well distributed rainfall of 75 to 150 cm. It cannot tolerate heavy rainfall which induces excessive vegetative tuber development. The optimum temperature for Irish potato production is between 15 and 20°C but can tolerate higher temperatures at 30°C that gives very low yield. Soil pH of 5 to 5.5 (Cacl2) are favourable. Irish potatoes require 70 to 120 cm of rainfall but can be produced at higher rainfall beyond 120 cm so long as water logged conditions is avoided. In areas with heavy rainfall the crop becomes more susceptible to late blight. Irrigation requirements: provide days
25 to 30 mm of water for 3 to 4 days a week in light soils and 30 to 35 mm of water for 5 to 7 days a week in areas withheavy soil; and iii) common beans grow over a wide range of climate conditions. Beans grow in temperatures ranging from 14 to 32°C but the optimum growing temperature range is from 20 to 25°C. Extreme temperatures result into poor flower development and poor pod setting and therefore poor yields. Beans grow at an optimum altitude range of between 1,000 and 2,100 m above sea level. French beans mature faster in warmer areas. In rain fed cultivation production systems, beans require a well distributed medium to high rainfall of 90 to 120 cm per annum. It also requires well drained loams to heavy clay soils, with high organic matter contents and soil pH of between 6.5 and 7.5, but plants can tolerate up to pH 4.5. In the wake of Climate Change it is becoming rather hard to experience such ideal prodution conditions (Kurukulasuriya et al., 2006). This study assessed the impact of climate change and variability on food security in Kenya.
A number of studies undertaken to support this study include the risk to climate change, climate change waraness among farmers, adaptation options and some recommendations to improve resilience to climate change impacts.
Stefanovic et al. (2017) used a binary logistic regression to identify factors that influence individual’s adoption of adaptation measures among two distinctive farmer groups; food crop producers and horticultural crops farmers. Adaptation measures employed by food crop farmers were mainly risk-reducing, such as mixed- and inter-cropping, planting early-maturing crop varieties and early planting. In contrast, horticultural farmers tended to focus more on intensifying crop production and applied crop rotation, irrigation and application of agro-chemicals, artificial fertilizer and manure. Factors positively influencing adaptation included access to extension services and risk perception among horticultural farmers, and access to workforce and farmers groups among food crop farmers. Furthermore, food crop farmers with access to less risk-prone income sources than agriculture seemed to have less motivation to adapt. The study showed that as climate change progresses, social differences between horticultural and food crop farmers are likely to increase, hence leading to inequalities in adaptation at local levels. Adaptation planners need to address these differences if sustainable adaptation is to be achieved.
Sennhenn et al. (2017) stated that climate variability is the major risk to agricultural production in semi-arid agroecosystems and the key challenge to sustain farm livelihoods for the 500 million people who inhabit these areas worldwide. Short-season grain legumes have great potential to address this challenge and help to design more resilient and productive farming systems. Results highlight that, based on specific morphological, phonological, and physiological characteristics, the three short-season grain legumes common bean, cowpeas and lablab follow different strategies to cope with climate variability. The climate-smart site-specific utilization of the three legumes offers promising options to design more resilient and productive farming systems in semi-arid Eastern Kenya.
Njeru et al. (2016) stated that the drier parts of Central Kenya are characterised by poor crop harvest due to unpredictable, unreliable and poor rainfall distribution patterns. The field experiment was laid out in Partially Balanced Incomplete Block Design (PBIBD) with 36 treatments replicated three times. The treatments of tied ridges and contour furrows under sorghum alone and intercrop plus external soil amendment of 40 kg P/ha + 20 kg N/ha + manure 2.5 t/ha had the highest grain yield of 3.1 t/ha. The soil fertility levels differed significantly from one another (p = 0.0001) in terms of sorghum grain yield. Generally, all experiment controls had the lowest grain yields as low as 0.3 to 0.5 t/ha. Therefore, integration of minimal organic and inorganic inputs under various water harvesting technologies could be considered as an alternative food security initiative towards climate smart agriculture for climate change mitigation in drought-prone areas of Central Kenya.
Omoyo et al. (2015) carried out a study on the effects of climate variability on maize yield in the arid and semi arid lands of lower Eastern Kenya. The study confirmed that the arid and semi arid counties suffer from significant climate variability which has huge implications on maize yields and food security of lower Eastern Kenya. Thus, to counter the adverse effects of climate change, it is necessary to climate-proof agricultural crops through adaptation strategies such as developing maize varieties that tolerate water stress and mature early, practice early planting, increase the awareness of climate change and its impacts on agriculture, and develop appropriate mitigation measures. These findings are crucial in planning appropriate adaptation mechanisms in support of enhancing resilience of maize production and food security.
Gichangi et al. (2015) carried out a study on assessment of climate variability and change in semi-arid Eastern Kenya that revealed that a better understanding of farmers’ perceptions of climate change, ongoing adaptation measures, and the decision-making process was important to inform policies aimed at promoting sustainable adaptation of the agricultural sector.
Thorlakson and Neufeldt (2012) revealed that subsistence farmers are among the people most vulnerable to current climate variability. They explored ways and techniques such as agroforestry that could help subsistence farmers reduce their vulnerability to climate change. Data from farmers in Western Kenya revealed that households though aware of climate change are not currently coping with climate-related hazards in a sustainable way. Evaluation of agroforestry as one possible means of improving farmers’ well-being enabled a comparison of farmers engaged in an agroforestry project with a control group of neighboring farmers. Their findings show that involvement in agroforestry improves household’s general standard of living via improvements in farm productivity, off-farm incomes, wealth and the environmental conditions of their farm. Thus, it was concluded that agroforestry techniques was an effective development strategy to help subsistence farmers reduce their vulnerability to climate-related hazards.
MATERIALS AND METHODS
This study was conducted in the semi-arid zones of Kenya, which are transitional areas between arid and medium to high agricultural potential areas that receive 300 to 900 mm of rainfall per annum. Semi-arid zones were considered for the study based on the sole criterion of their agricultural potential (agro-ecological zone) to support different crops and livestock. The sampling frame consisted of farmers in nine counties in the semi-arid zones. The nine semi-arid counties were randomly selected from 28 semi-arid counties, which is part of the 47 counties of Kenya. The counties involved in the study were Narok, Kajiado, Embu, Machakos, Makueni, Kilifi, TaitaTaveta, Kitui and TharakaNithi.
Multi-stage random sampling procedure was used to select 270 farmers from the nine counties who were interviewed to provide primary data for the study. From each of the chosen counties, one sub-county (district) was randomly selected and subsequently one ward (formally division) and finally one village were randomly selected. Farmers were then randomly selected from each of the villages based on farmers’ lists held by the agriculture extension officers. The total population of all farmers in the nine counties was more than 10,000. Hence, the sample size was determined using the Scott Smith (2013) formula as follows:
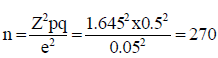
where n=number of respondents; p=estimated proportion of the distribution of the attribute which for this study was 0.5; q=1-p; z=is the statistical confidence level (in this study was pegged at 90%) whose corresponding statistical t-values is 1.645; and e=the error term of the desired level of precision (in this study was pegged at 5%). Based on the formula, the sample size for the study was taken as 270 farmers.
This study used both primary and secondary data. Primary data was collected from 270 farmers and 10 key informants using questionnaires and interview guides, respectively. Secondary data covering the period 1961 to 2016 was collected from published materials, government and non-governmental organization reports and websites.
Assessment of food security was undertaken at two levels. Firstly, the on farm food supply was computed from the primary data collected on food security and the factors that contribute to a household’s food insecurity vis a vis security. Then multiple linear regression was run on food security (FS) as a function of affecting factors (Xi); FS=f(Xi). Thus, the evaluation of the farm households food security using regression for food security on its factors to sustain food supply at farm level involved factors such as climatic conditions, namely, rainfall and temperatures to sustain on farm production, employment, education, extension services, mechanization, use of certified seed, interactive effects of other factors such as the health of the farmer, area of land being cultivated and socio-economic factors like exportation/excess sale of food products from the farm. The model that was run using cross-sectional primary data is specified as follows:
FS = α0 +α1R + α2T + α3E +α4D + α5M + α6P +α7S +α8L +α9I + α10V+ α11G +µ
where FS = food security at farm level (in number of meals per day and the number of months a household remains food self-sufficient in a year), R = current rainfall amounts received (mm), T= current maximum temperature (°C), E = extension services (number of visits), D = farmer’s education level (number of years in school), M = mechanization level, P = employment (on-farm versus off-farm), S = use of certified seed (Kgs of seed used), L = area of land (acres), V = soil improvement (Soil additives; manure and fertilizer (Kgs of fertilizer/manure)), I = interactive effects of other factors like the health of farmers, farmers social capital (no units), G = market derived factors such as availability/non-availability of key crop commodities, distance from the market, ease of access for a farmer to sell his/her crop surplus (no units) maize, beans, potatoes derived from the net trade of crops on the local markets as market information about the net scarcity of the crops in the various villages.
The reason for using the food indicators as variables in the food security model is to determine the contribution of each variable to the household food security in Kenya.
Secondly, evaluation of the risk of hunger among farm households in Kenya was computed by carrying out a vulnerability analysis that addresses the issues of future incidents of food insecurity. Rosenzweig and Hillel (1998) and Rosenzweig et a. (1995) stated that climate change may influence food security or insecurity. For this purpose, the FAO value-at-risk model (2006) was used to calculate the risk of hunger, stated as:
V(y*,X) = ʃW(y)δF(y│X).
where y* = critical benchmark value for food security indicator (A minimum of 90 kg of maize per year or its equivalent), y = food security indicators (number of meals per day, dietary diversity (number of food sources consumed per day) and number of months the farm produce lasts before access from the market), W(y) = individual household welfare function for each household as part contribution to the nationwide welfare (ʃW(y)) that would be determined, ʃW(y)) = nationwide welfare summed from individual household welfare, ʃ = integration function; summation of the individual household welfare into nationwide welfare, F(y│X) = conditional distribution function of the future food security associated with each food security indicator as Xi in the food security regression model. After deriving the food security situation as a summation of the food indicators, an evaluation was carried out against each of the conditional variable X (level of education, area of land level of mechanization, amount of rainfall, maximum temperature, level of employment, access to extension services, soil improvement factors, interactive effect and amount of certified seed used), X = vector of conditioning variables (Household coping strategies, risk management government policies and other factors outside the household and government control), V(y, X) = welfare loss associated with food insecurity also called value at risk.
This gave the severity of the current food insecurity position and by projection future indications of becoming more food insecure or secure and what needed to be done to improve the situation in the communities under study. This information was captured and summarized in the food insecurity transition matrix.
RESULTS AND DISCUSSION
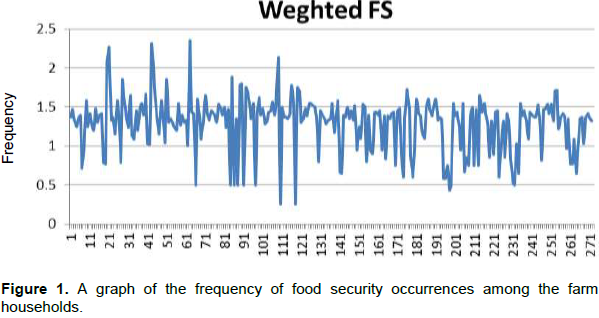
The study established that 34.43% of the farm households were food insecure taking 1.3 out of the possible 3 weighted food security score as the critical benchmark (Figure 1). The 1.3 mark implied that a farm household had at-least one meal per day and harvested food on-farm that would support at least the family for 2 months. Further, this graph showed that only 10% of the respondents were more than 60% food secure. This implied that a farm household may afford at least 2 meals per day and may harvest on-farm food that may support the family for at least 5 months. The weighted food security was revealed by three parameters; number of months households are food self-sufficient, average number of meals households had per day and the percent off-farm food source of households interviewed per year in semi-arid areas.
Multiple linear regression revealed that correct levels of temperature and rainfall contributed positively to food security scenarios among the households and this was statistically significant at 1% (Table 1).
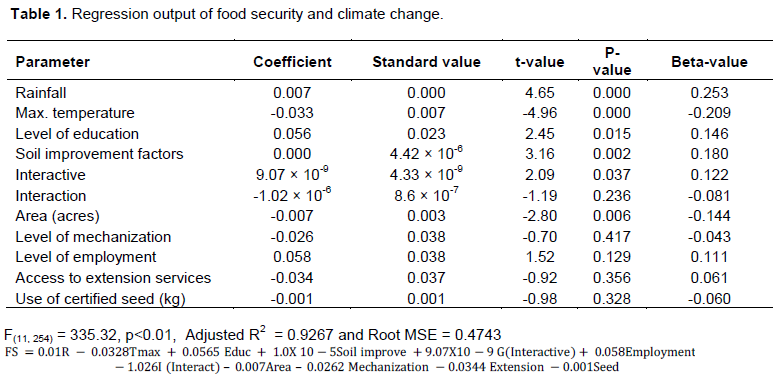
The results showed that increase in the amounts of rainfall received by 1 mm in the semi-arid areas increased food security by 0.01 kg while increase in maximum temperatures by 1°C reduced food security among households by 0.33 kg. Additionally, level of education, employment and soil improvement initiatives all had a significantly positive contribution to food security. These result implied that correct levels of temperature and rainfall increased food security among the farm households in Kenya. Additionally, level of education, employment and soil improvement initiatives, use of farm yard manure and fertilizer, had a statistically significant positive contribution to food security. This implied that when people get more education and better jobs, their food security component increases. Likewise, increasing soil fertility would lead to better yields which in turn would improve food security. However, the rest of the factors, level of mechanization, use of certified seed, area of land under cultivation and access to extension services, had a negative attribution to food security. This is attributable to the fact that firstly, level of mechanization in Kenya is mainly used by large scale farmers whose food security is not really an issue but income. This was also the reason for increased land area under cultivation that had a negative coefficient though statistically non-significant in the model. The use of certified seed and access to extension services had a very small negative impact on food security which indicated that even without these two factors Kenyan farmers may become food secure.
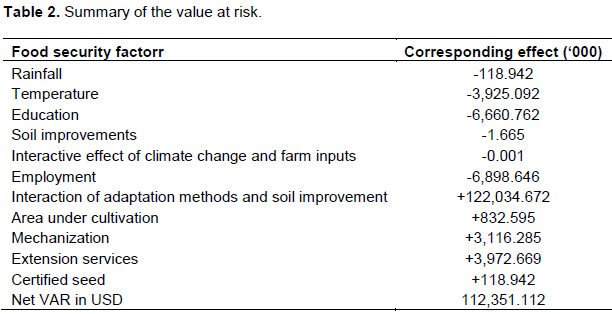
Assessment of the value at risk was carried out to evaluate the vulnerability and therefore the impact of climate change on food security in Kenya. The FAO’s value at risk model developed in 2006 was used to measure the probability of a household and community to fall below the critical food security threshold. This model integrated the social welfare loss realized from the loss in revenue and the food security indicators to simulate the loss attributed to each of the food security indicators as used in the food security regression model in Table 1.
The FAO value-at-risk (VAR) model (2006) was used to calculate the risk of hunger caused by climate change. Use of this method is consistent with the study by Scaramozzino (2006). The VAR was stated as an indirect component of the welfare loss function evaluated as V(y*, X) = ʃW(y)δF(y│X). In this case, y* = critical benchmark value for food security indicator, y = food security indicators, W(y) = household welfare function, F(y│X) = conditional distribution function of the future food security indicator and X = vector of conditioning variables (household coping strategies, risk management government policies and other factors outside the household and government control). This gave an indication of the severity of the farmers’ food insecurity position and by projection future indications of becoming more food insecure or secure and what needs to be done to improve the situation in the communities under study. Using the loss in the social welfare due to climate change
as:

The value at risk due to climate change is given as V (y*, X) = ʃW(y)δF(y│X). Based on results from Table 1 and the coefficients in the earlier stated equation, the only parameter not estimated is δF(y│X) which is derived from the function Y=f(xi). This was achieved through a linear regression of food self-sufficiency as captured by the number of meals per day a family was able to afford on level of education, area of cultivated land in acres, level of mechanization, amount of rainfall, maximum temperature, level of employment, access to extension services, soil improvement factors, interactive effect and amount of certified seed used in kilograms (Table 1).
The value at risk was deduced using the coefficients contained in the model as follows:
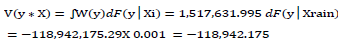
(a) Rainfall impact on value at risk if V(y*,X) = ʃW(y)dF(y│Xi) = -118,942,175.29 dF(y│Xrainfall) = -118,942.175 × 0.001 = -118,942.175
This resulted into a negative value that signifies that excess rainfall beyond the critical values had a negative impact on food security. This is specifically true in cases of floods and flood prone areas.
(b) The value at risk due to maximum temperature fluctuations will be
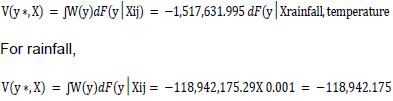
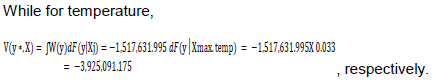
V(y*, X) = ʃW(y)dF(y│Xi) = -1,517,631.995 dF(y│Xmax.temp) = -118,942,175.29 X0.033 = -3,925,091.785
This results show that increasing temperature had a negative effect on food security in Kenya
(c) Likewise, the value at risk due to education
V(y*,X) = ʃW(y)dF(y│Xi) = -1,517,631.995 dF(y│Xlevel education) = -118,942,175.29 × 0.056 = -6,660,761.816
The results also indicated that increased education had a negative impact on food security since it withdraws farm labour from rural areas in search for white colar jobs.
(d) Soil improvement: V(y*,X) = ʃW(y)δF(y│Xi) = -1,517,631.995 δF(y│Xsoil improvement) =
-118,942,175.29 × 0.000014 = -1665.19
Soil improvement had a small negative impact on food security since it costed the family reources when it was most needed during the growing season.
(e) Interactive effect of climate change and farm inputs: V(y*,X) = ʃW(y)δF(y│Xi) = -1,517,631.995 δF(y│Xinteractive) = -118,942, 175.29 × 0.00000000907 = -1.07881
This interactive effect has a negative impact on food security
(f) Employment: V(y*,X) = ʃW(y)δF(y│Xi) = -1,517,631.995 δF(y│Xemployment) = -118,942,175.29 × 0.058 = -6,898,646.167
Employment has a negative impact to food security since it exposes families to cyclical food insecurity spells dictated by seasonal incomes, usually monthly intervals.
(g) Interaction of adaptation methods and soil improvement: V(y*,X) = ʃW(y)δF(y│Xi) = -1,517,631.995 δF(y│Xinteraction) = -118,942,175.29 × -1.026 = +122,034,671.8
The use of adaptation methods improved the effects of soil fertility to give a positive impact on food security in Kenya
(h) Area: V(y*,X) = ʃW(y)δF(y│Xi) = -1,517,631.995 δF(y│XArea) = -118,942,175.29 × -0.007 = +832,595.227
The amount of land a farm household owned has a positive effect on the family’s food security.
(i) Mechanisation: V(y*,X) = ʃW(y)δF(y│Xi) = -1,517,631.995 δF(y│XMechanization) = -118,942,175.29 × -0.0262 = +3,116,284.993
The results support the theory that mecahnisation improved food security in rural areas and likewise;
(j) Extension: V(y*,X) = ʃW(y)δF(y│Xi) = -1,517,631.995 δF(y│XExtension) = -118,942,175.29 × -0.0344 = +3,972,668.655
This implies that extension services improved food security and use of
(k) Certified seed: V(y*,X) = ʃW(y)δF(y│Xi) = -1,517,631.995 δF(y│Xseed) = -118,942,175.29 × -0.001 = +118.942.175
This means that the use of certified seed improved food security among the farm households in Kenya.
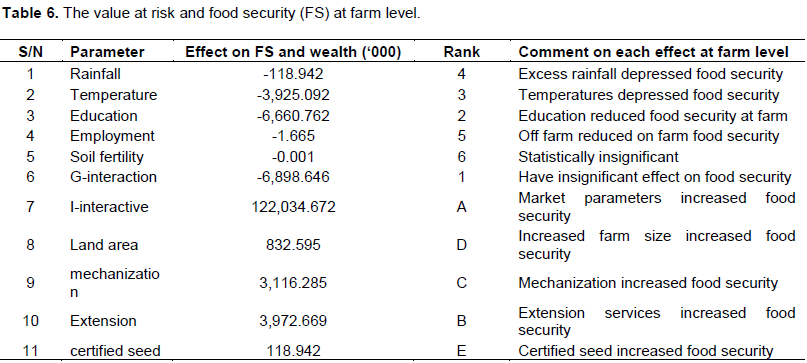
These computations are shown in Table 2. These results depict positive contributions of extension services, area under cultivation, mechanization and use of certified seed to food security. Reduction in rainfall and increases in temperature lower the food security positon of households in Kenya. These results suggest a need for mitigation and adaptation measures for climate change and variability to minimize food insecurity in Kenya.
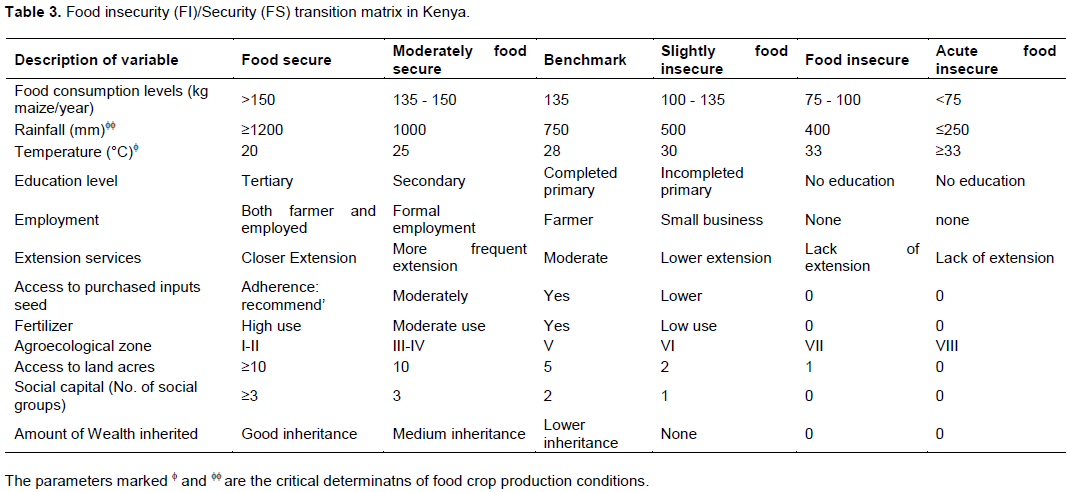
Computation of transitional levels of food security and insecurity revealed that the benchmark levels of the various factors that signify food insecurity or security indicators are shown in Table 3. The results demonstrated that access to extension services and improvements in the levels of education have positive interaction with food security in Kenya. This can be explained by the fact that relatively educated farmers exerted more efforts and take measures to improve food production and become food secure. On the other hand information received from extension workers provided required skill to improve food production that may lead to improved farmer’s access to food thereby, improving food security.
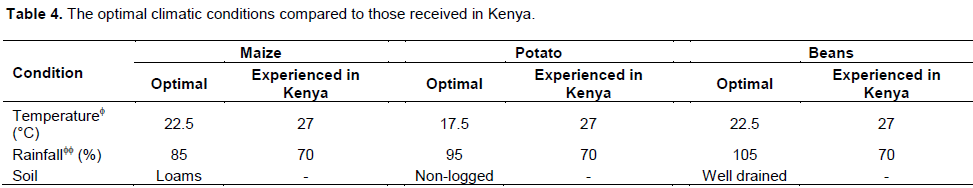
Comparison of optimal climatic conditions for production of the four crops with those experienced in Kenya is shown in Table 4.
The climatic conditions received in Kenya can marginally support maize and potato production. Thus, the perpetual crop failures and food insecurity experienced in Kenya.
This study tested the hypotheses that climate change and variability had no effect on food security in Kenya. The evidence for this hypothesis is anchored on the premise obtained from a regression of food security on climate change parameters and other food security factors whose output is shown in Table 5.
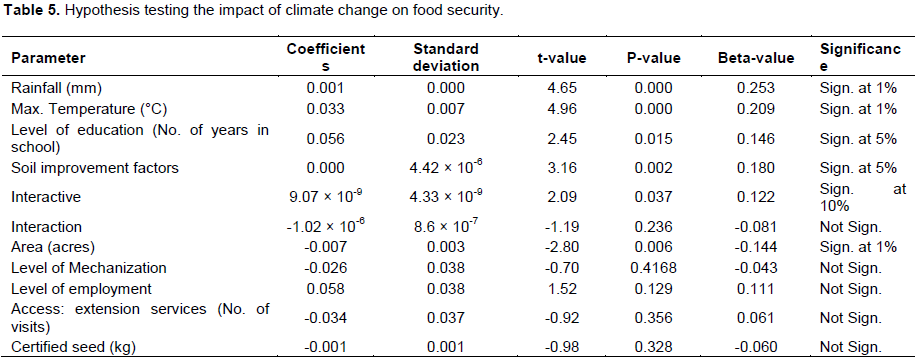
The results revealed that an increase in rainfall had a positive impact on food security and this was statistically significant at 1%. Maximum temperatures also had an impact which was significant at 1%. A compounding effect is realized from calculating the value at risk which revealed the extent of rainfall changes and temperature changes causing reduction in the net effect of food security. Given that:
Based on the results, the null hypothesis was rejected, which means acceptance of the alternative hypothesis that lends credibility to the fact that climate change would have impact on food security. More specifically, increases in temperature and reduction in rainfall reduce food security.
Assessing household’s social welfare change caused by climate change was conducted using the FAO’s Value at Risk model (2006) that allowed for assessment of the social welfare of households and communities. This was realized by integrating the loss in revenue and the risk to food insecurity to simulate the loss attributed to each food security indicators as used in the food security regression model in Table 1. The model used to calculate the risk of hunger in this study as discussed earlier is V(y*,X) = ʃW(y)dF(y│X), which involved estimation of the conditional parameters to the main function F(y), that were pre-disposing factors Xi for a household to either become food secure or insecure such as level of education, access to farm inputs (fertilizers), level of employment, area of land under cultivation and level of mechanization. Thus, the model F(y│X) provides for inclusion of conditional factors outside the farmers control like coherent social capitals in place such as conducive policies, extension services, prevailing climatic conditions and interaction of such factors. The results from this model gave different values for each condition calculated as follows and outputs summarized in Table 6.
Excessive rainfall increases food insecurity but also people in high rainfall areas had less number of meals since they spent most of their time out in the fields. However, it was also true that these people had heavier and more nutritious foods that were not captured in the model. The value at risk due to maximum temperature fluctuations was:
This implies that Kenya would lose more in terms of becoming more food insecure when temperatures increased than when rainfall fluctuated. The result implies that a one unit increase in temperature caused USD 3.9 million worth of value to become at risk as compared to USD 118,942 worth when rainfall decreased by 1 mm. Overall, the value at risk in the Kenyan economy is USD 112.351 million, while the value at risk due to all other food security factors calculated in a similar way was recorded and ranked as Table 6.
The factors ranked 1 to 6 increased the probability to the risk for the loss of the value at risk and food insecurity by the magnitude indicated against each indicator, while those ranked A to E reduced it. They are associated with increasing the chances of improving the food security scenarios at farm levels. For example, increasing the level of education and employment would reduce the workforce at the farm levels and therefore aggravate the value at risk as opposed to lose in value. As such indication of the farm household to suffer hunger and its severity in terms of exposure can be calculated well in advance. Thus, it is possible for the government to clearly determine the current and in the near future by projection of those who may become food insecure and plan for mitigation and corrective action to improve the situation in the Kenyan communities. On the education and employment in Kenya, family labor is lost once a family member gets educated and employed because of the misconception that the education implies pulling out of the rural areas. Second, the family members (children and wife) who could otherwise be taking over from the aging generation also live in town with the educated person. In addition, the money earned may be sent to rural areas to hire labor but it may not completely carter for the four to five persons leaving in town away from the farm. The grand children are also withdrawn from the farms in pursuit of education. The sum total then is that the amount of labor is grossly reduced since the hired labor is never adequate and focused on the farm. Lastly the parents would be progressively growing older and weaker to continue providing the labor required. Then there is an aspect of land subdivisions fragmenting the parcels of land to tiny and economically unviable portions. Theoretically, education and employment can empower a farmer to hire labor but practically this has not been effective in Kenya. In addition, the hired labor in amounts does not take care of the quality of services offered by the family labor. Hired labor requires a lot of supervision which cannot be provided by the aged on the farm.
CONCLUSIONS
Climate change and variability, which occur in terms of changes in rainfall and temperature over time have major implications on farm household capacity to access food in a sustainable manner and in the required quantities and quality. Rising temperature is more critical as compared to reduced rainfall. A combination of temperature increases and decline in rainfall affects food security of households to a greater extent than individual effects of rain. climate change and climate variability cause both food insecurity and vulnerability to poverty. Addressing climate change and climate variability is therefore important to assure food security at household and national level. This can be achieved through the use of correct mitigation and adaptation measures to climate change and variability.
CONFLICT OF INTERESTS
The authors have not declared any conflict of interests.
REFERENCES
|
Alagidede P, Adu G (2014). Climate change and economic growth in sub-Sahara Africa: nonparametric evidence. Economic Research Southern Africa (ERSA), South Africa. |
|
|
Butt TA, McCarl BA, Angerer J, Dyke PT, Stuth JW (2005). The Economic and food security implications of climate change in Mali. Climate Change 68:355-378. |
|
|
Dinar AH, Mendelsohn R and Benhin J (2008). Climate change and agriculture in Africa: impact assessment and adaptation strategies, Earthscan, London Sterling VA. |
|
|
Downing TE (1992). Climate change and vulnerable places: Global food security and country studies in Zimbabwe, Kenya, Senegal and Chile. Oxford: University of Oxford, Environmental Change Unit. |
|
|
FAO (2002). Food security: concepts and measurement. Chapter 2 in World Agriculture report. FAO, Rome. |
|
|
FAO (2006). Adaptation to climate change in agriculture, forestry and fisheries: Perspective, framework and priorities. Working Group on Climate Change. FAO of the United Nations, Rome. |
|
|
Gichangi EM, Gatheru M, Njiru EN, Mungube EO, Wambua JM and Wamuongo JW (2015). Assessment of climate variability and change in semi-arid eastern Kenya. Climatic Change 130(2):287-297. |
|
|
IPCC (2007). Climate Change 2007:Impacts, Adaptationand Vulnerability: Contribution of Working Group II to the Fourth Assessment Report of the Intergovernmental Panel on Climate change. Cambridge University press. United Kingdom. |
|
|
Kenya Private Sector Alliance (KPSA) (2014). Climate Change and the Agriculture sector: Climate change and briefing Note (15) Agriculture. |
|
|
Kurukulasuriya P, Mendelsohn R, Hassan R, Benhin J, Deressa T, Diop M, Eid HM, Fosu KY, Gbetibouo G, Jain S, Mahamadou A, Mano R, Kabubo-Mariara J, El-Marsafawy S, Molua E, Ouda S, Ouedraogo M, Sène I, Maddison D, Seo SN, Dinar A (2006). Will African agriculture survive climate change?. World Bank Economic Review 20:367-88. |
|
|
Mendelsohn R, Tiwari D (2000). Two essays on climate change and agriculture: a developing country perspective. FAO Economic and Social Development Paper. 145. Rome, Italy. |
|
|
Njeru PNM, Maina I, Lekasi JK, Kimani SK, Esilaba AO, Mugwe J, Mucheru-Muna M (2016). Climate smart agriculture adaptation strategies for rain-fed agriculture in drought-prone areas of Central Kenya. International Journal of Agricultural Resources, Governance and Ecology 12 (2):113-124. |
|
|
Omoyo NN, Wakhungu J, Oteng'i S (2015). Effects of climate variability on maize yield in the arid and semi arid lands of lower eastern Kenya. Agriculture and Food Security 4:1. |
|
|
Rosenzweig C, Hillel D (1998). Climate change and the global Harvest: Potential impacts Of the Green house Effects on Agriculture. Oxford University press, New York. |
|
|
Rosenzweig C, Parry M, Fischer G (1995). 'World Food Supply', in Strzepek, K. and Smith, J. (eds.), As Climate Changes: International Impacts and Implications, Cambridge University Press, Cambridge P 27. |
|
|
Sennhenn A, Njarui DMG, Maass BL, Whitbread AM (2017). Exploring niches for short-season grain legumes in semi-arid eastern Kenya- Coping with the impacts of climate variability. Frontiers in Plant Science 8:699. |
|
|
Stefanovic JO, Yang H, Zhou Y, Kamali B, Ogalleh SA (2017). Adaption to climate change: A case study of two agricultural systems from Kenya. Climate and Development Article in Press pp. 1-19. |
|
|
Thorlakson T, Neufeldt H (2012). Reducing subsistence farmers' vulnerability to climate change:Evaluating the potential contributions of agroforestry in western Kenya. Agriculture and Food Security 1(1):15. |
|
Copyright © 2024 Author(s) retain the copyright of this article.
This article is published under the terms of the Creative Commons Attribution License 4.0


