ABSTRACT
Pyricularia grisea characterization is a prerequisite for species differentiation and understanding of the pathosystem, evolution and diversity of species. The aim of this study is to determine the morphological variation, pathogen virulence and molecular diversity of P. grisea isolates. Five isolates from infected heads of finger millet were collected from Bomet, Nakuru, Baringo, Busia and Machakos counties in 2019. The samples were cultured in the lab for both characterization and spore suspension preparation. Data on morphological characterization included colony diameter, color and shape of conidia. Pathogenicity test was done in the greenhouse in a randomized complete block design using KNE 741, a susceptible genotype and disease data scored. Molecular characterization involved the use of seven SSR markers. Data analyses included use of softwares such as AUDPC, Power Maker, GeneAlex and Darwin. Results showed that P. grisea isolates had different growth pattern with respect to color, colony diameter and conidia shape. Pathogenicity test revealed that all sites had significant different (P<0.01) virulence on the test genotype. Neck blast, scored at physiological maturity was prominent in Koibatek and Bomet strains while leaf blast was severe in Bomet and Alupe strains. Molecular analysis showed that ENA ranged from 1.30 (MGM 437) -1.99 (Pyrm 61-62) with an average of 1.71. PIC varied between 0.20-0.37 for primers MGM 437 and Pyrm 61-62, respectively. Factorial and phylogenetic analysis revealed that P. grisea isolates were diverse with no geographical grouping. AMOVA indicated diversity occurred within populations (87%) as opposed to among populations (13%). The high P. grisea variability found in the study is a clear indication of the high sexual recombination among strains collected in major growing areas of Kenya.
Key words: Diversity, morphology, pathogenecity, Pyricularia grisea.
Finger millet blast disease, caused by Pyricularia grisea (Teleomorph; Magnaporthe grisea (T.T Herbert, (M. E Barr), is the most economically important disease of finger millet (Mgonja et al., 2007). It is known to cause significant losses in yield and utilization of finger millet. Worldwide losses of above 50% yield have been reported in finger millet and above 30% in rice production (Esele, 2002; Prajapati et al., 2013). In India, an increase in 1% infection in the neck and finger results to a corresponding increase of 0.32 and 0.084% in yield losses and grain losses of 6.75 to 87.5%, respectively (Rao, 1990). In East Africa, Pagliaccia et al. (2018) reported yield losses that exceeded 80%, while in rice, P. grisea has been known to cause yield loss of 60-100% (Kihoro et al., 2013). Blast infects finger millet at all stages from seedling stages all through panicle formation (Sreenivasaprasad et al., 2004). Effect on the panicle on susceptible genotypes is drastic and may lead to total seed loss of entire finger millet crop (Gashaw et al., 2014). Muimba-Kankolongo (2018) reported that favorable weather conditions (temperature of 25oC and 80% humidity) precedes infection of blast diseases, which starts when a three-celled conidia lands on a leaf surface. This leads to formation of an appressorium which later forms a penetration peg, punctures the cuticle allowing entry to the epidermis. Formation of lesions then follow which later spreads to the whole plant through the epidermis forming diamond shaped grey lesions with brown or black margins. Infection from the leaves begins from the tip backwards. The disease has a wide range of hosts especially grasses and sedge species including rice (Oryza sativa), wheat (Triticum aestivum), pearl millet and foxtail millet (Setaria italica). Blast affects production and utilization of these crops leading to a substantial decrease in production in Southern Asia, Eastern and Southern Africa (Takan et al., 2012).
Finger millet is a small-grained cereal that is widely cultivated in arid and semi-arid areas of East and South of Africa and Southern Asia. Nutritionally, it contains 7-14% protein in its seed, iron, calcium, phosphorus, carbohydrate, zinc and gluten-free amino acids such as methionine, leusine, isoleusine, phenylalamine among others (Kumar et al., 2016). Eleusine coracana is not only a food crop but also an important source of food security to marginal areas. Finger millet provides solutions to alleviating ‘hidden hunger’ affecting worldwide populations by providing essential micronutrients such as zinc (Underwood, 2000). It can also be utilized as crop with a wide range of genetic resources providing resilience to the changing climatic conditions. With all these benefits, finger millet is affected by many diseases such as root rot, smut, streak, mottling virus and blast disease. E. coracana is tolerant to most of these diseases however blast disease is the most devastating and destructive leading to losses in yield and poor utilization by farmers (Ramakrishnan et al., 2016).
Resistance breakdown overtime due to pathogen variability interferes with the breeding objective of developing resistant genotypes (Kariaga et al., 2016). Morphological and genetic diversity of P. grisea population is important as it offers durable resistance to the losses caused by these pathogens (Kariaga et al., 2016). Characterization of P. grisea is important in understanding evolution, diversity and pathogenicity. Biodiversity-ecosystem functioning studies controls numerous ecosystem processes such as detection, identification and distribution of the fungi. The effect of fungal biodiversity has been used in approaches such as metagenomics, metatranscriptomics and metabolomics (Fr?c et al., 2019). Pathotypes of P. grisea in rice, pearl millet and fox tail millet have been studied and identified; however, fewer studies have been done on the morphological and molecular characterization of blast disease in finger millet (Takan et al., 2012). These studies have shown considerable variation morphologically in terms of mycelia growth, color and colony production of P. grisea (Getachew et al., 2014). Molecular markers have been used to indicate diversity of pathogenic population. The use of SSR markers has been used to evaluate pathotype genetic diversity because of their high sexual reproduction recombination potential, co-dominance, locus specific, multi-allelic and they occur in abundance for all species. This study therefore aimed at characterization of P. grisea collected from different finger millet growing regions of Kenya using morphological and genetic features of the pathogen strains and their pathogenicity test to reveal the most virulent pathogen. The determination of the most virulent strain will help to come up with an effective management strategy against the pathogen.
Isolation of P. grisea
Four samples each of diseased tissues (leaves and panicle) were picked from five different regions (Bomet, Baringo, Busia, Makueni and Nakuru) and ported to Egerton biotechnology laboratory for isolation of the fungus using Tuite (1969) and Aneja (2005)’s standard tissue isolation procedure with minor modifications. The margins of the infected tissues were cut in triangular shapes of 5-10 mm and surface sterilized with 0.5% sodium hypochlorite solution and dipped in sterile distilled water for 2 s to saturate the specimen and dealcoholize. The tissues were then placed in glass plates with filter paper to dry the excess water. They were then plated on growth media containing Oat meal Agar amended with 60mg/l Neuromycine sulphate to avoid bacterial contamination (Tredway et al., 2003) and incubated at 25 ± 1oC in artificial light on a 12 h light/dark photoperiod for 15–25 days for sporulation and growth of the fungi (Aneja, 2005). Pure colonies were obtained from each region through five subsequent sub-culturing.
Microscopic characterization of P. grisea isolates
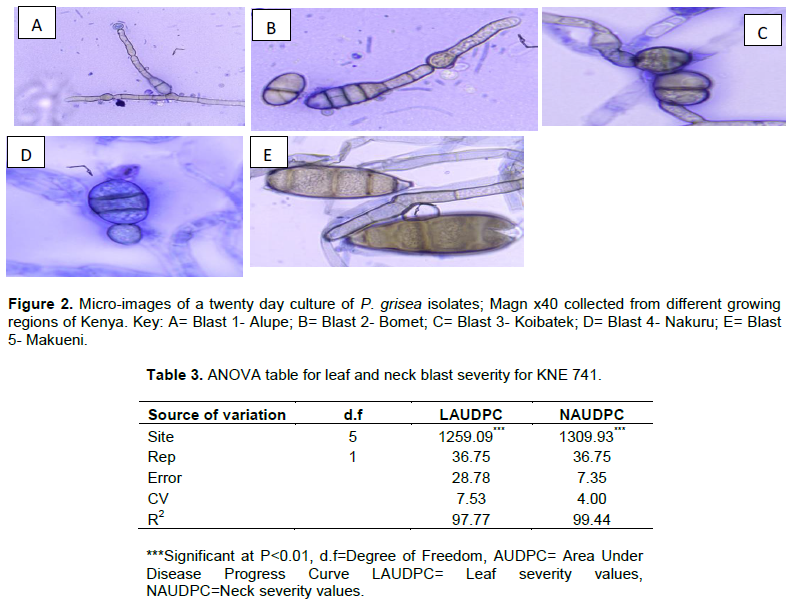
A 0.5 cm section of the young sporulated fungus was picked using a micro-pin placed on a drop of water on a piece of slide to allow for classical characterization using binoculars microscope after staining with lacto phenol cotton blue and images observed using image analyzer software. Morphological observations were taken based on colony, conidia and conidiophore morphology; Colony diameters of each isolate (mm), surface texture, pigmentation, mycelial growth on different solid media, type of margin, shape, color, size (length and width) septation of the conidia (Gashaw et al. 2014) Micrographs were taken to show the typical spore morphology of mycelial color, type of margin and sporulation of P. grisea isolates (Barnett and Hunter, 1960). Monoconidial isolates of pure culture fungi were then maintained on in agar slants at 4oC. Mother cultures were also preserved in a freezer as reference cultures (Khosravi et al., 2019).
Pathogen spore preparation
Spores and conidia from a 14 day cultured fungi were harvested by flooding five plates representing the five regions with sterilized distilled water and scrapping the growth by a spatula and placed on glass Petri dish (Getachew et al., 2014). A spore solution of 10 µl was pippeted and placed on a haemocytometer and the number of spores counted on the chambers A, B, C, D and E. The numbers found were then used to determine the number of spores per ml by multiplying the value by 2000. The spore suspension was then adjusted to desired concentration of 1×10⁵ spores/litre with the help of hemocytometer using the C1V1 formula and 0.01 % Tween 20, a surfactant which amends the properties of the carrier to ensure it dissolves. The suspension was then sieved through a double layer of muslin sleeve poured in calibrated hand sprayers.
Planting, inoculation and scoring of disease on susceptible KNE 741
Test plants were planted in a CRD design with three replicates representing the five regions and three pots for control. Eighteen small pots measuring 20 cm diameter and 40 cm height were filled with sterile soil autoclaved at 121 Pa pressure and 21oC for 15 min DAP of 15.5 g added per pot. Three seeds from the most susceptible variety (KNE 741) were then sown in the pots and allowed to germinate and grow for two weeks. A spore suspension of the P. grisea strains from each of the five regions (Bomet, Nakuru, Koibatek, Alupe and Makueni) were used to do the pathogenicity test. Five calibrated hand sprayers were used to spray the pathogen strains to the susceptible variety. The pots were then covered with a parchment bag for 48 h to create humidity required for the growth of the pathogen. After a period of 7 days the symptoms were recorded from each variety and the most virulent pathogen determined on disease severity. Each observed symptom was assigned group I- III where; I-Highly pathogenic, II-moderately pathogenic III- mild pathogenic.
Disease severity rating (DSR) (% damage) was done on the first four leaves (flag) where five plants were randomly tagged per plot. Disease severity on tagged plants was recorded at tillering, flowering, and physiological maturity stages on KNE 741 using modified Cobb scale (Babu et al., 2013). Leaf blast scored based on percent surface area of the infected leaves was evaluated as P. grisea severity was used as an indication of severity (Table 1). Neck blast severity was based on the relative lesion size on the neck; a 1 to 5 progressive rating scale was used where, 1 = no lesions to pin head size of lesions on the neck region, 2 = 0.1 to 2.0 cm size of typical blast lesion on the neck region, 3 = 2.1 to 4.0 cm, 4 = 4.1 to 6.0 cm, and 5 = >6.0 cm size of typical blast lesion on the neck region.

DNA extraction of P. grisea
Pure cultures of P. grisea strains grown on Oat Meal Agar (OMA) for 5 days were used. DNA extraction was done using a modification of the Dellaporta (1994) protocol. The modifications included use of a single SDS buffer (Modified SDS Buffer Components; 20g SDS, 100ml of 1M Tris-HCl (pH 8.0), 50ml of 0.5M EDTA (pH 8.0), 20g PVP, 10g Sodium Sulphite and 82g Sodium Chloride), omission of the sodium acetate, potassium acetetate and mecarptoethanol. 70% ethanol was used instead of 80% and subsequent extraction procedure modified as follows: 50-70 mg of fungal mycelia was scrapped from the Petridish and placed in a 2ml microcentrifuge tube. 1000 µl of 2% SDS buffer was added and placed in a water bath at 65 oC for 1 h. Centrifugation was then done at 13000 rpm for 10 min. 750 µl of the supernatant was then pipetted out and placed on a sterile empty 2 ml microcentrifuge tube and an equal amount of Chloroform: Isoamyl Alcohol (CIA) 24:1 added. This was then centrifuged at 13,000 rpm for 10 min. 600 µl of aqueous was picked, placed on a fresh tube and an equal amount of cold isopropanol added to precipitate the nucleic acids. This was then incubated in a freezer (-20oC) for 12 h and then centrifuged at 13,000 rpm for 10 min.
After centrifugation, the supernatant was carefully decanted leaving a pellet in the tubes. 700 µl of 70% alcohol was added and centrifuged at 13,000rpm for 10 min.
Ethanol was carefully decanted leaving the pellets. The pellets were then air-dried for 30 min, 100 µl of sterile ddH2O added and samples incubated at 65 oC for 1 to dissolve the pellets. The samples were then stored at 4oC.
DNA confirmation by gel electrophoresis
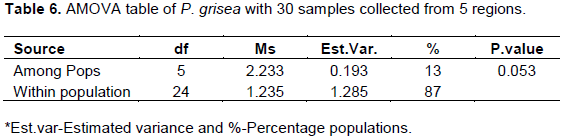
The bands of 30 isolates of P.grisea collected from the five sites were confirmed for presence and absence of DNA. The gel was then visualized under a UV transilluminator (Vilber Lourmat)
DNA quantification
DNA quantification was done using a 1% agarose prepared using 1X sodium borate and pre-stained with Gelred dye. The gel was placed in an agarose gel tank (Model CBS Scientific) containing sodium borate. 5 µl of DNA was mixed with 3 µl of lading dye and loaded on the gel wells. The gel was then run for 1 h at a voltage of 100 volts and a current of 500mA using an EC 1000 XC Power Pack and CBS Scientific MGU-502T gel tray. The gel was then visualized under a UV transilluminator (Vilber Lourmat).
DNA quantification was also done using a Nanodrop 2000c spectrophotometer (Thermo Scientific). The measurements include the concentration in ng/µl and absorbance 260:280 ratio to check for DNA purity.
SSR genotyping
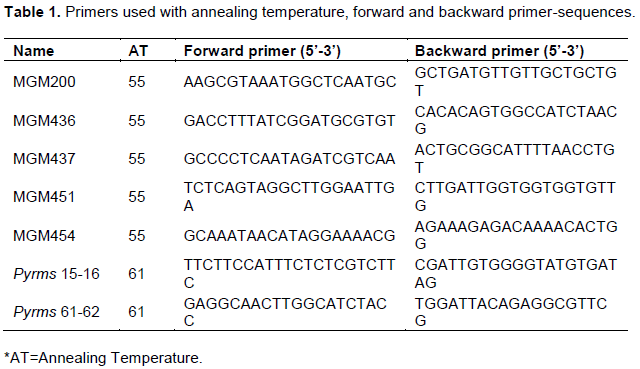
Seven SSR markers were used for analyzing SSR diversity in P. grisea sourced from MGM database (http://ibi.zju.edu.cn/pgl/ MGM/index.html) (Table 1).
PCR was performed in a 10 µl reaction volume containing 6 µl of master mix (One Taq Quickload 2x MM), 1 µl of forward and backward primers, 0.5 µl of 25Mm MgCl2 (Promega), 1.5 µl of ddH2O and 1 µl of DNA template. Amplification was done in an AB2720 thermocycler (Applied Biosystems) using the following conditions: Initial denaturation at 94oC for 5 min, 45 cycles of denaturation at 94oC for 30 s, annealing at 55oC for MGM coded primers for 1 min (Pyrms at 61oC), extension at 72oC for 2 min and final extension for 10 min at 72 oC. The PCR products were run on a 2% agarose gel. Amplicons were visualized under UV light and the fragment sizes scored based on a 100bp/1Kb molecular ladder.
Data analyses
Area Under Disease Progress Curve (AUDPC) was used to estimate the severity of leaf and head blast disease in susceptible KNE 741 finger millet variety. It was computed using Wilcoxson et al. (1975)’s formula;
Where; yi = disease severity % on the ith scoring, ti = number of days from sowing to ith scoring, n= total numbers of scoring t (i+1) is second assessment date of two consecutive assessment and y_(i+1) is disease severity on assessment date (i+1).
The data on severity were subjected to analysis of variance for green house experiment using PROC GLM in Statistical Analysis Software (SAS institute Inc; Cary, 2002) with the following model
Yi= µ+Rj + εi (2)
Where, Yi is the overall observation, µ is the overall mean, Ri is the ith observation due to variety and εi is the random error term (Equation 1).
Diversity data were generated by scoring for the presence (1) or absence (0) of amplification on all the gels producing a score matrix. Marker polymorphism was quantified in terms of polymorphic information content (PIC), major allele frequency, observed number of alleles and effective number of alleles using Power marker software version 3.25 (Liu and Muse, 2005). Diversity of Pyricularia grisea involved calculation of Nei’s genetic diversity indices and Shanon’s Information Index executed in PowerMarker software (Table 2). Phylogenetic analysis and grouping of isolates involved factorial and dendrogram construction using Neighbor Joining method in Darwin software, with 1000 bootstraps (Perrier, 2018; Perrier and Jacquemoud, 2015). A Principal Coordinate Analysis (PCA) was also done using Darwin software. Analysis of diversity within and among population was computed using AMOVA in GenAlEx software version 6.5 (PEP, 2012).
Cultural and morphological characteristics of Pyricularia grisea
Colony color
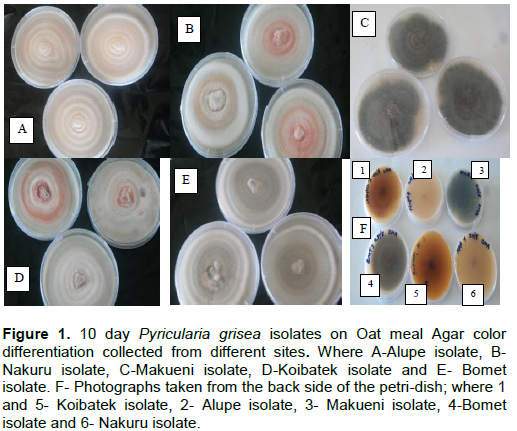
There was variation in colony color of all the pathogens collected from Alupe, Bomet, Koibatek, Nakuru and Makueni regions. Variation in color occurred mostly 3 to 5 days and 5-14 days at initial and later stages, respectively. At day 10, most pathogens had varied grey and black color on both the front and the back side of the petri-dish (Figure 1).
Blast isolate 1 (Alupe) was white at initial growth and finally changed to grey color at mid-stage from day 10, it was greyish-white in color. The colony had smooth margins with 5 rings observed only at the front of the Petri-dish. It had a unique appearance of red pigmentation during its growth which disappeared at later stages. Blast isolate 2- (Bomet) was white at initial stages of growth which turned to grey color at the final stages with a buff color observed at the back of the Petri-dish. It has smooth margins with 6 rings observed on the front and the back of the Petri-dish. Blast isolate 3- (Koibatek) had numerous variations in color. White and red pigmentation was observed during the initial stages of growth. The color later changed to greyish white at the final stages. It grows with smooth margins with 4 rings observed only at the front of the Petri-dish. Blast isolate 4- (Makueni) had grey color at the initial stage of growth on both sides of the Petri-dish which later changes to a total black color. It had no rings both at the back and the front of the Petri-dish with irregular margin as it grows. Blast isolate 5- (Nakuru) had a clear white color at the initial stages of growth with smooth margins and 5 centric rings. It finally changed to greyish white color at later stages (Figure 1).
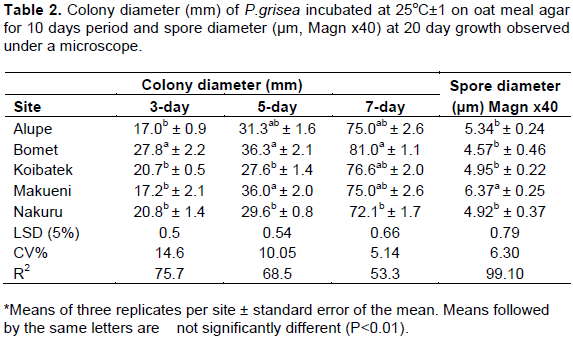
Colony diameter and spore observation under the microscope
Colony diameter (mm) was measured on a 3rd, 5th and 7th day period and growth incubated in conditions of 25 ± 1 oC for 10 days was compared on all the five sites. On the 3rd day P. grisea from Bomet colony diameter had the highest mean (27.8 mm) which was significantly different (P<0.05) from those of Makueni, Alupe, Koibatek and Nakuru. On the 5th day, colony diameter from Bomet, Makueni was not significantly different (P<0.05). Pathogen strains from Koibatek and Nakuru did not differ significantly (P<0.05). Colony diameter from Alupe was not significantly different from those of all the other sites. On the 7th day, colony diameter from Bomet (81.0) had the highest growth and therefore significantly different from those of the other sites. Alupe, Koibatek, and Makueni had no significant difference (P<0.05). Nakuru had the lowest mean (72.1), however it was not significantly different (P<0.05) from those of Makueni, Koibatek and Alupe (Table 2).
Conidia characteristics
Microscopic observation showed that spore diameter of P. grisea was measured and the results indicated that there was significant difference (P<0.01) in spore sizes on the 20 days cultures. P. grisea from Makueni had the highest mean of 14.37 µm. The spores were long, pyriform with four septa at 20 days culture, more mature in terms of growth. Nakuru had two septate conidia with a rounded shape. The septae had separate margin. Alupe had a two medium sized pyriform spore with a rounded apex. Bomet had the lowest 4.57 µm with 2-4 septate conidia which had a smooth margin at the apex (Figure 2). The spores had a highest diameter of 5.34 µm when fully mature at 25 days. There was no significant difference in spore sizes from Alupe, Koibatek, Nakuru and Bomet at full maturity (Table 2). All P. grisea isolates from all the sites had pyriform shape with varied apex; round/sharp and round/flat, number of cells; from 2-4 celled conidia of various sizes and shapes. The middle cells were larger compared to the apex and the base cells. There was also varied growth from being large and fully mature at 20th day (Isolate D) to slow development of spore characterized by small and immature spore (Isolate E) (Figure 2).
Pathogenicity test
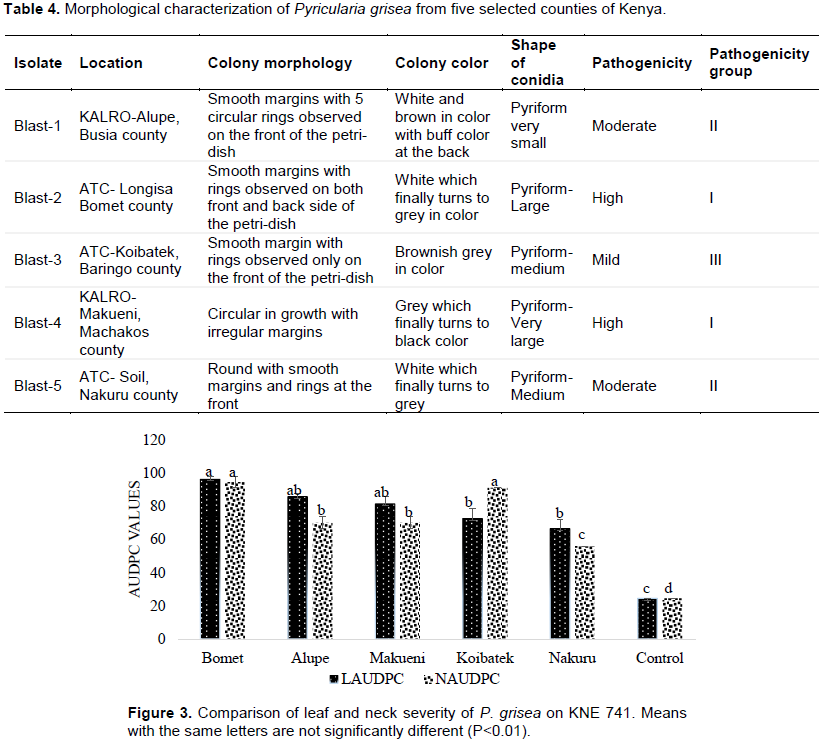
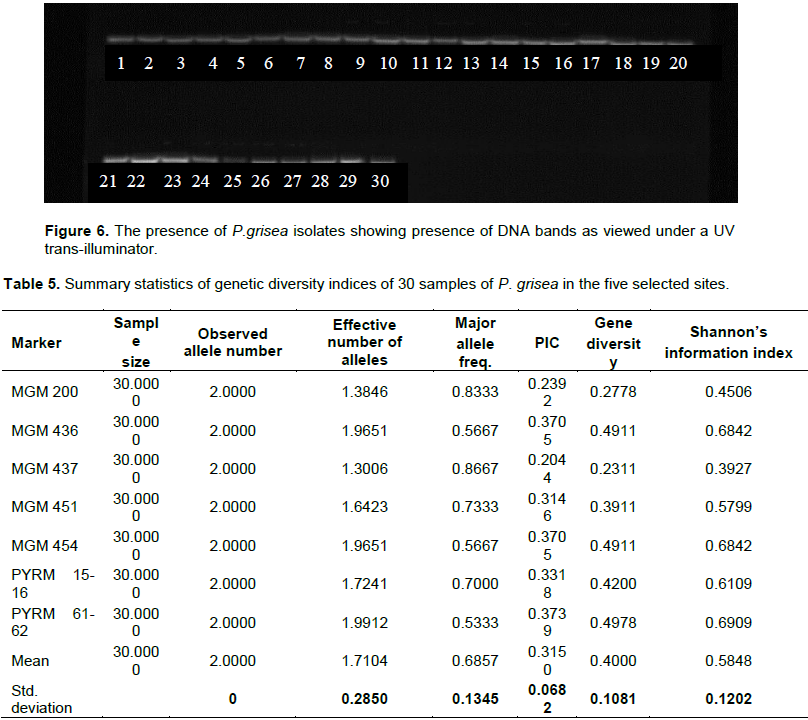
There was variation in growth patterns, shape and color of P. grisea collected from the five regions. The effect of the P. grisea from the various sites on test plants indicated the pathogenicity levels of the pathogen. The symptoms were noted 7-20 days after inoculation as small white lesions which grew into diamond shape at the 10th day, greyish white symptoms with brown spots which later developed to be black at the 15th day and leaf necrosis by yellowing which was typical from the apex as it progressed downwards at the 20th day (Figure 5) (Wekesa et al., 2019). These symptoms were a clear indication of P. grisea especially when compared to control which was not sprayed. P. grisea from Bomet and Makueni had the highest virulence (Highly pathogenic- Group I) while those from Alupe and Nakuru and finally Koibatek P. grisea had the least virulence (Mild pathogenic- Group III) (Table 3).
Virulence of pathogens strains from selected regions
Pathogen strains from different regions had different indication of the symptoms and infection to the susceptible variety KNE 741. From the ANOVA table, site was significant (p<0.005) for both leaf and neck blast severity (Table 4).
Mean separation from the five sites revealed that P. grisea from the sites were significantly different (P<0.01) in leaf and neck blast severity. Strains from Bomet, Alupe, and Makueni had higher severity values (>80) and did not differ significantly (P<0.01); while in Koibatek and Nakuru there was no significant (P<0.01) difference in leaf severity. A lower mean was recorded on the control (<20). Pathogens from Alupe, Makueni, Koibatek and Nakuru had no significant difference (P<0.01) on leaf severity. Neck severity appeared more on pathogen picked from Koibatek and Bomet and therefore they were not significantly different (P<0.01); while Alupe and Makueni had the same mean on neck blast severity (Figure 3).
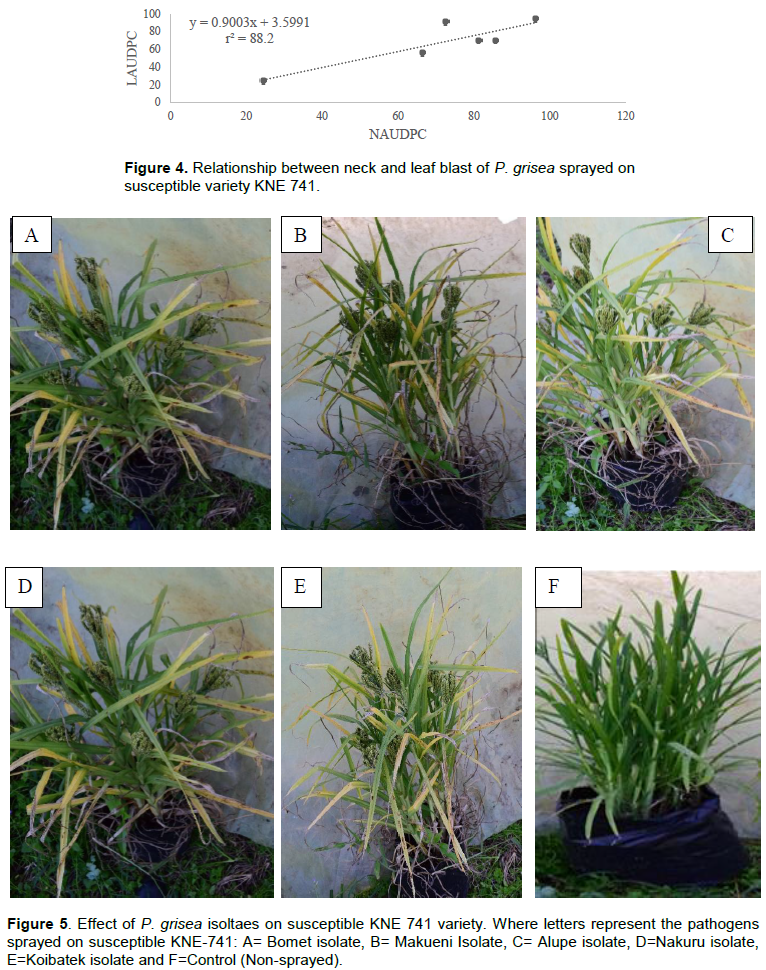
Relationship between neck and leaf blast
Pearson’s correlation coefficient indicated that there was a positive correlation of leaf and neck blast since a one-unit increase in leaf blast with all the factors held constant led to an increase of 0.9003 with 88.2 % of neck blast (Figures 4 and 5).
Molecular characterization of P. grisea from five selected major growing areas of Kenya
Confirmation of the DNA by gel electrophoresis
The bands of 30 isolates of P.grisea collected from the five sites were confirmed to be present after visualization under a UV transilluminator (Vilber Lourmat) (Figure 6)
Marker polymorphism and genetic diversity of P. grisea isolates collected in the five major growing areas of Kenya
A simple numeric scoring was used to denote the presence (1) and absence (0) of allele for each loci (Table 5). The observed allele number was two for all the selected primers indicating that only one locus was amplified by all the markers. Effective number of alleles {AE=1/ (1-Hexp)} ranged from 1.3006 (MGM 437) to the highest (1.9912) (Pyrm 61-62). Major allele frequency ranged from 0.5333 to 0.8667. Polymorphic Information Content (PIC) varied between 0.2044 and 0.3739 for primers MGM 437 and Pyrm 61-62 respectively. When P. grisea diversity was assessed, gene diversity ranged between 0.2311 and 0.4978 with a mean of 0.4.
Shannon’s Information index varied between 0.3927 and 0.6909 with a mean of 0.5848 (Table 5).
Factorial and phylogenetic analysis of the strains of P.grisea collected in various regions
Factorial analysis revealed that the samples from all the five sites clustred randomly with no distinct pattern observed (Figure 7). Most isolates clustered as individuals showing that they were genetically distinct while a few clumped together.
The phylogenetic analysis grouped the samples into two main clusters and six sub-clusters. Cluster 1 comprised 2 sub clusters. Sub-cluster 1 comprised isolates 2, 3, 4 and 5 from Nakuru, 3 and 4 from Alupe and 3 and 6 from Koibatek which appeared as duplicates and isolate 6 from Bomet which clustered as a distinct individual. Sub cluster two had only two isolates Makueni 1 and Alupe 6 which appeared distinct. Cluster II comprised 4 sub clusters. Sub cluster I comprised isolate 4 and 5 from Bomet which appeared as duplicates and isolate 1 from Koibatek. Sub cluster II comprised isolate 1 and 2 from Bomet and 2 and 5 from Koibatek which appeared as duplicates and isolate 5 from Alupe appeared as distinct. Sub cluster III comprised distinct isolates 6 and 1 from Makueni and Nakuru respectively. Sub cluster IV had 5 duplicate isolates Makueni (2, 3, 4 and 5) and distinct isolate 1 from Alupe, 3 from Bomet and 6 from Nakuru. There was no particular pattern deduced from the grouping; however, some strains from different regions were observed to cluster in same sub clusters as duplicates with few appearing distinct (Figure 8).
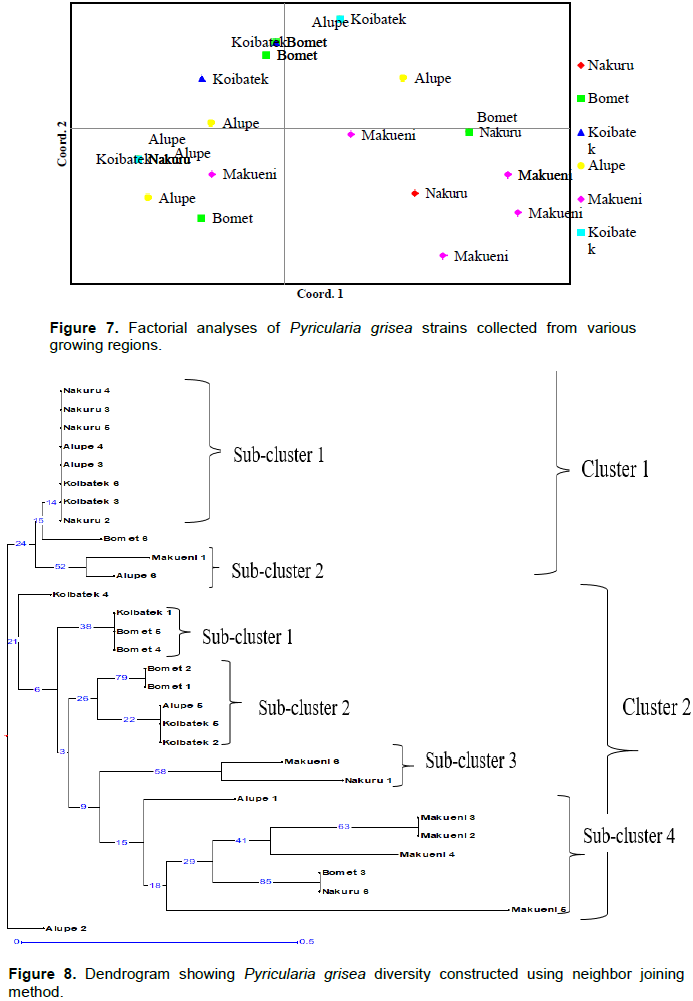
Overall, phylogenetic analysis revealed that P. grisea isolates from the studied regions were genetically diverse within the isolate population as opposed to geographical differentiation.
Analysis of Molecular variance (AMOVA)
Results of AMOVA (Table 6) revealed there was huge diversity within the P. grisea isolate populations (87%) compared to among the population (13%) with a P value of 0.053.
Morphological diversity of P. grisea in major finger millet growing areas in Kenya
P. grisea isolates collected from Alupe, Bomet, Makueni, Koibatek and Nakuru showed high variation both morphologically and genetically. There was variation in colony color, colony diameter and structure in growth patterns both at the petridish and microscopically. Description of the Ascomycete fungi has been described by conidia and conidiophore morphology as the main characteristics of the fungi (Choi et al., 2013). The difference in color maybe due to different growth stages of the spores which tend to vary with blast isolate and patterns of growth. Meena (2005); Getachew et al. (2014); and Shahriar et al. (2020) revealed that Magnaporthe grisea tends to vary due to sexual hybridization which shows variability in form and color at different asexual stage of the fungi. Colony structure on the microscope revealed significant morphological differences on the structure of conidia and conidial appendages of P. grisea from different regions. P. grisea had several flared pigmented conidiophores which are aseptate in nature. The findings are similar to those reported earlier by a study done by Klaubauf et al. (2014) who noted that the fungi have septate conidia of varying shape. This could be due to effects of different environments and ecological conditions under which the various P. grisea strains were collected which could have influenced the size, septation and form of the conidia. Getachew et al. (2013) reported similar findings and noted that environment affects the growth of the fungi size and shape. Conidia appendages aid in attachment to substrates, dispersal of spores and acclamation to new environments, which affect their variability in shape, mode of development, color and infectivity. Klaubauf et al. (2014) also noted different isolates differ with respect to the factors which also are a determinant of their variability in shapes, mode of development, color and infectivity to the host plant. The pathogen from Bomet and Makueni had higher growth on the petri-dish compared to those of Nakuru, Koibatek and Alupe. This could be due to the pathogens’ aggressiveness to mature faster and produce leading to more colonization on the host plant; these types of pathogen tend to gain resistance faster and can breakdown easily hence gaining resistance. These findings are in accordance with Saleh et al. (2014) who studied the origin, diversity and, dispersion of rice blast fungi and found that faster evolution and resistance of Magnaporthe grisea is linked to the faster growth of the pathogen.
Pathogenic diversity of P. grisea in major finger millet growing areas in Kenya
Pathogenicity test which was a measure of the virulence of the pathogen collected from five different major growing areas showed that there is variation in symptoms of various P. grisea. This may be due to the existence of diversity that existed within the pathogens and their expression on the host. This was because an attack on the vegetative cycle of the plant can easily be translocated on the neck. Similar to the findings, Ghatak et al. (2013) observed the aggressiveness of P. grisea and reported the epidemics of leaves during the early stages of the crop cycle leads to a high probability for neck infections during the reproductive stage. This is due to the numerous population shifts occurring. However, this differs with genotype resistance to the pathogen since various resistant genotypes will tend to show hypersensitivity therefore leading to no more spread of the disease unlike susceptible genotypes such as KNE 741 that have a high probability of expressing both types of blast disease.
Genetic diversity of P. grisea in major finger millet growing areas in Kenya
Genetic variability is important for proper understanding of blast mechanism and for development of strategies for the control of most fungal diseases. Few studies have focused on genetic variability of M. grisea; the use of RAPD by Singh and Kumar (2010) who confirmed the variability and virulence complexity of Magnaporthe grisea. Takan et al. (2012) used AFLP technology to show genetic variation pattern, adaptive divergence of host specific forms of M.grisea and the use of MGR- RFLP by Babujee and Gnanamanickam (2000) distinguished rice and finger millet blast fungi in India. Recent studies include the use of SSR markers (Jagadeesh et al., 2020; Yadav et al., 2019; Ngernmuen et al., 2019). Similar to this study is Anjum et al. (2016) who evaluated finger millet using SSR markers to show genetic variability in P. grisea.
In this study, genetic diversity indicated the existence of different strains collected from different environments.
The average number of observed and effective number of alleles reported in the study (2 and 1.71) and indication of the number of frequent alleles that would achieve expected heterozygosity in the population. This finding was slightly lower than that reported by Babu et al. (2013) (6.18). This variation in the number of alleles has been reported in other studies (Kaye et al., 2003; Zheng et al., 2008; Fujita et al., 2009). This could be due to few number of markers and samples, nature of MGM markers which were more specific to rice than finger millet and possible difference in the level of genetic variation in different areas (Salem et al., 2010).
MGM markers had lower scores of PIC and genetic diversity compared to Pyrm. Among the MGM markers, MGM 454 scored high PIC (0.3705) and genetic diversity (0.4911) while MGM 437 had the lowest 0.2044 and 0.2311 for PIC and genetic diversity respectively. MGM 454 has a higher motif number (ct-29) compared to MGM 437 (tct-11) (http://ibi.zju.edu.cn/pgl/MGM/index.html). Higher repeat motif is linked to the coverage area of the primer which directly impacts primer amplification and detection (Wang et al., 2009). The PIC and genetic diversity values in this study were similar to those reported by Anjum et al. (2016) for MGM 454 (0.40, 0.32) and higher for MGM 437 (0.08, 0.08).
Markers Pyrm 15-16 had PIC values of 0.3318 and 0.3739 respectively while Pyrm 61-62 had 0.785 and 0.760 respectively. These values were lower than those reported by Babu et al. (2013). The higher values reported by Babu et al. (2013) could be due to the fact that the isolates of M. grisea used were from a combination of finger millet, foxtail millet and rice. Anjum et al. (2016) who incorporated the use of the same markers as those in the study recorded a 0.59 and 0.54 on Pyrm 15-16 and Pyrm 61-62 respectively from isolates of P. grisea from finger millet. The higher values reported by Babu et al. (2013) could be due to the fact that their study used rice, foxtail millet and finger millet while in this study only finger millet is used.
Genetic diversity for Pyrm 15-16 and Pyrm 61-62 was 0.42 and 0.49 respectively which was almost similar to the findings of Anjum et al. (2016) (0.59 and 0.54); while Babu et al. (2013) reported higher values of 0.803 and 0.780 for the same markers. The higher value reported could be due to genetic diversity of the pathotypes collected from different crops; while this study’s own is in contrast to Anjum et al. (2016) who used P. grisea isolates collected from finger millet only. This variation in values with the same pathogen assessed could be due to host-pathogen specificity and adaptation of the pathogen to a particular host; this in turn could have influence on the variability of the pathogen hence higher values recorded (Tribble et al., 2013).
The results on factorial analysis showed that the samples from all the five sites clustered randomly with no distinct pattern observed. For example, Cluster 1 comprised 2 sub clusters. Sub-cluster 1 comprised isolates 2, 3, 4 and 5 from Nakuru, 3 and 4 from Alupe and 3 and 6 from Koibatek which appeared as duplicates and isolate 6 from Bomet which clustered as a distinct individual. This finding is in line with other numerous studies on finger millet who found out that there was geographical differentiation between strains (Rebib et al., 2014). This suggests the non exixtence of sexual reproduction among strains of P. grisea and therefore pathogen changes with time through evolution (Fry et al., 2015; Bengtsson, 2003).
Phylogenetic analysis revealed that P. grisea in the study regions was diverse with no geographical grouping with some strains from different regions observed to cluster in same sub clusters as duplicates with few appearing distinct. This observation was similar to findings of Longya et al. (2020) who also failed to deduce regional differentiation of rice P. grisea in Thailand. Similar findings have been documented by Anjum et al. (2016) and Singh and Kumar (2010).
AMOVA indicated there was huge diversity within P. grisea isolates (87%) and low diversity among the selected regions (13%). This implies that majority of the observed variation in the P. grisea was due to genetics rather than geography. The pathogen varied genetic diversity has challenges in development of management and control of the pathogen (Mia, 2013). Similar to the findings, Kumar et al. (1999) and Rebib et al. (2014) reported a huge diversity occuring within populations as opposed to among populations of Magnaporthe grisea of rice, which was mainly linked to the varied genetic make up of the pathogen.
CONCLUSION AND RECOMMENDATIONS
The findings of this study showed that there were differences in the finger millet blast (Pyricularia grisea) strains existing in the major finger millet growing area in Kenya (Alupe, Bomet, Makueni, Koibatek and Nakuru). The key variations were associated with morphology, pathogenicity and genetic diversity. The morphological test revealed that the pathogen from Bomet and Makueni as compared to those from Alupe, Nakuru and Koibatek). The pathogenicity test showed that environment plays a significant role in the physical appearance of the pathogen which is mainly associated with rainfall, temperature and humidity of the regions. Molecular diversity showed that there was large variation within the isolates as opposed to among the isolates indicating the possibility of finding same strains of the pathogen in different environments as opposed to having same strains in the same environment. Blast populations are genetically diverse and the relationship among them can be identified by use of specific SSRs for the selected pathogen. From this study it is clear that P. grisea diversity is important in disease management strategies, disease dynamics and host-pathotype understanding which can lead to development of resistant finger millet hosts. Therefore there is need for more studies to be done on the P. grisea affecting finger millet in more areas of Kenya using different types of markers. It is also important to do sequencing on the isolates of finger millet genotypes and documented in Kenya.
The authors have not declared any conflict of interests.
The authors acknowledge the Kenya Climate Smart Agricultural Project (KCSAP) for funding this research project. Also, they appreciate the Kenya Agricultural and Livestock Organization (KALRO) and Egerton University for providing the biotechnology laboratories and greenhouse where the experiment was conducted. Appreciation also goes to the technologists Mr. Manfred Miheso and Mr. Cyrus Kimani for their support in the experiments.
REFERENCES
|
Aneja KR (2005). Practical Text Book of Microbiology.
|
|
|
|
Anjum S, Nagaraja A, Nagamma G, Patil S, Konda S, Gowda MC (2016). Molecular variability of finger millet isolates of Pyricularia grisea from different regions of India using SSR markers. Journal of Pure and Applied Microbiology 10(1):437-446.
|
|
|
|
|
Babu TK, Sharma R, Upadhyaya HD, Reddy PN, Deshpande SP, Senthilvel S, Thakur RP (2013). Evaluation of genetic diversity in Magnaporthe grisea populations adapted to finger millet using simple sequence repeats (SSRs) markers. Physiological and Molecular Plant Pathology 84:10-18.
Crossref
|
|
|
|
|
Barnett HL, Hunter BB (1960). Illustrated Genera of Imperfect Fungi. 2nded. P 71.
|
|
|
|
|
Bengtsson BO (2003). Genetic variation in organisms with sexual and asexual reproduction. Journal of Evolutionary Biology 16(2):189-199.
Crossref
|
|
|
|
|
Cary NC (2002). SAS Institute Inc. USA, SAS for Windows Release 8.
|
|
|
|
|
Choi J, Park SY, Kim BR, Roh JH, Oh IS, Han SS, Lee YH (2013). Comparative analysis of pathogenicity and phylogenetic relationship in Magnaporthe grisea species complex. PloS One 8(2):e57196.
Crossref
|
|
|
|
|
Dellaporta S (1994). Plant DNA miniprep and microprep: versions 2.1-2.3. In The Maize Handbook Springer, New York, NY. pp. 522-525.
Crossref
|
|
|
|
|
Babujee L, Gnanamanickam SS (2000). Molecular tools for characterization of rice blast pathogen (Magnaporthe grisea) population and molecular marker-assisted breeding for disease resistance. Current Science-Bangalore 78(3):248-257.
|
|
|
|
|
Esele JP (2002). Diseases of Finger Millet: A Global Overview. Sorghum and Finger Millet Diseases pp. 19-26.
Crossref
|
|
|
|
|
Fr?c M, J?dryczka M, Hannula ES (2019). Soil Fungal Biodiversity for Plant and Soil Health. Frontiers Media SA.
Crossref
|
|
|
|
|
Fry WE, Birch PR, Judelson J, Grünwald HS, Danies NJ, Everts G, McGrath MT (2015). Five reasons to consider Phytophthora infestans a reemerging pathogen. Phytopathology 105(7):966-981.
Crossref
|
|
|
|
|
Fujita K, Shimazaki M, Furiya T, Takayanagi T, Suzuki S (2009). Genetic variation among Koshu (Vitis vinifera L.) accessions generated by retrotransposon insertion into genome. American Journal of Enology and Viticulture 60(4):490-496.
|
|
|
|
|
Gashaw G, Alemu T, Tesfaye K (2014). Morphological, physiological and biochemical studies on Pyricularia grisea isolates causing blast disease on finger millet in Ethiopia. Journal of Applied Biosciences 74:6059-6071.
Crossref
|
|
|
|
|
Getachew G, Alemu T, Tesfaye K (2013). Evaluation of disease incidence and severity and yield loss of finger millet varieties and mycelial growth inhibition of Pyricularia grisea isolates using biological antagonists and fungicides in vitro condition. Journal of Applied Biosciences 73:5883-5901.
|
|
|
|
|
Getachew J, Gashaw L, Tesfaye A, Kassahun T (2014). Morphological, physiology and biochemical studies on Pyricularia grisea isolates causing Blast disease on finger millet. Ethiopia Journal of Applied Biosciences 74:6059-6071.
Crossref
|
|
|
|
|
Ghatak A, Willocquet L, Savary S, Kumar J (2013). Variability in aggressiveness of rice blast (Magnaporthe oryzae) isolates originating from rice leaves and necks: a case of pathogen specialization? PloS One 8(6):e66180.
Crossref
|
|
|
|
|
Jagadeesh D, Kumar MP, Amruthavalli C, Devaki NS (2020). Genetic diversity of Magnaporthe oryzae, the blast pathogen of rice in different districts of Karnataka, India determined by simple sequence repeat (SSR) markers. Indian Phytopathology 73(4):713-723.
Crossref
|
|
|
|
|
Kariaga MG, Wakhungu J, Were HK (2016). Identification of rice blast (Pyricularia oryzae Cav.) races from Kenyan rice growing regions using culture and classical characterization. Journal of Resource Agriculture and Animal Science 4(4):16-24.
|
|
|
|
|
Kaye C, Milazzo J, Rozenfeld S, Lebrun MH, Tharreau D (2003). The development of simple sequence repeat markers for Magnaporthe grisea and their integration into an established genetic linkage map. Fungal Genetics and Biology 40(3):207-214.
Crossref
|
|
|
|
|
Khosravi S, Safari M, Emam?Djomeh Z, Golmakani MT (2019). Development of fermented date syrup using Kombucha starter culture. Journal of Food Processing and Preservation 43(2):e13872.
Crossref
|
|
|
|
|
Kihoro J, Bosco NJ, Murage H, Ateka E, Makihara D (2013). Investigating the impact of rice blast disease on the livelihood of the local farmers in greater Mwea region of Kenya. SpringerPlus 2(1):1-13.
Crossref
|
|
|
|
|
Klaubauf S, Tharreau D, Fournier E, Groenewald JZ, Crous PW, De Vries RP, Lebrun MH (2014). Resolving the polyphyletic nature of Pyricularia (Pyriculariaceae). Studies in Mycology 79:85-120.
Crossref
|
|
|
|
|
Kumar A, Metwal M, Kaur S, Gupta AK, Puranik S, Singh S, Yadav R (2016). Nutraceutical value of finger millet [Eleusine coracana (L.) Gaertn.], and their improvement using omics approaches. Frontiers in Plant Science 7:934.
Crossref
|
|
|
|
|
Kumar J, Nelson RJ, Zeigler RS (1999). Population structure and dynamics of Magnaporthe grisea in the Indian Himalayas. Genetics 152(3):971-984.
Crossref
|
|
|
|
|
Liu K, Muse SV (2005). PowerMarker: an integrated analysis environment for genetic marker analysis. Bioinformatics 21(9):2128-2129.
Crossref
|
|
|
|
|
Longya A, Talumphai S, Jantasuriyarat C (2020). Morphological characterization and genetic diversity of rice blast fungus, Pyricularia oryzae, from Thailand using ISSR and SRAP markers. Journal of Fungi 6(1):38.
Crossref
|
|
|
|
|
Meena BS (2005). Morphological and molecular variability of rice blast pathogen Pyricularia grisea (cooke) sacc. Doctoral dissertation, UAS, Dharwad.
|
|
|
|
|
Mgonja MA, Lenne JM, Manyasa E, Sreenivasaprasad S (2007). Finger millet blast management in East Africa Creating opportunities for improving production and utilization of finger millet 2(1):19-20.
Crossref
|
|
|
|
|
Muimba-Kankolongo A (2018). Food Crop Production by Smallholder Farmers in Southern Africa: Challenges and Opportunities for Improvement. Academic Press.
Crossref
|
|
|
|
|
Tribble GD, Kerr JE, Wang BY (2013). Genetic diversity in the oral pathogen Porphyromonas gingivalis: molecular mechanisms and biological consequences. Future Microbiology 8(5):607-620.
Crossref
|
|
|
|
|
Ngernmuen A, Suktrakul W, Damchuay K, Longya A, Kate-Ngam S, Jantasuriyarat C (2019). Substantial enhancement of high polymorphic SSR marker development using in silico method from 18 available rice blast fungus genome sequences and its application in genetic diversity assessment. Biologia 74(9):1181-1189.
Crossref
|
|
|
|
|
Pagliaccia D, Urak RZ, Wong F, Douhan LI, Greer CA, Vidalakis G, Douhan GW (2018). Genetic structure of the rice blast pathogen (Magnaporthe oryzae) over a decade in North Central California rice fields. Microbial Ecology 75(2):310-317.
Crossref
|
|
|
|
|
PE P, RS (2012). GenAlEx 6.5: genetic analysis in Excel. Population genetic software for teaching and research-an update. Bioinformatics 28(19):25-37.
Crossref
|
|
|
|
|
Perrier X (2018). Jacquemoud Collet, JP 2006. DARwin software.
|
|
|
|
|
Perrier X, Jacquemoud-Collet JP (2015). DARwin software. 2006.
|
|
|
|
|
Prajapati VP, Sabalpara AN, Pawar DM (2013). Assessment of yield loss due to finger millet blast caused by Pyricularia grisea (Cooke) Sacc. Trends in Biosciences 6:876-788.
|
|
|
|
|
Ramakrishnan M, Antony CS, Duraipandiyan V, Vinod KK, Kalpana K, Al-Dhabi NA, Ignacimuthu S (2016). Tracing QTLs for leaf blast resistance and agronomic performance of finger millet (Eleusine coracana (L.) Gaertn.) Genotypes through association mapping and in silico comparative genomics analyses. PLoS One 11(7):e0159264.
Crossref
|
|
|
|
|
Rao AN (1990). Estimates of losses in finger millet (Eleusine coracana) due to blast disease (Pyricularia grisea). Mysore Journal of Agricultural Sciences 24(1):57-60.
|
|
|
|
|
Rebib H, Bouraoui H, Rouaissi M, Brygoo Y, Boudabbous A, Hajlaoui MR, Sadfi-Zouaoui N (2014). Genetic diversity assessed by SSR markers and chemotyping of Fusarium culmorum causal agent of foot and root rot of wheat collected from two different fields in Tunisia. European Journal of Plant Pathology 139(3):481-495.
Crossref
|
|
|
|
|
Saleh D, Milazzo J, Adreit H, Fournier E, Tharreau D (2014). South?East Asia is the center of origin, diversity and dispersion of the rice blast fungus, Magnaporthe oryzae. New Phytologist 201(4):1440-1456.
Crossref
|
|
|
|
|
Salem KF, Varshney RK, Röder MS, Börner A (2010). EST-SSR based estimates on functional genetic variation in a barley (Hordeum vulgare L.) collection from Egypt. Genetic Resources and Crop Evolution 57(4):515-521.
Crossref
|
|
|
|
|
Shahriar SA, Imtiaz AA, Hossain MB, Husna A, Eaty MN (2020). Rice Blast Disease. Annual Research & Review in Biology 2(1):50-64.
Crossref
|
|
|
|
|
Singh Y, Kumar J (2010). Study of genomic fingerprints profile of Magnaporthe grisea from finger millet (Eleusine coracona) by random amplified polymorphic DNA-polymerase chain reaction (RAPD-PCR). African Journal of Biotechnology 9(46):7798-7804.
Crossref
|
|
|
|
|
Sreenivasaprasad S, Takan JP, Obilana AB, Manyasa E, Brown AE, Bandyopadhyay R, Muthumeenakshi S (2004). Finger millet blast in East Africa: pathogen diversity and disease management strategies 8030:118. Final Technical Report.
|
|
|
|
|
Takan JP, Chipili J, Muthumeenakshi S, Talbot NJ, Manyasa EO, Bandyopadhyay R, Brown AE (2012). Magnaporthe oryzae populations adapted to finger millet and rice exhibit distinctive patterns of genetic diversity, sexuality and host interaction. Molecular biotechnology 50(2):145-158.
Crossref
|
|
|
|
|
Tredway LP, Stevenson KL, Burpee LL (2003). Mating type distribution and fertility status in Magnaporthe grisea populations from turf grasses in Georgia. Plant Disease 87(4):435-441.
Crossref
|
|
|
|
|
Tuite J (1969). Plant pathological methods. Fungi and bacteria. Plant pathological methods. Fungi and bacteria. Minneapolis, Burgess Publishing Co.
|
|
|
|
|
Underwood BA (2000). Overcoming micronutrient deficiencies in developing countries: is there a role for agriculture? Food and Nutrition Bulletin 21(4):356-360.
Crossref
|
|
|
|
|
Wang F, Jiang T, Sun Z, Teng SL, Luo X, Zhu Z, Lu T (2009). Neuregulin genetic variation and anterior cingulum integrity in patients with schizophrenia and healthy controls: Journal of Psychiatry and Neuroscience 34(3):181.
|
|
|
|
|
Wekesa CM, Kimurto PK, Oduori CO, Towett BK, Jeptanui L, Ojulong H, Siambi M (2019). Sources of Resistance to Blast Disease (Pyricularia grisea L.) in Finger Millet (Eleusine Coracana) Germplasm. Journal of Life Sciences 13:34-47.
Crossref
|
|
|
|
|
Yadav MK, Aravindan S, Raghu S, Prabhukarthikeyan SR, Keerthana U, Ngangkham U, Parameswaran C (2019). Assessment of genetic diversity and population structure of Magnaporthe oryzae causing rice blast disease using SSR markers. Physiological and Molecular Plant Pathology 106:157-165.
Crossref
|
|
|
|
|
Zheng W, Wang L, Meng L, Liu J (2008). Genetic variation in the endangered Anisodus tanguticus (Solanaceae), an alpine perennial endemic to the Qinghai-Tibetan Plateau. Genetica 132(2):123-129.
Crossref
|
|