ABSTRACT
Wheat (Triticum aestivum L.) occupied 17 percentage of the total cultivated land in the world whereas it has contributed major role to maintain the Nepalese agricultural gross domestic products (MOAC, 2012) but area of cultivation has been decreasing. Moreover, potential yield of popular varieties have reduced by the effect of drought. To combat from drought loss, tolerant variety is one of the major solutions to address that issue. From this point of view, an experiment was conducted in split plot design from November 2009 to May 2010. The result showed significant variations among both for genotypes as well as to both level of water management. The average leaf area were reduced by 8.80 cm2, 0.2655 kg biomass yield, 6.64 g thousand kernel weight, 4.11 booting days, 3.23 heading days, 1.26 flag leaf senescence and 0.0706 kg yield in drought condition. Similarly, WK1123 has least drought susceptibility index for yield. However, relative water content and chlorophyll content were correlated significantly with yield. To conclude, genotypes WK1701, WK1444, WK1123, 3EBWYT513 and 3EBWYT512 considered as the most drought tolerant and might be used as a variety in drought prone area of Nepal.
Key words: Wheat, drought, stress chlorophyll content and relative water content.
Wheat (Triticum aestivum L.) is the first important cereals crop in the world and staple food for 35% of the world’s population and provides more calories and proteins in the world’s diet than any other crop. In Nepal, total area of 765317 ha and 1846142 mt of production with productivity of 2412 kg/ha (MOAD, 2012/2013). Similarly, wheat has been grown both in irrigated and unirrigated conditions. However, 63.19% of wheat has been cultivated in completely irrigated condition with improved varieties but 34.44% of wheat grown in unirrigated Nepalese condition (MOAD, 2012/2013). Therefore, it will be wise to develop the drought tolerant varieties which would address the issue of yield loss through drought. The prevailing cropping system, rice after wheat would enforced to the plantation of wheat in late sown condition that generally damaged the crop by combined effect drought and terminal heat stress. Drought stress has been recognized as one of the major abiotic factors limiting wheat production in Nepal (Sharma et al., 2008). Due to increasing summer temperature, uneven annual rainfall pattern and depleting water resource for irrigation, breeding wheat for drought tolerance will become an increasingly higher priority in this region (Joshi et al., 2007). Thus, wheat breeding for drought tolerance or higher water use efficiency is needed to supply food to the growing Nepalese population therefore, this study aimed to assess the genetic variability of drought adaptive traits and their association with drought tolerance which is vital for the development of drought tolerant wheat cultivars.
The research site and experimental design
The field experiment was conducted at the research farm of the Institute of Agriculture and Animal Science (IAAS), Rampur, Chitwan, Nepal, from November 2009 to June 2010. The geography of this location is 27°64’ N latitude and 84° 34’ E longitude and at an altitude of 228 m above sea level, respectively. The research location is characteristics of subtropical climate and experiment was setup from November, 2009 to June, 2010 after that, field remained fallow until the next season, that is, November, 2010. Thirty genotypes were used in the research where most of the lines were Nepalese landraces and advanced lines derived from Agriculture Botany Division NARC, Khumaltar, Nepal and commercial varieties and check used was WK1204. The experiment was laid out in a split plot design with optimum moisture and moisture stressed environments as main plot factors and 30 wheat genotypes as sub-plot factors. Each plot was 0.75 m2. The rain-out shelter (stress) plot was erected over the plot at the start of tillering where trench had been made around the main plot, provided with a 1 m deep and 0.5 m wide ditch around the edge to prevent rain coming off to the shelter from seeping into the plot. Other intercultural operations and cultivation practices were completed according to the national recommendation for wheat cultivation.
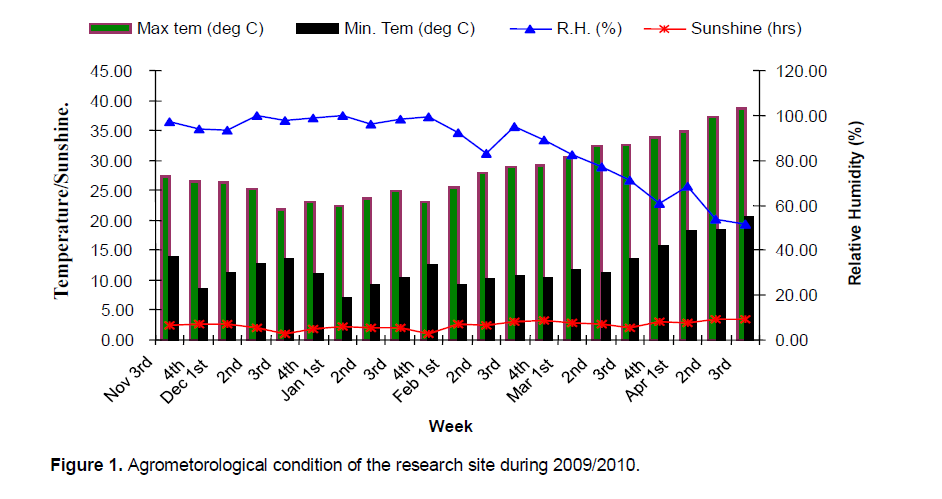
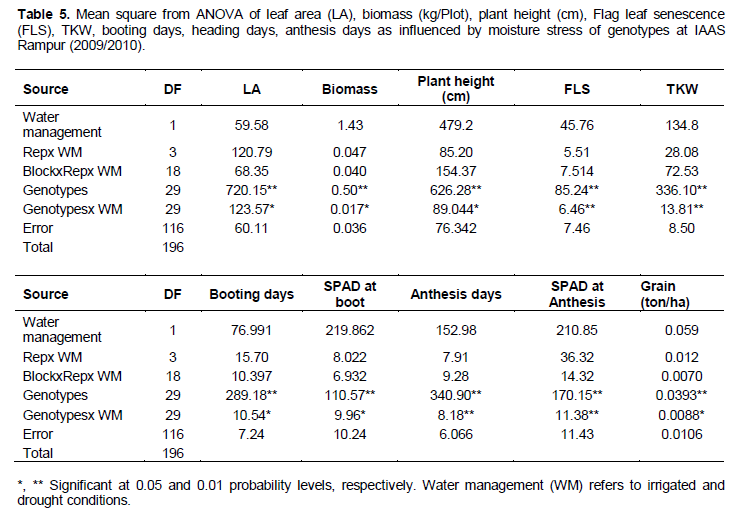
Each set of experiment was replicated three times where composite soil sample had been taken from the soil after land preparation from the field at different depth (0 to 30 cm). The soil texture class was determined sandy loam where moisture content was found 75% of the field capacity at the time of seeding for both condition. For moisture stressed experiment, soil moisture content was maintained at 35% of the field capacity from heading to flowering. The maximum temperature recorded was 40°C in the month of April. The Minimum- maximum, standard deviation and Coefficient of variation for the quantitative traits were being measured. Differentiation between populations was usually quantified using the difference in mean expression (t-test) (Spagnoletti Zeuli and Qualset, 1987) (Figure 1).
The following were the traits measured in this experiment:
Canopy temperature depression
The canopy temperature depression was calculated by using the following formula.
Canopy Temperature Depression (CTD) = Ambient temperature – Canopy Temperature
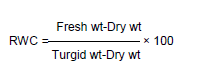
Relative water content
RWC was calculated from the equation of Schonfeld et al. (1988) as:
Flag leaf duration, days of booting, days of anthesis, days of heading, Panicle length, seed weight per spike, leaf area, plant height, productive tiller per plot, thousand kernel weight (TKW) and drought susceptibility index (DSI).
Drought susceptibility indices for grain yield of each genotype were calculated as proposed by Fischer and Maurer (1992). DSI = [(1-Y/Yp)/D], Y = yield at normal sown condition, Yp = yield at drought sown condition, D = stress intensity = 1- X/Xp, X = mean Y of all genotypes, and Xp = mean Yp of all genotypes. Analysis of variance and calculation of means was done by using Cropstat 7.2. The main plot treatment comparison was done by paired t-test with SPSS. UPGMA clustering and PCA was done using Minitab-14.
Days to booting and heading
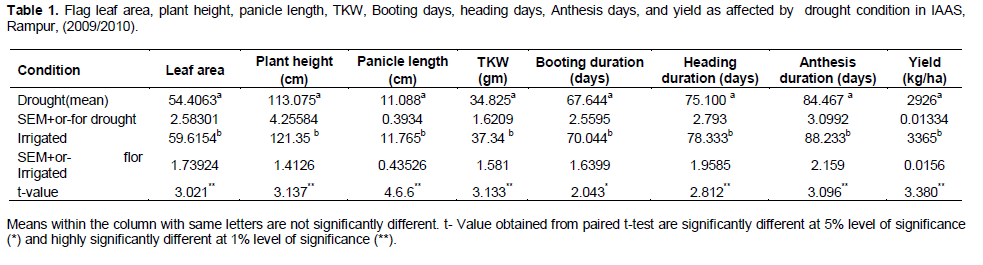
The mean number of days to booting in irrigated normal sown condition was 70.044 where 67.6444 days for the stress conditions. Stress condition and normal condition were nonsignificant with dates to booting as seen by paired t-test (Table 1). In the irrigated conditions, WK1627 had minimum days to booting days (61) whereas WK1719 was identified as late booted (82). The decrease in heading days in stressed plants as compared to non stress was reported by Reynolds et al. (1993).
Means within the column with same letters are not significantly different. t- Value obtained from paired t-test are significantly different at 5% level of significance (*) and highly significantly different at 1% level of significance (**).
Days to flag leaf senescence
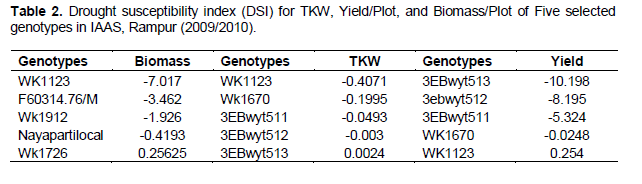
The mean number of days to flag leaf senescence differed non significantly for the main plot treatment as shown by paired t-test (Table 1) but significantly different was seen through the Analysis of Variance. The mean numbers of days to flag leaf senescence were found 117.3 days and 114.67 days for Irrigated and drought conditions respectively. In the drought condition, WK1627 was senesced as earliest with 109 days whereas WK1123 senesced in later with 123 days. Later on in the growth cycle, water stress reduces the green leaf duration (GLD) from accelerated senescence by Reynold et al. (1993) (Table 2).
Thousand kernel weight
There was significant difference in the mean thousand kernel weight for the Irrigated and drought condition as seen by paired t-test. The 37.34 and 34.825 g were mean thousand kernel weight (TKW) for irrigated and drought plot, respectively. The Godawari local had 20.847 g of thousand kernel weight which was found as minimum among the others and maximum (42.37 g) kernel weight was found to WK1700. However, genotypes WK1123 and WK1670 had least drought susceptibility index and considered as most useful for drought environment. Sharma et al. (2008) had identified reduction in kernel weight as a potential tool for indirect selection criteria for grain yield under drought stress.
Plant height
The drought and irrigated plots have had mean plant height of 113.07 and 121.35 cm respectively. The significant variations were shown among genotypes. In addition, shortest genotype was WK1204 (93.26 cm) where as Godawari local had been tallest among genotypes in drought condition. However, WK1912 was found as shortest (108.56 cm) and tallest was Godawari local with 134.4219 cm. Drought significantly reduced internodes length and thus reduced the length of the main stem by Richards (1992). This decrease in plant height negatively correlated (-0.798) with high yield under stressed condition which guessed for the stem reserve mobilization might transferred towards the spikes.
Yield and yield component traits
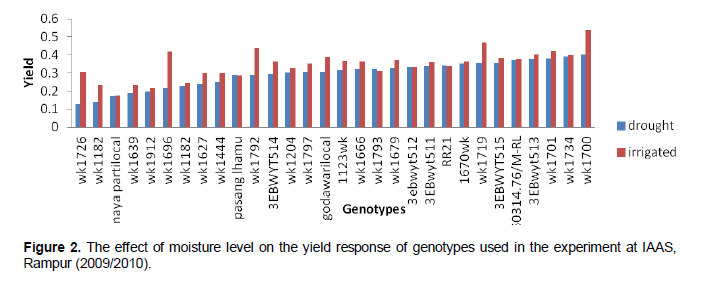
There were significant differences between water management for mean per plot yield as seen by pair t-test (Table 1). In more clearly, mean per plot yield in drought and irrigated condition were 2563 and 3269 kg/ha. Moreover, highly significant yield differences among genotypes had been found for drought condition. In drought condition, WK 1701 and WK1700 had produced yield of 3737 and 3541 kg/ha respectively but, lowest yield found for Nayaparti local (1590.867 kg/ha). In contrast to drought condition, irrigated condition produced highest yield of 5504 kg/ha from WK1700 but least yield had been found from F60314.76/M-RL(1975 kg/ha) (Figure 2).
Drought susceptibility index
Drought susceptibility index was calculated for yield and yield related traits. This was important because we need to address higher yield potential against drought condition (Blum et al., 1989) (Table 3). Drought susceptibility indices are use either based on drought resistance or susceptibility of genotypes (Blum et al., 1989). Genotypes WK 1123, 3EBWYT513 and 3EBWYT512 were less influenced by the drought for biomass yield and thousand kernel weight.
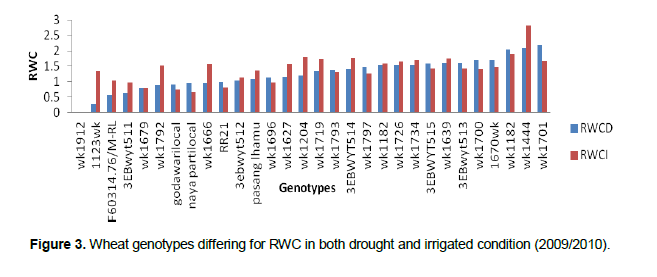
Relative water content
Mean relative water content had valued for 1.370 in normal sown wheat while it was 1.244 in drought condition. Genotypes with highest RWC was WK1701 (2.19) but lowest was found to WK1123 (0.26) in drought therefore WK1701 might be more drought tolerance than rest of genotypes. Therefore genotypes which maintained higher RWC under stress conditions had maintained higher yield in spite of drought condition suggested for the existence of drought tolerance traits which has been supported by Araus et al. (1997) (Figure 3). The genotypic correlation between gain yield and RWC under water stress condition was positively significant (0.84**) suggested that under drought condition higher relative water content in leaf might contributed with the better yield (Blum et al., 1989).
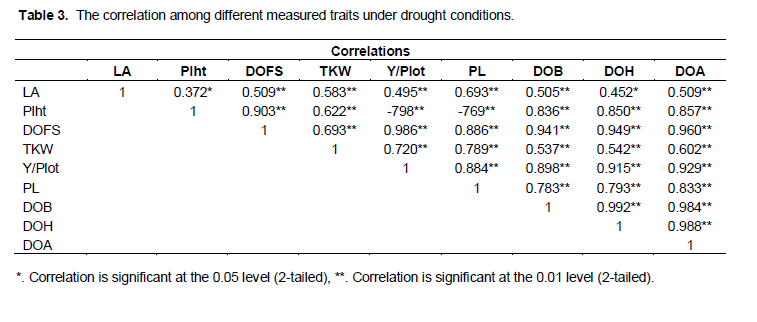
Correlation studies
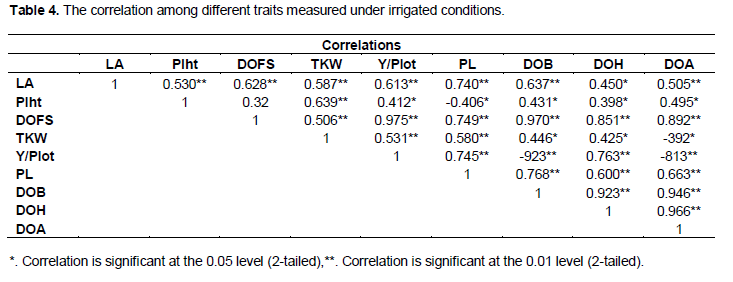
Yield had significant correlation with Thousand Kernel Weight and days to flag leaf senescence to each of drought and irrigated condition but negative correlation of plant height with grain yield was found under drought condition (Table 4) which was supported from Gill et al. (1989) and Patil and Jain (2002). On the other hand, spike length was positively correlated significantly with weight of grains per spike in both condition therefore selection based on panicle length would favor for the bold grain in drought condition. Similar findings supported by Shah et al. (1988). Briefly, highly significant positive association had been established for days to flag leaf senescence, thousand kernel weight, and panicle length, days of booting, days of heading and days to anthesis with higher yield per plot in drought condition. Ultimately, that would help to selection based on other traits rather than yield. The all the measured traits were significantly correlated with each other in irrigated condition (Table 5) suggested that selection based on other traits would beneficial for the indirect selection of genotypes as a variety for future use.
Canopy temperature depression (CTD)
Average CTD in stress at three growth stages recorded highest for WK1444, WK1639 and WK1701 and had maintained lower canopy temperature. Relatively lower canopy temperatures under stress indicate the better plant water status and CTD were positively correlated with yield in stress condition (Blum et al., 1989). Similar kind of research result had been observed for correlation between CTD with yield advantage in stress condition.
Soil physical analysis and development meter (SPAD)
There were significant differences of SPAD values between drought and irrigated condition to illustrate, highest SPAD value had been found in normal irrigated condition with 24.82 and little less value was defined in drought condition worth 23.54. This decrease in value of SPAD was closely related with the decrease in value of chlorophyll and ultimately gave lower yield which has supported from Araus et al. (1997) (Table 6).
Multivariate analysis
UPGMA clustering
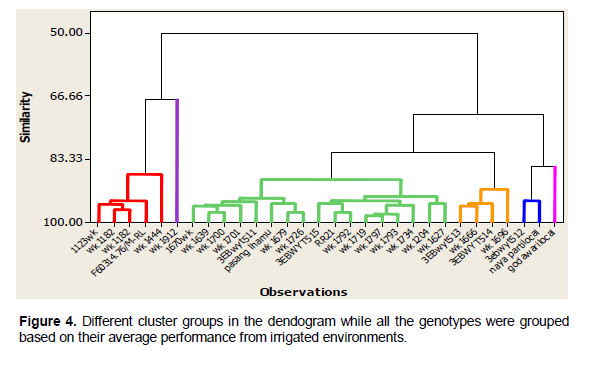
Four clusters were seen with a minimum of 50% similarity level in UPGMA clustering where Cluster 1 consist of 4 genotypes WK1123, WK1182, F60314.76/M-RL and WK1444. The member of this cluster were characterized by their lowest drought susceptibility index for Biomass, TKW, Yield /Plot, Number of tillers per plot and Number of seed per panicle therefore these were selected and categorized as the most drought resistance. Cluster 2 was developed by the use of Biomass yield/plot, number of tillers per plot. Genotypes consisted WK1670, WK1639, WK1700, WK1701, 3EBWYT511, Pasang lhamu, WK1679, WK1726, 3EBWYT515, RR21, WK1792, WK1793, WK1794, WK1204 and WK1627. The members of this cluster also have mild drought tolerance characters. Similarly, Cluster 3 consist of 3EBWYT513, WK1666, 3EBWYT514 and WK1696 which have categorized on the basis of similar type of plant height in addition to this, heights of these genotypes were highest among other and this group was also characterized on the basis of mild tolerance for drought adaptation on the basis of yield component traits. Cluster 4 was using the days to flag leaf senescence, days to booting, days to heading, days to anthesis, CTD at 13 February and CTD at 24th March. These clusters consist of 3EBWYT512, Nayaparti local and Godawari local (Figure 4).
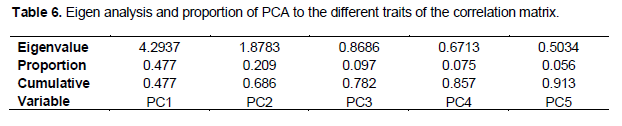
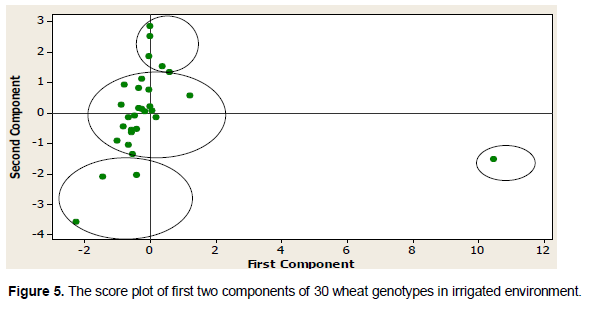
Principle component analysis
The contribution of various parameters in the first three principle components is presented (Table 6). The first three principle component explained variation of 78.2% of the total variation. PC1 contributed 47.7% of the total variation and PC2 and PC3 contributed 20.9 and 9.7% of the total variation, respectively. Hence, the three components can be regarded the main contributing factors for the grouping of the genotypes across various groups. The PCA supported the results obtained by cluster analysis. It clearly separated the four major groups recognized by the cluster analysis. This PCA analysis clearly showed that there were presences of diversity between and within group of the cluster for many quantitative traits (Figure 5).
The mean per plot yield in drought condition was 2563 kg/ha whereas it was 3269 kg/ha in irrigated condition. To conclude, all the measured traits were correlated medium to high correlation coefficient in both environments. Accordingly, possibility of indirect selection would increase rather than as direct yield component. In summary, least drought sensitive index for yield per plot were found to 3EBWYT513, 3EBWYT512, WK1444 and WK 1701 therefore these genotypes could be used either directly as a variety or used as a parent for hybridization.
The authors have not declared any conflict of interest.
This research was possible due to the financial support from National Agricultural Research and Development fund, Government of Nepal. Similarly, seed materials were received from Agri-botany Division, Nepal Agricultural Research Council, and Government of Nepal. I hearty acknowledge to my major advisor Dr. Surya Kant Ghimire for his constant support and constant guidance throughout the whole research.
REFERENCES
Araus JL, Reynolds MP, Acevedo E (1997). Leaf posture, grain yield, growth, leaf structure, and carbon isotope discrimination in wheat. Crop Sci. 33:1273-1279.
Crossref |
|
|
Blum A, Shipiler L, Golan G, Mayer J (1989). Yield stability and canopy temperature of wheat genotypes under drought stress. Field Crops Res. 22:289-296.
Crossref |
|
|
|
Gill KS, Cox TS, Gill BS (1989). Variation in molecular markers among geographically diverse accessions of Triticum tauschii. Genome 34:354-361. |
|
|
Joshi A, Mishra B, Chatrath R, Ortiz Ferrara G, Singh R (2007). 'Wheat improvement in India: present status, emerging challenges and future prospects. Euphytica 157(3):431-446.
Crossref |
|
|
|
MOAC (2012). Statistical Information on Nepalese Agriculture, Kathmandu: Ministry of griculture and Cooperatives/Agri-Business Promotion and Statistics Division. |
|
|
|
Patil P, Jain MAJ (2002). Prospects for crop production under drought: research priorities and future directions. Ann. Appl. Biol. 147:211-226. |
|
|
|
Reynolds MP, Balota M, Delgado MIB, Amani I, Fischer RA (1993). Physiological and Morphological traits associated with spring wheat yield under hot, irrigated conditions. Aus. J. Plant Physiol. 21:17-30. |
|
|
Schonfeld MA, Johnson RC, Carwer BF, Mornhinweg DW (1988). Water relations in winter wheat as drought resistance indicators. Crop Sci. 28:526-531.
Crossref |
|
|
|
Shah M, Srivastava JP, Kumar A (1988). Effect of water on water potential components in wheat genotypes. Indian J. Plant Physiol. 33:312-317. |
|
|
|
Sharma RC, Ortiz-Ferrara G, Bhatta MR (2008). Regional trial results show wheat yield declining in the eastern Gangetic plains of south Asia. Asian J. Plant Sci. 6:638-642. |
|
|
Spagnoletti Zeuli PL, Qualset CO (1987). Geographical diversity for quantitative spike characters in a world collection of durum wheat. Crop Sci. 27:235-241.
Crossref |