ABSTRACT
Distance sampling with line transect method has been applied by many researchers to monitor and observe varied animals and plants with the aim to estimating population density and/or abundance. The detection and detectabilities of plants and animals with line transect methodology appear to be described as seen in the application software DISTANCE by some four specific models or mathematical functions. This study has established the need for an expansion of the functional space of the application software of the distance sampling with line transect application to cater for differences in species with different biological characteristics, and revealed that the detection of plants and animals of all species of different kinds can be described differently with distinct functions, as differences in biological characteristics of different species can be manifested in their detections and detectabilities.
Key words: DISTANCE, distance sampling, detectability, line transect method, Mole National Park (MNP).
Line transect primarily has had a relatively short history. The earliest attempts to use line transect in detecting animals and estimating their abundance date back to the 1930’s (Buckland et al., 2001), and the first line transect estimator with a rigorous mathematical basis was due to Hayne (1949). Nearly 20 years later, Gates (1968) and Eberhardt (1968) made important contributions to the development of line transect sampling methodology. Eberhardt’s (1968) work was more conceptual and attempted to provide a class of models that were robust to the differing detection process. Line transect methodology involves a process wherein an observer traverses through a line to observe units of interest on both left and right of the line whilst taking recordings of the distances and number of units of interests observed. Observation of objects of interest can either be perpendicular or through an angle theta as Figure 1 illustrates. Burnham et al. (1976) developed a general theory needed for reliable estimation. Anderson and Pospahala (1970) also used polynomials to fit the distance data, but did not provide an underlying theory. The field experiments of Robinette et al. (1974) were important in providing data sets with known abundance, on which estimation methods could be tested. Sen et al. (1974) gave an erroneous formulation.

Burnham and Anderson (1976) corrected this formulation, provided a general framework for both parametric and nonparametric method and applied to data that were either grouped or ungrouped and truncated or un-truncated. In conventional line transect sampling, all animals on the line are assumed to have a certain detection probability which falls off steadily as distances increase (Buckland et al., 2015). An established assumption of this method is that the probability of detection of an object depends solely on its perpendicular distance from the transect line. However, many variables such as visibility, time of visits, weather, and availability of units of interest in the study region, among others may affect the detection probability. These variables however can be factored into the model wherein detections can appear to be conditioned on them with distances of detections as suggested by Marques et al. (2007). The inclusion of these may appear to influence either the shape or the scale or both of the detection function identified.
Buckland et al. (1993) provided an extensive review of distance sampling design and requirements with line transect methodology while Laake et al. (1993) developed the software DISTANCE allowing the computation of the density and abundance parameters based on some specified mathematical functions. The key elements presented by Buckland et al. (1993) relied on the assumption that animals will remain undetected in distance sampling and that the detectability decreases with increasing the distance from the line. The fundamental concept central to the theory is the detection function  where
where  . That is, at distance zero, all the animals on the line are detected with a probability of 1. To derive robust estimates, a minimum of 60 to 80 observations are required across the study area (Buckland et al., 1993). Line transect sampling has been developed along rigorous statistical inference principles. Parametric approaches to modelling were predominant, with the notable exception of Anderson and Pospahala (1970), who rather inadvertently introduced some of the basic ideas that underlie a non-parametric or semi-parametric approach to the analysis of line transect data. Emlen (1971) proposed an ad hoc method that found use in Avian studies.
A general model structure for line transects on perpendicular distances was presented by Seber (1986). For an arbitrary detection function, Seber gave the probability distribution of the distances  and the general form of the estimator of animal density
  . This development was left at the conceptual stage and not pursued to the final step of a workable general approach for deriving line transect estimators. Burnham and Anderson (1980) pursued the general formulation of line transect sampling and gave a basis for the general construction of line transect estimators. They developed the general result
  , where in the parameter
  is a well-defined function of the distance data. The key problem of line transect data analysis was seen to be the modeling of or
  and the subsequent estimation of .
The detection and detectabilities of plants and animals of all species of different kinds are seen generally to be described by the Half Normal, the Uniform, the Negative Exponential, or the Hazard Rate distributions as specified in the DISTANCE software. However differences in biological characteristics of different species of plants and animals including mammals of all types cannot be underestimated. This study is thus aimed at exploring other potential functions that can equally play similar or better roles as those generally employed in describing and modeling detectabilities of units of interest under investigation.
Research questions
i) Are all animals being described by same distributional forms as those specified in DISTANCE software?
ii) Do different species of animals and plants possess different characteristics that can be described by different functions in detections, monitoring and conservation?
Objectives
i) To identify an appropriate statistical distribution that best describes detections of units of interest under study.
ii) To enhance detectability estimation process of rare and elusive events in the distance sampling realm.
iii) To perform a Bayesian analysis of detectability of units of interest conditional on perpendicular distances and other identified covariates in the study area.
iv) To provide appropriate detections periods of units under investigation to visitors or tourists and researchers who intend to visit the Mole National Park for the observation of units under study.
Study area
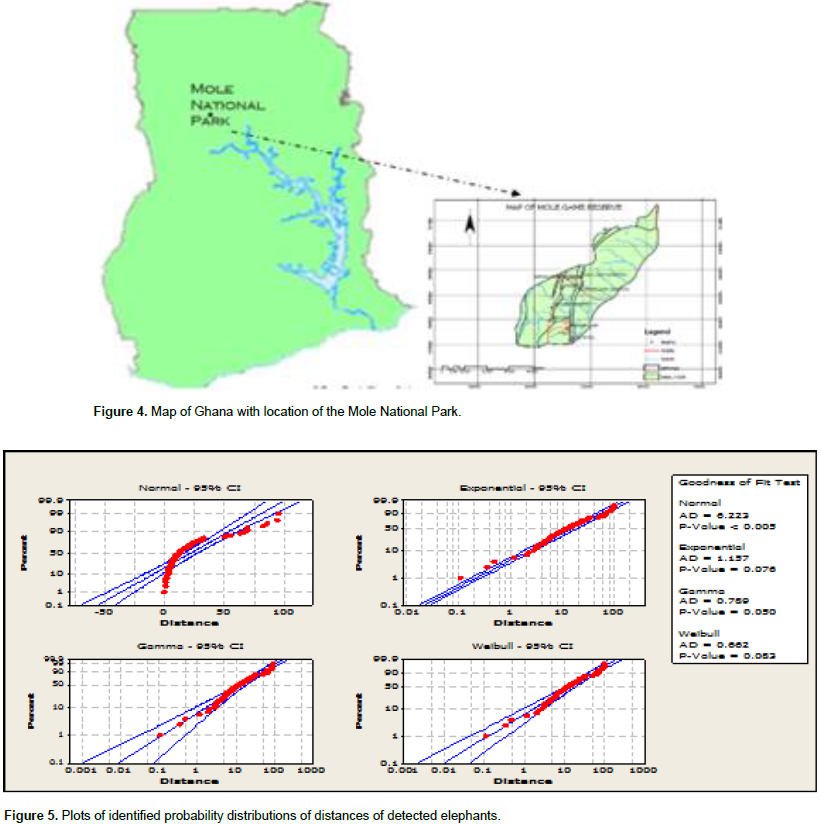
The study area is located in the West Gonja District of Northern Ghana and about 184 km from the Northern Regional capital of Tamale. It covers a total area of 4,755 km2 of the West Gonja District which inhabits several plants and animal species whose densities are of concern to wildlife management and conservation. Briggs (2007) revealed that the MNP represents Ghana’s largest wildlife refuge which is located northwest Ghana on grassland savannah and riparian ecosystems at an elevation of 150 m, with sharp escarpment forming the southern boundary of the park. The park’s entrance is reached through the nearby town of Larabanga. The Lovi and Mole Rivers are ephemeral rivers flowing through the park, leaving behind only drinking holes during the long dry season (Bowell et al., 1993). This area of Ghana as seen in Figure 1 receives over 1000 mm per year of rainfall.
Survey design and transect selection
The sampling design in a line transect study is the procedure by which the transect locations are selected. Desired properties of unbiasedness of estimators will be based as much as possible on the design rather than on assumption about the population (Thompson, 2002). The study employs a direct method of observation along transect lines placed in the study area. Transect lines are identified by employing simple and systematic sampling techniques. Direct methods are based on actual observation of the species in question (large mammals). Visibility and detectability can often pose a problem when surveying terrestrial species; thus, surveys relying on signs are ideal for estimating mammal abundance and habitat use (Hayward et al., 2005; Sadlier et al., 2004; Sullivan et al., 2002), calling for indirect methods of detection as a means to establishing the signs of animal presence.
To select the appropriate transects for the study, a combination of both probability and non-probability sampling designs were employed in order to improve data quality and analysis. These designs included stratification, convenient, and systematic, respectively. Due to the timing of the research and the nature of the study area, it was decided to stratify study area into two major strata (a stratum with and without water bodies) within which separate designs were employed in transect placement in order to optimize detections and improve precision. Conveniently identifying a random start line in each stratum, a combination of both continuous systematic design and discrete parallel transect lines were placed, respectively in the strata so as to avoid discontinuation in detection from one transect to the other whilst ensuring an even spatial distribution of lines in surveyed region.
Thompson (2002) indicates that estimates from n transects are more preferred to those based on single transects. In view of the nature of the study area coupled with resource constraints, a total effort of 4 km was estimated for coverage per day in the study area, for a period of 20 days, spanning 10 months, for at least 2 days per every visit, to traverse through a sample of ten (10) transects of equal lengths in the identified strata using a major route that cuts across the study area as a base. A route perpendicular to the baseline was selected conveniently in each stratum and represented as the first transects and considered as a random start samples from which the remaining eight lines of non-overlapping and widely placed apart were systematically positioned to cover and include specific locations with prior knowledge of having high concentrations of the species of interest in the study area as shown in Figures 2a and b.

Data type
Here, both primary and secondary data were considered. Primary data was gathered within the region of study involving investigator and some supporting staff. Data gathered included both perpendicular distances and the number of Elephants, Hartebeests, Waterbucks and Warthogs detected at various locations of the study region using 10 conveniently and systematically placed transect lines within two stratified locations. Existing information from management of the MNP about the units of interest within the study area constituted the secondary data. A principle of data augmentation was adopted to cater for units undetected but present in the study region and statistical packages such as the Distance, Minitab, R, Easy fit, Open Bugs to mention just a few were extensively used in both data exploration and modelling process involved in this study.
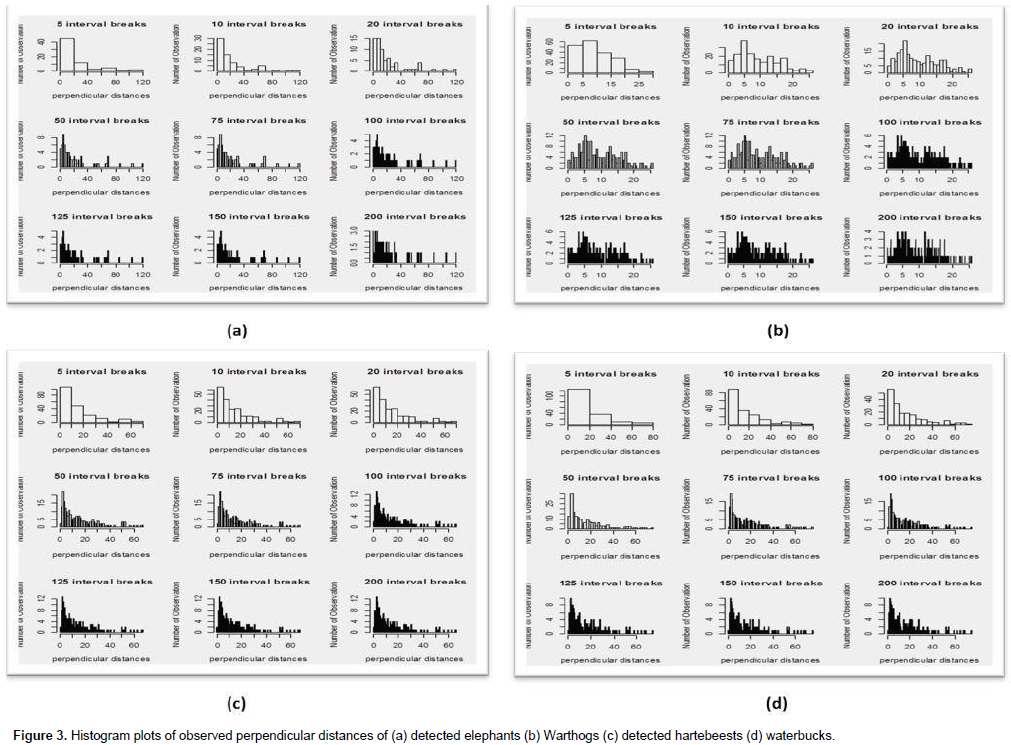
The probability of detection of a unit of interest assumes a major component of the analysis of this thesis. The distance data measured are empirically categorized into different bins of varied sizes to determine the best data grouping in the exploration stage. This also included histogram plots of distance data to check for evasiveness, random movement, heaping, outliers and or truncation distance as shown in Figure 3(a, b, c and d). Figure 3(a, b, c, and d) represent histogram plots of observed species in the MNP at different perpendicular distances relative to the transect lines. In these plots, it is evident that ability to observe units of interest decreases with increasing distances. The plots also reflect differences in detection abilities among the four different species as a reflection of differences in biological characteristics.
Possible key functions and series expansions with their formulations in the DISTANCE software
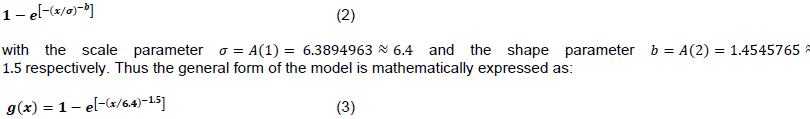
With the application of these, where in detections are conditioned on perpendicular distances only, it is observed that the detection of elephants in the MNP is described by the hazard function based on the lowest AIC value. The use of the AIC is due to the fact that it contains a penalty term to penalize functions with more parameters so that over parameterization will be checked. The detectability function appears in the form:
Equation 1 is found to be represented mathematically as:
Conditioning on both distance and other identified covariates also suggest a hazard rate key function with no adjustment term as the best model with minimum AIC = 299.5287. The detectability function assumes the form:

Comparing the two conditional cases, it can be observed that the covariates included in the Hazard rate model have increased both the scale and shape parameters from 6.4 to about 16.34 and 1.5 to about 2.507, respectively.
Distribution identification for distances of detected elephants in the MNP
To identify the distribution, observed data is assumed to follow or best fit the study and explores several probability plots to obtain a fit that satisfies the following as reflected in Figure 3:
i) The plotted points roughly forming or following a straight line and appears close to the fitted distribution line and
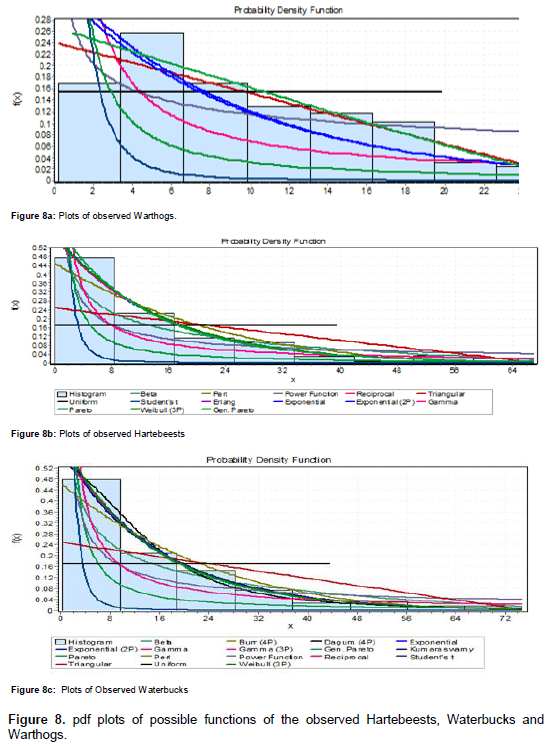
ii) Produces a minimum Anderson-Darling statistic with an associated probability greater than the selected significant level as observed in Figure 4. In Figure 5, it can be observed that the Exponential, the Gamma and Weibull appear somewhat good to explaining the distribution of the elephant observations in the Mole National Park. The pdf plots of these functions are represented in Figure 5.

Test of goodness-of-fit of the identified distributions
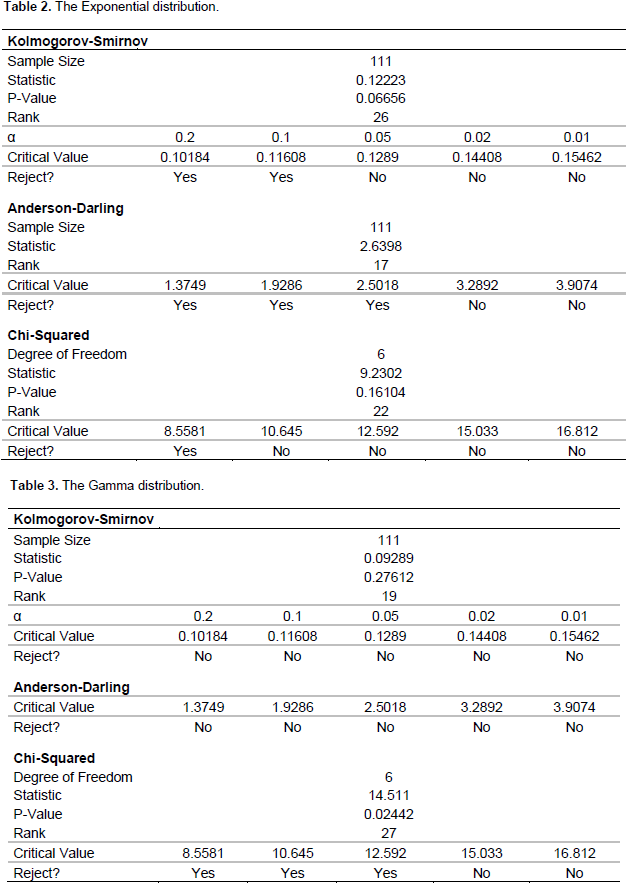
In Figure 6, the observed distances of the detectedelephants has clearly shown in the plots not to follow the normal distribution. It appears to somehow fit the Gamma and Weibull distributions. Even though the plotted points of the Exponential distribution appears to form a straight line, some points fell outside the confidence level. The smaller Anderson-Darling statistic of the Weibull with its greater probability appears more favorable to the Gamma. Figure 5 reveals that the three identified distributions that best explain the distributions of elephants in the MNP all indicate a decreasing probability of detection of units as distance increases and satisfies basic assumptions of distance sampling.
From the goodness-of-test results as revealed in Tables 1, 2 and 3, it is evident that the Weibulldistribution actually fits the elephant data well as hypothesis confirmed that there exists no evidence to reject the statement that the Weibull distribution fits the distance data better at all levels of significance. Figure 7 represent a simulated observation whichappears almost in the same form in shape as that of the identified Weibull of the observed elephants in the MNP. This confirms that any random observation over space and time within any region of study of the elephant species can be explained by the Weibull function.


Explored probability distributions of other observed mammals in the MNP
Figure 8 demonstrates combined plots of all possible functions capable of explaining the distributions of theHartebeests, Waterbucks and Warthogs, respectively in the Mole National Park of Ghana. Testing for the best appropriate distribution using the Anderson-Darling, the Chi-square and the Kolmogorov statistics as previously observed, it was found that different functions appear to distinctively describe individual species. The Hartebeests and Waterbuck detections however appear to be described by the 3p-Weibull distribution whereas that of the warthogs fits well in the Johnson SB distribution which is assumed to follow the normal distribution after some transformation process.

Regression analysis
This statistical approach is adopted to determine or describe the relationship between a response variable
and one or more explanatory variables defined as covariates in the context of this study. With an assumption of linearity and dichotomous nature of this variable of interest, the regression took the approach of the general regression form to determine how detection of objects can be influenced by distances at various factor level combinations of the covariates.
Analysis of un-augmented observation of elephant data
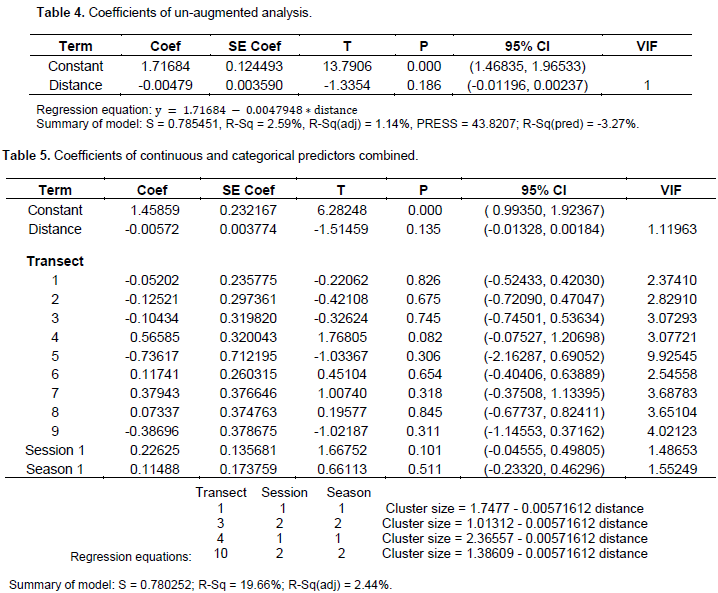
The regression equation as earlier indicated exhibits the relationship between cluster size (number of detections) conditional on distance only. As observed in the equation, as distances increases, detection decreases and for every unit increase in distance, ability to detect is decreased by about 0.5%. In this model, only about 3% of the variability is explained by the presence of the predictor. The constant value in the regression only exhibits statistical significance at 95% level of confidence as Table 4 reveals. The analysis of variance predicts that there is no statistical evidence to suggest that the detection of elephants within the survey area is actually related to the distances at which detection can occur. With inclusion of other categorical predictors, ability to detect is assumed to be conditional on distance, and the other categorical variables provided separate regression equations for each level of each categorical variable in the model as indicated Table 5 wherein more units are likely to be detected at factor combination 4, 1, 1 for transect, session and season, respectively which exhibits statistically significance at not less than 10% level of significance as seen in Table 5.

With this adjustment based on other categorical predictors, more of the variations appear to be explained by the model than their nonexistence as seen in the values of the R-Sq with detections made at transect line 4 indicating some statistical significance at the 1% significance level. There is also a change in the value of the S statistic from S = 0.785451 to S = 0.780252, indicating an improvement in the model with the inclusion of the categorical predictors and a greater reduction in ability to detect per every unit increase in distance (from 0.0047948 to about 0.00571612). The inclusion of the categorical predictors has also resulted in an increase of the Durbin-Watson Statistic from 2.12984 to 2.25769. The S statistic represents the standard distance that data values fall from the regression line and for a given equation, the lower the S, the better the performance of the model in predictions.
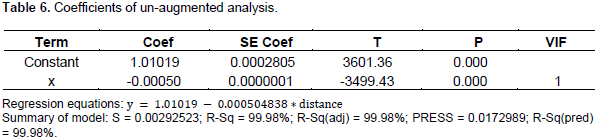
Regression analysis of augmented observation
Augmentation is a process of data recording involving more than one species of observed units whilst adjusting for unobserved units of interest over space and time. In augmentation, it is assumed that if a particular species is observed at a particular distance in time T, then there exist same number of other species that appear undetected at a different location beyond the point where detections of one particular species is recorded. In distance sampling, a unit may appear detected or not with unobserved units not signaling total absence at that particular time. Augmentation thus allows all unobserved units to be catered for in data recording process. Table 6 confirms that both constant and coefficient appear significant with the augmentation process, with a percentage of about 99.98 of variation being explained by the inclusion of the predictor variable as against 2.59% with the un-augmented case. This indicates a significant support of the augmented than the un-augmented form.
CONCLUSION AND RECOMMENDATIONS
The study has thus revealed that the four specified functions in the application software appear insufficient in modeling all animals and plants of different species since differences in biological characteristics of different species can be manifested in their detections and detectability processes. In addition, data recordings and presentation in this type of study requires more generalization in a form described in this study as “augmentation” process. Detectability of the elephant species is observed to be explained mathematically as

in the classical perspective with the DISTANCE application software. With covariates inclusion, the detectability appears as

wherein a change can be observed in both the scale and shape parameters as with the case of Marques et al. (2007) who indicated that performing a multiple covariate analysis affects only the scale parameter. With further exploration with possible functions that can perform an equal role or better based on probability of detection produced, the Weibull distribution appear to better explain the distribution of the elephant species than the hazard rate functions.
Finally, observation of units of interest conditional on distances has been modeled in a more general perspective with additional categorical predictors wherein all regression equations are provided at various factor level combinations with about 99.98% of explained variation in the model by the data augmentation process and less than 20% of explained variability for un-augmented case. It is therefore recommended that:
1) Further exploration should be performed prior to analysis and estimation to determine appropriate distribution that seems to appropriately describe specific units of interest under investigation.
2) Expansion of the functional space in the application DISTANCE software.
3) Application of data augmentation process in data representation with LTM involving observation with more than one species at a time.
4) Data augmentation is a necessary tool for data organization especially when a complete coverage of the entire study region is or may appear impossible or difficult.
5) Regression in a generalized form appears more appropriate in modeling with both continuous and categorical variables combined. It allows for separate equations to be provided at various factor level combinations of the categorical variables.
The author has not declared any conflict of interests.
REFERENCES
|
Anderson DR, KP Burnham (1976). Population ecology of the mallard:
|
|
|
|
Anderson DR, Pospahala RS (1970). Correction of bias in belt transects of immotile objects. J. Wildl. Manage.
Crossref
|
|
|
|
|
Buckland ST, Rexstad EA, Marques TA, Oedekoven CS (2015). Distance Sampling: Methods and Applications. Springer Cham Heidelberg New York Dordrecht London.
Crossref
|
|
|
|
|
Buckland ST, Anderson DR, Burnham KP, Laake JL (1993). Distance sampling Estimating abundance of biological populations. Chapman & Hall, London.
|
|
|
|
|
Burnham KP, Anderson DR, Laake JL (1980). Estimation of density from line transects sampling of biological populations. Wildlife Monographs 72:1-202.
|
|
|
|
|
Borchers DL, Stevenson BC, Kidney D, Thomas L, Marques TA (2015). A Unifying Model for Capture–Recapture and Distance Sampling Surveys of Wildlife Populations, J. Am. Stat. Assoc. 110(509):195-204.
Crossref
|
|
|
|
|
David L, Borchers, Samantha Strindberg (2002). Distance Sampling, John Wiley and Sons, Ltd, Chichester, in Encyclopedia of Environmetrics (ISBN 0471 899976). 1:544-552
|
|
|
|
|
Eberhardt (1968). A preliminary appraisal of line transects. J. Wildl. Manage. 32(1):82-88
Crossref
|
|
|
|
|
Gates CE (1968). Simulation study of estimators for the line transect sampling method. Biometrics 25(2):317-328.
Crossref
|
|
|
|
|
Emlen JT (1971). Population densities of birds derived from transect counts. Auk 88:323-42.
Crossref
|
|
|
|
|
Hayne DW (1949). An examination of the strip census method for estimating animal populations, J. Wildl. Manage. 32(2):145-157.
Crossref
|
|
|
|
|
Hayward MW, de Tores PJ, Dillon MJ, Fox BJ, Banks PB (2005). Using faecal pellet counts along transects to estimate quokka (Setonix brachyurus) population density. Wildl. Res. 32:503-7.
Crossref
|
|
|
|
|
Johnson DS, Laake JL, Ver HJM (2010). A model-based approach for making ecological inference from distance sampling data. Biometrics, 66:310-318.
Crossref
|
|
|
|
|
Laake JL, Buckland ST, Anderson DR, Burnham KP (1993). Distance Users Guide. Version 2.0. Colorado Cooperative Fisheries and Wildlife Research Unit, Colorado State University, Colorado.
|
|
|
|
|
Marques TA, Thomas L, Fancy S, Buckland ST (2007). Improving estimates of bird density using multiple-covariate distance sampling. The Auk, 124:1229-1243.
Crossref
|
|
|
|
|
Robinette WL, Jones DA, Gashwiler JS, Aldous CM (1974). Field tests of strip census methods. J. Wildl. Manage. 38(1):81-96.
Crossref
|
|
|
|
|
Sadlier LMJ, Webbon CC, Baker PJ, Harris S (2004). Methods of monitoring red foxes Vulpes vulpes and badgers Meles meles: are field signs the answer? Mammal Rev. 34:75-98.
Crossref
|
|
|
|
|
Sen AR, Tourigny J, Smith GEJ (1974). On the line transect sampling method. Biometrics 30(3):329-340.
Crossref
|
|
|
|
|
Seber GAF (1986). A review of estimating animal abundance. Biometrics 42:267-92.
Crossref
|
|
|
|
|
Sullivan BJ, Baxter GS, Lisle AT (2002). Low-density koala (Phascolarctos cinereus) populations in the mulgalands of south-west Queensland. I. Faecal pellet sampling protocol Wildl.Res. 29:455-62.
Crossref
|
|
|
|
|
Buckland ST, Oedekoven CS, Borchers DL (2016). Model-Based Distance Sampling, J. Agri. Biol. Environ. Stat. 21:1-58
Crossref
|
|
|
|
|
Thomas L, Buckland ST, Rexstad EA, Laake JL, Strindberg S, Hedley SL, Bishop JRB, Marques TA, Burnham KP (2010). Distance software: design and analysis of distance sampling surveys for estimating population size. J. Appl. Ecol. 47:5-14.
|
|
|
|
|
Thompson SK (2002). Sampling, 2nd edn, Wiley, New York.
|
|


 where
where  . That is, at distance zero, all the animals on the line are detected with a probability of 1. To derive robust estimates, a minimum of 60 to 80 observations are required across the study area (Buckland et al., 1993). Line transect sampling has been developed along rigorous statistical inference principles. Parametric approaches to modelling
  and the general form of the estimator of animal density
  . This development was left at the conceptual stage and not pursued to the final step of a workable general approach for deriving line transect estimators. Burnham and Anderson (1980) pursued the general formulation of line transect sampling and gave a basis for the general construction of line transect estimators. They developed the general result
  , where in the parameter
  is a well-defined function of the distance data. The key problem of line transect data analysis was seen to be the modeling of
  and the subsequent estimation of