Full Length Research Paper
ABSTRACT
COVID-19 invades human cells with its homotrimer spike glycoprotein (SPK) located in the viral envelope by binding to its target human receptor angiotensin-converting enzyme 2 (ACE2), as well as is responsible for having its own negative physiological and cellular effects. The purpose of this study is to evaluate the impact of SPK on U937 (human histiocytic lymphoma) cells while highlighting the mitigating effects of artemisinin (A1) and artesunate (A2) on SPK pathogenesis. This research utilizes MTT, LDH, caspase, cell adhesion, ELISA, and molecular docking assays to determine the effects of these chemicals on various cellular parameters such as cellular survival, cytotoxicity, necrosis, apoptosis, adhesion, and cytokine expression. The results support that SPK has many negative effects on U937 cells such as decreased cell survival, as well as increased cytotoxicity, necrosis, apoptosis, adhesion, and cytokine expression. These negative effects were significantly mitigated by individual treatments of A1 or A2. Additionally, results from the LDH and caspase assays suggest that A1 and A2 may have protective effects against general cellular damage, necrosis, and apoptosis, while also limiting the direct effects of SPK. Future studies must continue to evaluate the effects of these chemicals on cellular and animal models, as well as determine the safety and efficacy of higher doses. This study is limited by using a single cell line (U937) and by concentrations of A1 and A2 being used (1μM and 10μM). Overall, this research supports that A1 and A2 may be potential candidates for mitigating SPK induced adverse effects.
Key words: Artemisinin, Artesunate, apoptosis, Covid-19, vaccine side effects.
INTRODUCTION
Ever since its initial discovery in January 2020, coronavirus disease 2019 (COVID-19) has been a major health issue in society as it has already caused over 232 million confirmed cases and over 5 million deaths globally. Also, COVID-19 has greatly affected the elderly population as 72.8% of the total deaths are people over 65 years old (Gold et al., 2020). With about 16.63% of America’s population being people over 65 years of age, (Elflein, 2022).
COVID-19 is a major threat to the American population (Bureau USC, 2022; O’neil, 2022).
COVID-19 invades human cells with its homotrimer spike glycoprotein (SPK) located in the viral envelope by binding to its target human receptor angiotensin-converting enzyme 2 (ACE2). After binding with ACE2, the TMPRSS-2 adhesion proteins help the spike protein complex to further invade the human body by cleaving the spike protein (Chen et al., 2020; Lukassen et al., 2020). The SARS-COV-2 spike proteins adhere to the TMPRSS2 proteins and are then cleaved at multiple sites (Radzikowska et al., 2020). These cleavages decrease the sensitivity of the antibodies produced by the immune system which makes it harder to eliminate all the viral proteins (Glowacka et al., 2011).
Proteins of Sars-Cov-2 are the prime target for the design of vaccines, but their cytotoxic effects on human cells have caused concerns for possible vaccine/adverse effects on the population. Study has shown the ORF3a protein of SARS-COV-2 can cause damage mainly by inducing extrinsic and intrinsic apoptosis (programmed cell death) in human cells (Ren et al., 2020; Zhang et al., 2021). During apoptosis, cytochromes are released which results in downstream activation of caspase 9 which will cleave substrates in the cells to induce apoptosis (Hung and Chow, 1997; Barhoumi et al., 2021). Thus, decreases in the caspase 9 expression would indicate a decrease in the amount of apoptosis in each cell population. Another way for the SARS-COV-2 spike protein to do damage to the human body is through necrosis (Schwartz and Morotti, 2020). Thus, reducing the amount of apoptosis and necrosis caused by SARS-COV-2 spike proteins will be a crucial step in the remediation of COVID-19 damage.
Even though there are currently vaccines for COVID-19, most of these vaccines are mRNA vaccines and could cause serious damage to human cardiovascular cells (Gu et al., 2021). For example, an injection of these mRNA vaccines to mouse models caused these mice to develop myopericarditis followed by cardiomyocyte degeneration, apoptosis, and necrosis with adjacent inflammatory cell infiltration and calcific deposits on the visceral pericardium (Gu et al., 2021).
A disturbed immune response is a major signature of SARS-COV-2 infection, characterized by the presence of exhaustive T cells, dysfunctional monocytes, macrophages, B cells, and natural killer cells (Barhoumi et al., 2021). SarsCov-2 binding with ACE-2 receptors causes a cytokine storm that influences immune function (Barhoumi et al., 2021).This increase in cytokine expression leads to a cytokine storm which results in dysfunction of the immune system which further increases immune cell susceptibility to COVID-19 (Gu et al., 2021; Ropa et al., 2020). While immune cells are less likely to be infected, the damages are more severe compared to other cells if infected (Sehailia and Chemat, 2020). However, there is still very limited knowledge on SARS-COV-2’s cytotoxic effects on human immune cells.
Experiments in 2015 discussed the possible application of using artemisinin (A1) and its derivatives as treatment for viruses. A1 and artesunate (A2), formerly used as malaria and cancer treatment drugs, were also determined to have antiviral effects for other families of spike proteins such as 3CLpro corona virus (Wang et al., 2016). This supports that A1 and A2 may have the same effect in human immune cells (Tang et al., 2020). Also, A1 and A2 were observed to decrease cytokine expression in the human body, which supports that they may reduce immune system activation via reduced cytokine signaling (Hiromura et al., 2018). Thus, A1 and A2 may be possible candidates for remediating spike protein’s damage to the immune system.
The purpose of this research is to examine A1 and A2’s remediation effects on SPK-induced Sars-Cov-2 infected immune cells. The alternate hypothesis of this study is that artemisinin (A1) and artesunate (A2) will be able to decrease Sars-Cov-2 spike protein’s cytotoxic effects and induced immune response. The null hypothesis is that A1 and A2 will have no effect on SPK-induced cytotoxic effects and have low binding affinity for important macromolecules.
MATERIALS AND METHODS
Cell culture
The U937, human histiocytic lymphoma (ATCC, NY, USA), cell line was used for this study as they express ACE2 receptors. U937 cells were incubated at 37°C in Eagle’s Minimum Essential Medium, supplemented with 10% fetal bovine serum (Invitrogen, USA), and maintained at conditions of 95% air and 5% CO2 in an incubator (Thermo Scientific, USA). For assays utilizing a 96-well plate, each well contained 100 μL of MEM and approximately 10,000 cells. For assays utilizing 6-well plates, each well contained 2 mL of MEM and approximately 200,000 cells.
MTT assay
For the MTT assay, 10μL of each chemical was added to wells of a 96-well plate following the treatment plan of control, SPK 1 μM, SPK 10 μM, SPK 100 μM, A1 1 μM, A1 10 μM, A2 1 μM, A2 10 μM, SPK + A1 1 μM, SPK + A1 10 μM, SPK + A2 1 μM, and SPK + A2 10 μM. Following treatments, cell plates were incubated for 24 h at 37°C. After incubation, 10 μL of 3-(4, 5-dimethylthiazol-2-yl)-2,5-diphenyltetrazolium bromide (MTT) was added to each well and the plate was incubated for one and a half hours. MTT is a colorimetric compound that shifts its color from yellow to purple when reduced to formazan by NAD (P) H-dependent cellular oxidoreductases which is produced via cellular respiration. As these molecules are only present in living cells performing respiration, MTT is an agent used to quantify the number of viable cells left after treatment (ATCC, 2011). After incubation, 70 μL of dimethyl sulfoxide (DMSO) was added to each well and the plate was incubated for 15 min to dissolve the formazan crystals for proper measurement of color density. Following incubation, optical density (OD) was obtained for each well using a microplate reader set to the wavelength of 595 nm.
The values were exported to excel and statistical analysis was conducted to measure the significant changes in cell viability using the equation: (sample average OD - Control average OD / Control average OD) *100.
LDH assay
The LDH assay was completed utilizing reagents obtained in the Invitrogen™ CyQUANT™ LDH Cytotoxicity Assay. For sample treatments,10 μL of each chemical was added to wells of a 96-well plate with the treatment plan of control, SPK 10 μM, A1 10 μM, A1 100 μM, A2 10 μM, A2 100 μM, SPK + A1 10 μM, SPK + A1 100 μM, SPK + A2 10 μM, and SPK + A2 100 μM. After incubation for 24 h, 50 μL of media from each well was removed and added into another fresh 96-well plate labeled as released LDH. Also, 50 μL of LDH substrate mix was added to the released LDH plate to measure the LDH released by any cells from the treatments due to cellular damage. This released LDH plate was left at room temperature and away from direct light for 30 min. After 30 min, 50μl of LDH stop solution was added to each well to terminate the assay and prevent further color changes. The plate was placed in a micro plate reader and OD for each well was measured at 490 nm. Another reading at 655 nm was performed to determine if there was any background interference with the reading. Then, 10 μl of LDH lysis buffer was added to the original plate containing the cells to lyse all the cells and to measure a total or maximum LDH for each sample. Another empty 96 well plate was then labeled as total LDH. For the total LDH, 50 μl of the cell lysate and media were transferred from the original plate containing the lysed cells into the empty 96-well plate labeled as total LDH. The LDH present in the total LDH plate was measured following the same steps utilized to measure the released LDH plate. The percent cytotoxicity was later calculated by the equation: (Sample OD released LDH - control OD released LDH) / (Sample OD total LDH - control OD released LDH) * 100 and T-tests were applied to each group to measure significance for percent cytotoxicity.
Caspase 9 assay
The caspase 9 assay was completed utilizing Gbiosciences Caspase™ Colorimetric Apoptosis Assay (Cat. # BAQ019). Cells were treated in a 6-well plate following the treatment of control, A1 10 μM, A2 10 μM, SPK10 μM, A1 + SPK10 μM, and A2 + SPK10 μM for 24 h. Following treatment incubation, the cells from each well were collected into 1.5mL micro-centrifuge tubes. After centrifugation and removal of all the MEM medium, U937 cells were suspended in 50ul of caspase assay lysis buffer and were further lysed by freezing and thawing 4 times. Then, 50 μl of caspase assay buffer was added to every well of an empty 96-well plate. Additionally, 50 μl of caspase assay lysis buffer was added to the blank wells and 45 μl added to the treatment and control wells. 5 μl of lysed cells from the various treatment or control groups was added in triplicates to the corresponding wells. After addition of the test samples, 5 μl of pNA Substrate Solution was added to every well. The plate was then taken for a reading at the zero time point using a microplate reader at 415 nm. Afterwards, the plate was covered and incubated at 37 degrees Celsius. Every 30 min the plate was taken out and read with a microplate reader until all the values were significantly different from the zero point. The data from the Caspase Assay was analyzed by calculating the change in optical density per minute (ΔOD). The ΔOD was obtained through subtracting the sample’s start OD from the sample’s final OD to determine the overall change in absorbance. The ΔOD/minutes were calculated by taking the ΔOD and dividing by the overall time in minutes. The ΔOD per minute of each sample was compared to the control by a percent change to determine the activity of caspase 9 and apoptosis. The OD of the blank samples is subtracted from the OD of the treated sample to normalize the data and ensure minimal interference.
Adhesion assay
For the adhesion assay, Collagen IV dissolved in water was added to each well for 24 h at 4 degrees Celsius. After 24 h, the liquid was removed from each well and 500 μL of MEM (containing approximately 10,000 U937 cells) was added to each well of a 24-well plate. After plate preparation, 10 μL of each chemical was added following the treatment plan of control, SPK 10 μM, A1 10 μM, A1 100 μM, A2 10 μM, A2 100 μM, SPK + A1 10 μM, SPK + A1 100 μM, SPK + A2 10 μM, and SPK + A2 100 μM. After treatment the plate was incubated at 37°C for 24 h. After incubation, the media was then removed and a Hema3 fixative buffer was added to each well for 2 min. The fixative was then removed and 10 μL of Hema3 staining solution was added for another 2 min and removed. Lastly, distilled water was used to wash off the excess stain to obtain clear images for analysis. Pictures were taken using an optical light compound microscope on amscopes computer software. The number of cells attached were measured in Image J from changing the picture type to 8 bit, subtracting the background, adjusting threshold, and Plugins ICTN. The data was analyzed with the equation: (number of attached cells in sample - # of attached cells in control) / (# of attached cells in control) * 100 for percent decrease (change) in adhesion.
ELISA
ELISA kits were acquired from Bolster Biological Technology (Gold et al., 2020). A 6 well plated was used and labeled as control, SPK 5 μM, A1 10 μM, A2 10 μM, SPK + A15 μM, SPK + A2 5 μM,. Reagents were brought to room temperature prior to the experiment. To prepare cell samples, media was removed from a 6-well plate and 1000 µL of PBS was added to each well, then the plate was placed in the freezer for 20 min. Samples were then thawed for 10 min at room temperature and this freeze/thaw cycle was repeated for two additional times to ensure accurate measurement of cytokines. After the freeze/thaw cycles, 100 µL of the standards, control, or treatment samples were added to each well and 100 µL of sample diluent buffer was added to the zero wells. There were three replicates for each standard, control and sample.
The plate was sealed and incubated for 90 min at 37°C. The plate sealer was taken off, the liquid was removed from the plate, and any remaining liquid was removed by inverting the plate on a paper towel. After the removal of liquid, 100 µL of 1x Biotinylated Anti-Human IL1α was added to each well. The plate was covered and incubated for 90 min at 37°C. The plate was washed 3 times with the 1x wash buffer. Liquid was discarded using the same procedure as previously mentioned and 300 µL of the 1x wash buffer was added to each assay well. This step was repeated twice.
After washing, 100 µL of 1x Avidin-Peroxidase Complex was added to each well and the plate was covered with plate sealer and incubated for 90 min at 37°C. The plate was washed 5 times with the 1x wash buffer. Liquid was discarded using the same procedure as previously mentioned and 300 µL of the 1x wash buffer was added to each assay well. This step was repeated 4 times. After washing, 90 µL of the color developing reagent was added to each well. The plate was covered with plate sealer and incubated at 37°C for 25 min. After incubation, 100 µL of stop solution at 37°C was added to each well. OD was measured for each well with a microplate reader at 450 nm 30 min after the stop solution was added. Standard curve was made to determine the concentration of samples from measured OD values. Additionally, the same procedure was used to perform an ELISA to measure TNFα level in these cells.
Molecular docking
Molecular docking was performed through the computer program PyRx. The crystal structure of SARS-CoV-2 spike receptor-binding domain bound with ACE2 (PDB: 6m0j), SARS-CoV-2 S-ACE2 complex (PDB: 7df4), ACE2 (PDB: 1r4l) from the Research Collaboratory for Structural Bioinformatics Protein Data Bank Database (https://www.rcsb.org/) were used. Molecular docking was calculated using PyRx version 0.8 and AutoDock Vina. Chain A was selected from every macromolecule to serve as the basis of each AutoDock macromolecule. Every ligand was added to OpenBabel for energy minimization by 200 steps and then converted to AutoDock Ligands. The grid area was selected to increase the accuracy of molecular docking regions and figures. AutoDock Vina Molecular Docking using PyRx software gives an output of binding affinities, measured in kcal/mol.
Statistical analysis
The absorbance results from the MTT Proliferation Assay, Caspase 9 Assay, and LDH Assay were statistically analyzed via a one-way ANOVA with a post hoc scheffe, p <.05 using IBM SPSS version 26, and the absorbance results of each essay were plotted as bar graphs. The groups tested as independent variables for MTT, Caspase, and LDH Assays are noted in Table 1. Error bars displaying standard deviation were featured on each graph.
RESULTS
A1 and A2 showed a protective effect on cell survival of the cells treated with recombinant SPK
Recombinant SPK inhibited U937 cell proliferation as shown in Figure 1, with SPK 5 µM significantly decreasing cell survival when compared with the control. The addition of A1 and A2 at 1 and 10 µM to the cells treated with SPK 5 µM significantly mitigated the decreased cell survival seen in SPK alone. These combined treatments displayed a change from 40.23±2.19% (SPK 5 µM) to 23.42±2.19 (SPK 5 µM +A1 1 µM), 16.51±1.79 (SPK 5 µM +A1 10 µM), 20.64±1.56 (SPK 5 µM +A2 1 µM), and 15.84±0.94% (SPK 5µM +A2 10µM). Additionally, this figure supports the dose dependent mitigatory effects of these chemicals on SPK-induced decreased cell survival.
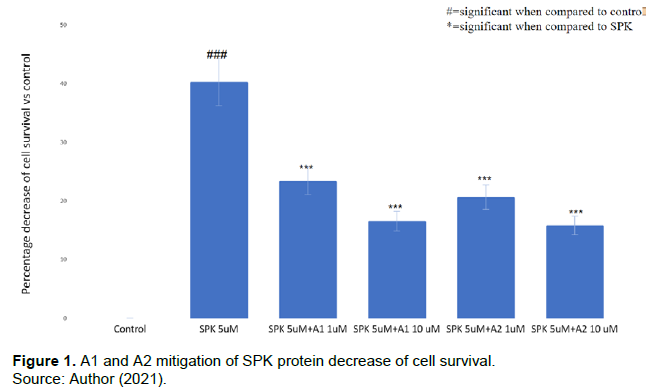
Comparison of percentages of decreased cell survival in the cells treated with SPK, A1, and A2 as compared to control. Decreased cell survival in U937 cells caused by various treatments at different concentrations for 24 h was determined via MTT assay. This experiment was performed with SPK at 5 µM, A1 and A2 at 1 µM and 10 µM, and SPK at 5 µM combined with A1 or A2 at 1 µM or 10 µM. The results were statistically significant with p<0.05. This experiment was repeated 3 times.
A1 and A2 decrease recombinant SPK induced cytotoxic effect
SPK treatment caused significant cytotoxic effects in U937 cells exposed for 24 h as shown in Figure 2. Treatment with SPK at the concentration of 5 µM increased cytotoxicity by 68.79±3.44% when compared to the control. A1 and A2 treatment alone at both 1 µM and 10 µM did not result in significant cytotoxic measurements. In comparison, the addition of A1 and A2 at 1 µM and 10 µM to the cells treated with SPK at 5 µM mitigated the SPK-induced cytotoxicity to 15.56±0.78% (SPK 5 µM + A1 1 µM), 12.80±0.64% (SPK 5 µM + A1 10 µM), -9.74±0.48% (SPK 5µM + A2 1µM), and 11.87±0.59% (SPK 5 µM + A2 10 µM) respectively.
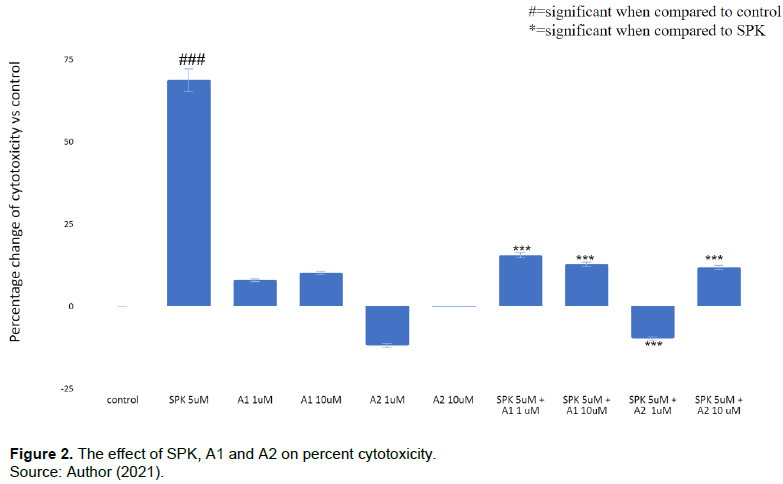
Comparison of percent changes in cytotoxicity of U937 cells treated with SPK, A1, and A2. A. Cytotoxicity was measured after 24 h treatment incubation and was determined via LDH assay. The percentages of cytotoxicity in the treatment groups were compared to the control group without treatment. B. This experiment was performed with SPK treatment at 5 µM, A1 and A2 at 1 µM and 10 µM, and SPK at 5 µM combined with A1 or A2 at 1 µM or 10 µM. The results were statistically significant with p<=0.05. This experiment was repeated 3 times.
A1 +A2 decreases caspase apoptosis caused by SPK
In Figure 3, SPK 5 µM was shown to increase the percent of caspase activity by 37±1.8% when compared to the control (p<0.05). However, A1 10 µM and A2 10 µM showed -22.7±1.13% and 4.32±0.2% caspase activity respectively when combined with SPK 5 µM and compared to the control. In other words, A1 and A2 can significantly mitigate the caspase activity seen from SPK 5µM treatment alone. As caspase activity is directly related to apoptosis (11), A1 and A2 are shown to remediate the caspase induced apoptotic effect of SPK on U937 cells.

Comparison of percent changes in caspase activity in U937 cells treated with SPK, A1, and A2. A. Caspase activity was measured after 24 h treatment incubation and was determined via caspase 9 colorimetric assay. The percentages of caspase in the treatment groups were compared to the control group without treatment. B. This experiment was performed with SPK treatment at 5 µM, and SPK at 5 µM combined with A1 or A2 at 10 µM. The results were statistically significant with p<=0.05. This experiment was repeated 3 times.
A1+A2 decreases SPK-caused immune cell adhesion
In Figure 4, SPK 5 μM showed a 186.45±15.36% increase compared to the control, while SPK 5 μM + A1 1 μM showed an increase of around 28.64±4.53% and SPK 5 μM + A2 1 μM 22.46±3.57%. A1 and A2 showed a significant mitigation of the adhesion molecule expression induced by SPK alone. These two chemicals also showed an increase in their effective mitigation of SPK induced adhesion as the concentration increased. A1 at 10 μM decreased the cell adhesion to about 13.47±2.61% and A2 at 10 μM decreased the cell adhesion to around 10.58±1.97% when compared to control. These results are only slightly less impactful than the positive control of the SPK + integrin antibody (integrin AB 10μM). Thus, A1 and A2 showed a dose dependent effect as both were successful in decreasing the adhesion molecule expression involved with SPK induced immune adhesion.
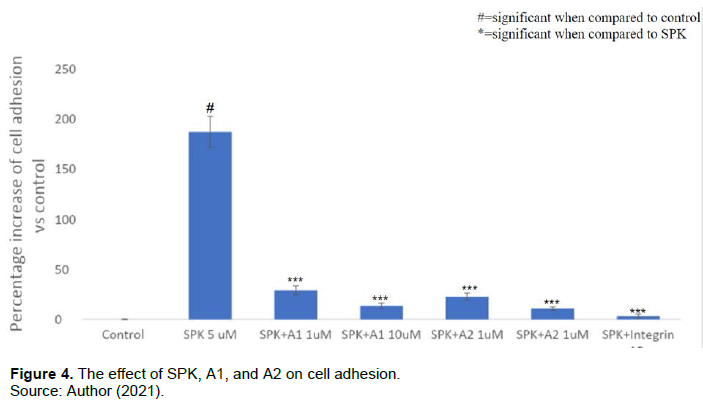
Comparison of percent increases in cell adhesion for U937 cells treated with SPK, A1, A2, and integrin antibody. A. cell adhesion was measured after 24 h treatment incubation and was determined via cell adhesion assay. The percentages of adhered cells in the treatment groups were compared to the control group without treatment. B. This experiment was performed with SPK treatment at 5 µM, SPK at 5 µM combined with A1 or A2 at 1 µM or 10 µM, and SPK 5 µM and integrin antibody 10 µM. The results were statistically significant with p<=0.05. This experiment was repeated 3 times.
Figure 5 shows a visual of the adhered cells obtained via the adhesion assay. Increased adhered cells are related to increased cellular adhesion molecule expression. Figure 5B showed significantly more adhered cells and adhesion molecules, while Figures 5C-5Edisplay decreased amounts of cellular adhesion. The adhesive cells occurred the most in the SPK treated wells when compared to the control. A1 and A2 treatment and incubation significantly blocked SPK induced immune cell adhesion. Prior incubation of integrin antibodies blocked SPK induced cell adhesion to represent a positive control. Additionally, SPK treated and adhered cells display a hyper chromatic staining pattern, as well as display large areas of cell clustering when compared with alternative treatment images.
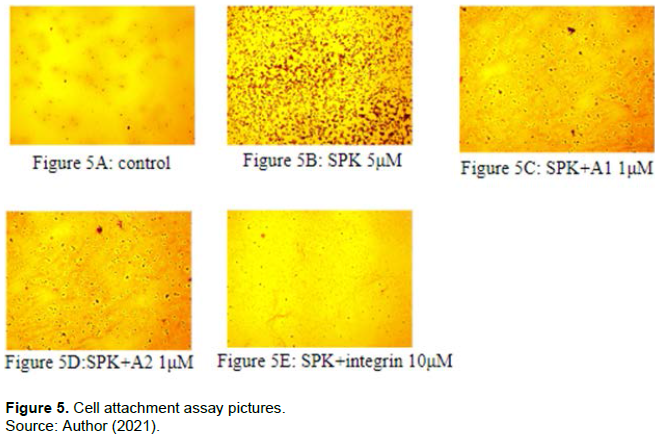
Visualization of adhered U937 cells treated with SPK, A1, A2, and integrin antibody via compound light microscopy under x400 magnification. A. Cell adhesion was visualized after 24 h treatment incubation and was obtained via cell adhesion assay staining and compound light microscopy. B. This experiment was performed with SPK treatment at 5 µM, SPK at 5 µM combined with A1 or A2 at 1 µM, and SPK 5 µM and integrin antibody 10µM. This experiment was repeated 3 times.
Effects of A1 and A2 on production of IL1α and TNFα in the cells treated with recombinant SPK
SPK treatment significantly increased proinflammatory cytokine IL1α production in U937 cells in a dose dependent manner. SPK treatment at concentrations of 1 µM and 10 µM significantly increased IL1α production by 114.99 and 165.12% respectively. A1 and A2 treatment alone at 1 µM resulted in a slight decrease in IL1α production of 10%. The increased IL1α production in the cells treated with SPK at 1 µM and 10 µM was significantly reduced to 1.64% (SPK 1 µM) and 26.59% (SPK 10 µM) by A1 treatment at 1 µM, 2.87% (SPK 1 µM) and 33.79% (SPK 10 µM) by A2 treatment at 1 µM (Figure 6). SPK, A1, and A2 protein did not affect TNFα levels in treated U937 cells.
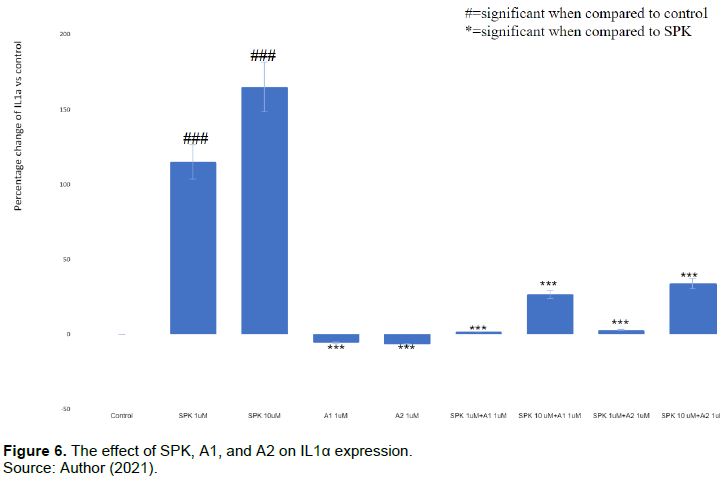
Comparison of percent changes in IL1α levels in U937 cells treated with SPK, A1, and A2. A. IL1α was measured after 24 h treatment incubation and was determined via ELISA. The percentages of IL1α in the treatment groups were compared to the control group after standardization of measurements. B. This experiment was performed with SPK treatment at 1µM and 1 µM, A1 and A2 at 1 µM, and SPK at 1 µM or 10 µM combined with A1 or A2 at 1µM. The results were statistically significant with p<=0.05. This experiment was repeated 3 times.
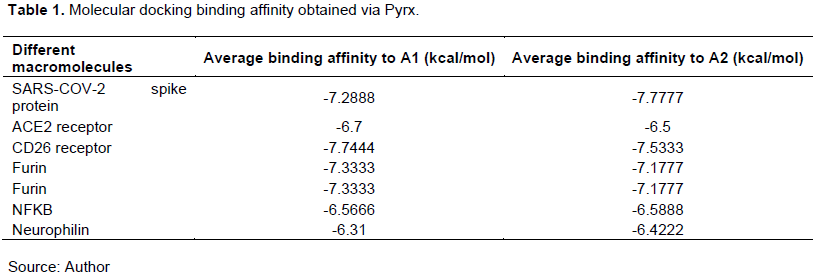
A1 and A2 Exhibit High Binding Affinity to Key Receptors for Infection and Inflammation
The results from molecular docking showed that A1 and A2 exhibit high binding affinity for many crucial receptors in the human cells. The high binding affinity shows that A1 and A2 bind well with Sars-cov-2 spike protein, ACE2, CD26, Furin, IKK2, NFKB, and neurophilin. A2 had higher binding affinity for Sars-cov-2 spike protein and neurophilin, but A1 had higher affinities for the remaining macromolecules tested. The highest binding affinities were observed when A1 and A2 were individually bound with Sars-cov-2 spike protein and CD26.
Displayed binding affinity between A1 or A2 and SPK, ACE2, CD26, furin, IKK2, NFKB and neurophilin. A) Binding affinities were obtained via Pyrx molecular docking software. B) This software compares molecular interactions between two selected molecules to determine binding affinities displayed as kcal/mol. The higher the magnitude of the negative numbers represents increased affinity.
DISCUSSION
In the MTT assay, A1 and A2 are shown to have significant mitigatory effects on SPK-induced decreased total cell counts when they are used at higher concentrations, such as 10µM. This mitigation of SPKs effects of decreased cell viability in U937 cells may represent a protective cellular pathway for A1 and A2. These results are further supported via the caspase and LDH findings as A1 and A2 were shown to protect the cells and reverse SPK’s damaging effect.
In the LDH assay, A1 and A2 reversed the cytotoxic effects of SPK from a positive value to a negative value. Cytotoxicity relates to the overall damage a chemical induces for a cell and is also related to the overall damage a chemical may have on the human body. Positive cytotoxicity percentages indicate that the chemical causes cellular damage and therefore may deal damage to the human body. A negative cytotoxicity percentage indicates the chemicals have a protective effect via decreased cellular damage. The results indicate that when A1 and A2 are combined with SPK, the observed damage to the cells is significantly decreased in all aspects. Additionally, cellular damage as measured via an LDH assay is highly related to necrosis of cells. A lower LDH expression indicates a lower amount of necrotic cells, which is important to consider when using cell based models for comparison to human physiology. An increase in cellular damage and necrosis is seen in the cells treated with SARS-COV-2 spike protein. However, these levels of damage and necrosis are remediated after the addition of A1 and A2.
In the caspase assay, SPK treatments showed high levels of caspase expression which indicates a high level of caspase activity when compared to the control. These high levels of caspase correlate with high levels of caspase directed apoptosis in the immune cells as induced by the Sars-Cov-2 spike protein. Since apoptosis requires the downstream activation of various caspase proteins, caspase 9 levels are directly correlated to the amount of apoptosis present in a sample of cells. The protective effects seen in the LDH assay were also supported via the caspase results where A1 + SPK resulted in a negative percent change in caspase activity when compared to control. Similarly to the LDH assay, a negative percentage of caspase activity for this experiment represents a protective effect, as there is less apoptosis than recorded in the untreated control group.
In the cell adhesion assay, A1 and A2 significantly decreased the adhesion molecule expression in the U937 cells when compared to the SPK group. With lowered expression of adhesion molecules such as TMPRSS 2, it will be much harder for SPK to enter the human immune system and cause cytokine storms since there will be no more adhesion molecules to cleave the SPK. Additionally, with decreased adhesion and SPK cleavage, SPK directed vaccines and humoral immunity may be more effective at SPK neutralization and clearance.
IL1α is a potent inflammatory cytokine and is implicated in many bodily inflammatory processes. From the ELISA results, it is supported that SPK induces significant IL1α expression in U937 cells and this expression was successfully mitigated by A1 and A2. This important finding helps support that A1 and A2 may play a role in regulating cytokine expression and may have potential in mitigating the cytokine storm caused by COVID-19 infection. Similarly to what has been reported in previous studies involving macrophages/monocytes, these results further support that A1 and A2 have the potential to down regulate pro-inflammatory pathways, specifically through the direct measurement of inflammatory cytokine expression (Hiromura et al., 2018).
As shown in the molecular docking assay, A1 and A2 showed both high binding affinity for all the macromolecules tested, with A1 having a slightly higher binding affinity than A2 for ACE2, CD26, and furin. This may explain A1’s pronounced effects in most of the assays, since A1 was able to bind with higher affinity; it also had a greater effect. A1’s high affinity with CD26 receptors may indicate that they can cause T-cell activation which may aid in the clearance, recovery, and immune-memory processes via increased immune response and regulation, as the activated T-cells will assist in the elimination of SARS-CoV-2 spike proteins (Chi-Cheng et al., 2009). Furin is an important protein that’s responsible for S protein cleavage during virus entry which activates envelope glycoproteins that are critical for Sars-Cov-2 entry to the human body (Chi-Cheng et al., 2009). Since A1 and A2 showed a high binding affinity to Furin, they can potentially regulate furin which in turn may help prevent Sars-Cov-2 spike protein infection.
These protective results indicate that A1 and A2 may have the potential to remediate the overall damage done to the human body when encountering SARS-COV-2 spike protein via infection or vaccination. By limiting cellular damage, necrosis, and apoptosis caused by SPK, A1 and A2 may help to limit adverse effects related toCOVID-19 infection and vaccination. Through these mechanisms, A1 and A2 may help preserve the immune system to aid in infection clearance and recovery. The decrease in adhesion molecule expression also may account for the results of the caspase and LDH assays as there is overall less pro-apoptotic and pro-inflammatory immune cell activation occurring. Additionally, since less SPK can interact and bind with the immune cells via decreased cellular adhesion expression, this may result in less apoptosis and necrosis for immune cells. Decreased IL1α expression may also add to these protective effects by limiting the cytokine storm commonly observed from COVID-19 infection, further adding to cellular protection via preventing wide-spread cellular and systemic damage. With less spike proteins in the human body, the immune system can decrease viral clearance time, as well as promote a more thorough immune response via decreased cellular damage. With their protective effects against apoptosis, necrosis, and cellular damage, A1 and A2 may utilize these macromolecules and receptors to potentiate the human immune system while directly limiting the detrimental effects of the SARS-CoV-2 spike proteins through direct binding as supported with strong affinities for A1 and A2 with the spike protein.
This study faced various limitations that may hinder the scope of this research. One main limitation faced was the use of a single immunologic cell line (U937 cells). The inclusion of various cell lines will be helpful in determining if these mitigatory and protective effects stand for varying cell types, as well as aiding in obtaining a better understanding of how these chemicals may affect human physiology. Additionally, this study is limited by the use of selected concentrations of 1µM and 10µM for A1 and A2 respectively. By evaluating the effects of higher concentrations, the safety and efficacy of these chemicals may be understood at a greater level. These limitations seek to be addressed via future studies.
CONCLUSION
In the MTT, LDH, caspase, cell adhesion assays, and ELISA, SPK showed an increase in levels of LDH, caspase, and adhesion molecules expression. However, A1 and A2 are both able to dose dependently decrease these effects. A1 and A2 are also shown to have strong binding affinity to SARS-CoV-2 spike proteins and CD26 receptors. Therefore, the alternate hypothesis of this experiment was supported by these results; therefore, A1 and A2 may serve as potential primary or adjunctive treatments for COVID-19. These two chemicals may be especially effective in vulnerable patients, such as individuals with dysfunctional immune systems. Immunodys functional and immunocompromised patients may not be able to receive the traditional COVID-19 vaccine, as well as may encounter increased adverseeffects from being infected. However, if these patients get infected with COVID-19, A1 and A2 may serve as potential treatments to reduce the physiological damage induced by SPK. In conclusion, not only are A1 and A2 able to decrease SARS-Cov-2 spike protein’s direct cellular damage, but they may also utilize the body’s immune system to combat COVID-19 via activating CD26 receptors, as well as preventing further cellular binding with the spike proteins.
FUTURE STUDIES
While A1 and A2 did show a dose dependent effect, they also showed a decrease in effect in the LDH assay as the concentration went up; signaling that the two chemicals might be harmful for the human body at a higher concentration and more research is needed. This experiment could be advanced by using more chemicals that have similar structures individually and in combination with A1 and A2 such as other derivatives of A1 for example artemether which has almost identical chemical structure. The similar molecular structures indicate that the chemicals have similar effects and could lead to much stronger effects when used in combination with A1 and A2 (Wang et al., 2016). Also, the specific binding site was indicated in the molecular docking assay. Therefore, to better understand the molecular mechanism of A1 and A2’s binding with Sars-Cov-2 spike protein and CD26, the specific binding sites and their interactions could be studied in the future.
CONFLICT OF INTERESTS
The authors have not declared any conflict of interests.
REFERENCES
|
Barhoumi T, Alghanem B, Shaibah H, Mansour FA, Alamri HS, Akiel MA, Alroqi F, Boudjelal M (2021). SARS-CoV-2 coronavirus spike protein-induced apoptosis, inflammatory, and oxidative stress responses in THP-1-like-macrophages: potential role of angiotensin-converting enzyme inhibitor (perindopril). Frontiers in Immunology, 12:728896. |
|
|
Bureau USC (2022). 2020 census illuminates racial and ethnic composition of the Country. Census Gov. Retrieved January 25, 2022. |
|
|
Chen H, Xuan B, Yan Y, Zhu X, Shen C, Zhao G, Ji L, Xu D, Xiong H, Yu TC, Li X, Liu Q, Chen Y, Cui Y, Hong J, Fang JY (2020). Profiling ACE2 expression in colon tissue of healthy adults and colorectal cancer patients by single-cell transcriptome analysis. |
|
|
Chi-Cheng J, Tsu-Ming L, Chih-Chieh Y, Shih-Hung L, Kuo-Pin L, Chien-Hua W, Ting-Hsun W, Chi-Chin L, Jiun-Yuan W, Chih-Hao H, Te-Wei C, Yeh-Lin C, Guan-Yi L, Yung-Chang C, Kung-Sheng L, Chih-Ming W, Hue-Min L, Chia-Yun C, Chun-Chia C, Chen J (2009). A multi-format blu-ray player SOC in 90NM CMOS. 2009 IEEE International Solid-State Circuits Conference - Digest of Technical Papers. |
|
|
Elflein J (2022). Topic: Coronavirus disease (covid-19) pandemic. Statista. Retrieved Academia Letters, 2. |
|
|
Glowacka I, Bertram S, Müller MA, Allen P, Soilleux E, Pfefferle S, Steffen I, Tsegaye TS, He Y, Gnirss K, Niemeyer D (2011). Evidence that TMPRSS2 activates the severe acute respiratory syndrome coronavirus spike protein for membrane fusion and reduces viral control by the humoral immune response. Journal of Virology 85(9):4122-4134. |
|
|
Gold JAW, Rossen LM, Ahmad FB, Sutton P, Li Z, Salvatore PP, Coyle JP, DeCuir J, Baack BN, Durant TM, Dominguez KL, Henley SJ, Annor FB, Fuld J, Dee DL, Bhattarai A, Jackson BR (2020) Race, ethnicity, and age trends in persons who died from COVID-19-United States, May-August 2020. Morbidity and Mortality Weekly Report 69(42):1517. |
|
|
Gu T, Zhao S, Jin G, Song M, Zhi Y, Zhao R, Ma F, Zheng Y, Wang K, Liu H, Xin M (2021). Cytokine signature induced by SARS-CoV-2 spike protein in a mouse model. Frontiers in Immunology 11:621441. |
|
|
Hiromura M, Nohtomi K, Mori Y, Kataoka H, Sugano M, Ohnuma K, Kuwata H, Hirano T (2018). Caveolin-1, a binding protein of CD26, is essential for the anti-inflammatory effects of dipeptidyl peptidase-4 inhibitors on human and mouse macrophages. Biochemical and Biophysical Research Communications 495(1):223-229. |
|
|
Hung RW, Chow AW (1997). Apoptosis: Molecular mechanisms, regulation and role in pathogenesis. Canadian Journal of Infectious Diseases 8(2):103-109. |
|
|
Lukassen S, Chua RL, Trefzer T, Kahn NC, Schneider MA, Muley T, Winter H, Meister M, Veith C, Boots AW, Hennig BP. SARS?CoV?2 receptor ACE 2 and TMPRSS 2 are primarily expressed in bronchial transient secretory cells. The EMBO Journal 39(10):e105114. |
|
|
O'Neill A (2022, July 27). United States - age distribution 2020. Statista. |
|
|
Radzikowska U, Ding M, Tan G, Zhakparov D, Peng Y, Wawrzyniak P, Wang M, Li S, Morita H, Altunbulakli C, Reiger M (2020). Distribution of ACE2, CD147, CD26, and other SARS?CoV?2 associated molecules in tissues and immune cells in health and in asthma, COPD, obesity, hypertension, and COVID?19 risk factors. Allergy 75(11):2829-2845. |
|
|
Ren Y, Shu T, Wu DI, Mu J, Wang C, Huang M, Han Y, Zhang XY, Zhou W, Qiu Y, Zhou X (2020). The ORF3a protein of SARS-CoV-2 induces apoptosis in cells. Cellular and Molecular Immunology 17(8):881-883. |
|
|
Ropa J, Cooper S, Capitano ML, Van't Hof W, Broxmeyer HE (2020). Human hematopoietic stem, progenitor, and immune cells respond ex vivo to SARS-COV-2 spike protein. Stem Cell Reviews and Reports 17(1):253-265. |
|
|
Schwartz DA, Morotti D (2020). Placental pathology of COVID-19 with and without fetal and neonatal infection: Trophoblast necrosis and chronic histiocytic intervillositis as risk factors for transplacental transmission of SARS-COV-2. Viruses 12(11):1308. |
|
|
Sehailia M, Chemat S (2020). In-silico studies of antimalarial-agent artemisinin and derivatives portray more potent binding to Lys353 and lys31-binding hotspots of SARS-COV-2 spike protein than hydroxychloroquine: Potential repurposing of Artenimol for covid-19. Journal of Biomolecular Structure and Dynamics 39(16):6184-6194. |
|
|
Tang Y, Liu J, Zhang D, Xu Z, Ji J, Wen C (2020). Cytokine storm in covid-19: The current evidence and treatment strategies. Frontiers in Immunology 11 p. |
|
|
Wang YUE, Cao JIATIAN, Fan YUQI, Xie YUSHUI, Xu ZUOJUN, Yin ZHAOFANG, Gao LIN, Wang CHANGQIAN (2016). Artemisinin inhibits monocyte adhesion to huvecs through the NF-ΚB and MAPK pathways in vitro. International Journal of Molecular Medicine, 37(6):1567-1575. |
|
|
Zhang J, Ejikemeuwa A, Gerzanich V, Nasr M, Tang Q, Simard JM, Zhao RY (2022). Understanding the Role of SARS-CoV-2 ORF3a in Viral Pathogenesis and COVID-19. Frontiers in Microbiology 9(13):854567. |
|
Copyright © 2024 Author(s) retain the copyright of this article.
This article is published under the terms of the Creative Commons Attribution License 4.0


