ABSTRACT
Bush encroachment is reducing rangeland productivity in Borana rangelands. This study was conducted in Teltele Woreda of Borana zone, to evaluate the effects of bush encroachment on plant species composition, diversity and its contribution to carbon stock. Bush encroached, non-encroached and bush thinned rangeland types were selected for the study. Nested plots for collecting tree, shrub, herbaceous and soil data were placed systematically along the geographic gradient within each of the rangeland types. Herbaceous plants were clipped to the ground, collected, oven dried, and their carbon stock was estimated. The tree/shrub biomass was estimated using allometric models, and converted to per hectare. A total of 53 vascular plant species belonging to 19 families were identified. Poaceae and Fabaceae families dominated the site. Bush encroachment had reduced diversity and species richness of herbaceous plants, but did not affect other tree/shrub plant diversity and richness. Although bush thinning improved herbaceous diversity and richness, it reduced tree/shrub richness. The tree/shrub aboveground carbon stock in bush encroached areas is greater than non-encroached rangeland types. Soil carbon stock is highest in bush thinned locales. Total organic carbon stock is ranked from largest to least as follows: Bush encroached, >Bush thinned, and >non-encroached. Generally, bush encroachment increased the rangeland carbon stock, but reduced herbaceous plant biomass and density.
Key words: Biomass, bush thinned, encroachment, herbaceous, rangeland type, soil carbon stock, climate change.
Rangelands include natural grasslands, savannas, shrublands, many deserts, steppes, tundra’s, alpine communities and marshes in which indigenous vegetation (climax or sub-climax) are grazed or have the potential to be grazed to produce grazing livestock and wildlife (Allen et al., 2011). Grasslands are terrestrial ecosystems dominated by herbaceous and shrub vegetation, which include savannas, woodlands, shrublands, and tundra, as well as other forms of grasslands that are conventional and maintained by fire, grazing, drought and/or freezing temperatures and cover about 40.5% of terrestrial ecosystems (Robin et al., 2000). In Ethiopia, grassland ecosystems cover about 72.9% of the land area (Robin et al., 2000). Savanna ecosystems are characterized by the coexistence of trees and grass (Scholes and Archer, 1997), and provide comprehensive economic and ecological benefits for society, particularly to pastoralist communities (Robin et al., 2000). Increasingly, dense thickets of woody vegetation, termed as bush encroachment, are undermining the productivity and long-term economic viability as well as the ecological integrity of savanna and grasslands. Bush encroachment is characterized by an increase in density, cover, and biomass of indigenous woody or shrubby plants (Auken, 2009). Encroachment of woody plants into grasslands, and the conversion of savannas and open woodlands into shrublands, has been widely reported during the past decade (Auken 2000, 2009; Maestre et al., 2009; Eldridge et al., 2011), and this phenomenon has been observed across much of the world’s arid and semi-arid biomes (Andela et al., 2013). It is particularly visible in African savannas and grasslands (Mitchard and Flintrop, 2013).
Scientists have long been attempting to explain cause of bush encroachments. The most frequently-mentioned driving factors explaining bush encroachment include overgrazing, availabilities of soil nutrient and moisture, frequency and intensity of fire, raised CO2 levels, spread of seeds of woody species by livestock and wild animals (Anteneh and Zewdu, 2016). Encroachment of woody plants into Savanna ecosystems has generated considerable interest among ecologists, because of the global trans-national nature of encroachment and its putative association with widespread landscape degradation (Eldridge et al., 2011). On the other hand, the widespread occurrence of woody plant encroachment in global arid and semiarid regions could have important implications for the global terrestrial carbon balance. The adverse impact of greenhouse gas emission and consequent climate change is emerging all over the world. Reducing atmospheric concentrations of carbon dioxide (CO2) through carbon fixation by photosynthesis is an important biotic technique to mitigate climate change. Plants capture CO2 from the atmosphere and subsequently stored in above and belowground biomass. The storage of carbon in terrestrial carbon sinks such as plants, plant products, and soils for longer periods is a win-win strategy, and a growing research topic addressing ways to effectively overcome the challenges of climate change (Lal, 2008; Wilfred et al., 2012; Sheikh et al., 2014). The grassland carbon cycle models generally focus on three carbon ‘pools’: Carbon stored in living vegetation, litter, and soil carbon. The increase in tree density in grass-dominated areas can increase carbon storage capacity of grassland systems and rates of carbon sequestration (Hughes et al., 2006; Tennigkeit and Wilkes, 2008).
Like other African rangelands, most rangelands in Ethiopia are currently affected by woody plant encroachment. The Borana rangelands, located in the southern part of the country, are among those heavily affected by bush encroachment (Ayana, 2002; Gemedo et al., 2006; Ayana and Gufu, 2010). In the Borana low lands, the spread of bush encroachment was noticed after the Gada Liiban Jaldesa (1960 to 1968); and 83% of the rangelands were threatened by a combination of bush encroachment and increase of unpalatable forbs (Ayana and Gufu, 2008). In the mid-1980s, about 40% of the Borana rangelands were affected by bush encroachment (Coppock, 1994) and its cover increased to 52% in early 1990s (Gemedo et al., 2006). A study conducted by Daniel (2010), showed bush cover within Borana rangelands increased from 51% in 1986 to 53.8% in 2002, and to 57% in 2010. Moreover, the major shifts were from grassland and bare land to bushlands. Hasen (2013) reported that the area covered by bushland thickets and bushes within savannah rangelands had increased from 22 to 61% between 1976 and 2012. The density and total area covered by bush encroachment is increasing as time progresses. The density of encroaching woody species in the Borana Zone is beyond the critical limit (Adisu, 2009), and enclosure areas were more threatened by invasive species than free grazing areas (Ayana and Gufu, 2010). The suppression of fire declared by government policy contributed to the expansion of bush encroachment in Borana (Ayana and Gufu, 2008).
The other problem in Borana rangelands is crop cultivation encroachment. Borana communities were highly involved in crop cultivation as an alternative means of livelihood (Tilahun et al., 2017), however it is not self-sufficient in grain production, and produces yields at only 31% of the Ethiopian national average (Tache and Oba, 2010). In Borana rangelands, bush encroachment is considered as one of the major problems affecting rangeland ecosystem structures and functions. Several studies (Coppock, 1994; Gemedo et al., 2006; Ayana, 2007; Ayana and Gufu, 2007; Adisu, 2009; Hasen, 2013; Bikila et al., 2014) reported the adverse effects of woody plant encroachment on grass productivity and the diversity of the native vegetation, particularly grasses and forbs and reduced ground cover, exposing large parts of the rangelands for soil erosion and other degradation processes. On the other hand, the on-going woody encroachment in savanna and grassland ecosystems has significant implications for the global carbon cycle. Wide-spreading woody encroachment in Borana rangelands has substantially increased the carbon stock in aboveground biomass, which will foster future carbon trade discussions with respect to climate change mitigation strategies (Hasen, 2013). Bush encroachment is a wide spread problem in the Borana Zone. In particular, this phenomenon has altered the ecological condition and value of rangeland for livestock grazing, leading to reduction in economic benefits of the rangelands. To overcome or mitigate the effects of chronic overgrazing, Borana pastoralists started several adaptation approaches, like diversification of livestock type through including browser animals such as camel, goat and bush thinning/clearing.
Controlling the spread of bush encroachment through thinning/clearing, the woody plant species could improve rangeland productivity. Some studies have been conducted on methods of controlling bush and these are recommended in Borana rangeland. Bush removal methods such as tree cutting and fire, tree cutting followed by fire and grazing, fire and grazing, and tree cutting alone improved herbaceous biomass, basal cover and species diversity (Ayana et al., 2012). Re-sprouting nature of the encroaching species after cutting during controlling the species is one of the other challenges. Prior published research indicated that cutting at 0.5 m aboveground and debarking the stumps down into the soil surface, or cutting at 0.5 m aboveground alone, were good in controlling Acacia drepanolobium. For controlling Acacia mellifera cutting at 0.5 m aboveground and dissecting the stumps and cutting at 0.5 m aboveground and debarking the stumps down into the soil surface had a significant effect (Bikila et al., 2014). Previous studies by (Coppock, 1994; Ayana, 2005; Gemedo et al., 2006; Daniel, 2010) conducted in the Borana rangelands on bush encroachment were more emphasized on bush encroachment covers and its effects on grass production and plant diversity than on the contribution of bush encroachment for carbon sequestration, because the primary objective of rangeland management in Borana is for livestock production. It is also essential to assess the impacts of bush encroachment on plant diversity over time, and the value of woody vegetation for storing carbon. As such, this study was conducted to evaluate the effects of bush encroachment on plant community composition, diversity, and carbon stocks by comparing these metrics across three rangeland types (bush encroached, non-encroached, and land exposed to bush thinning).
Description of the study area
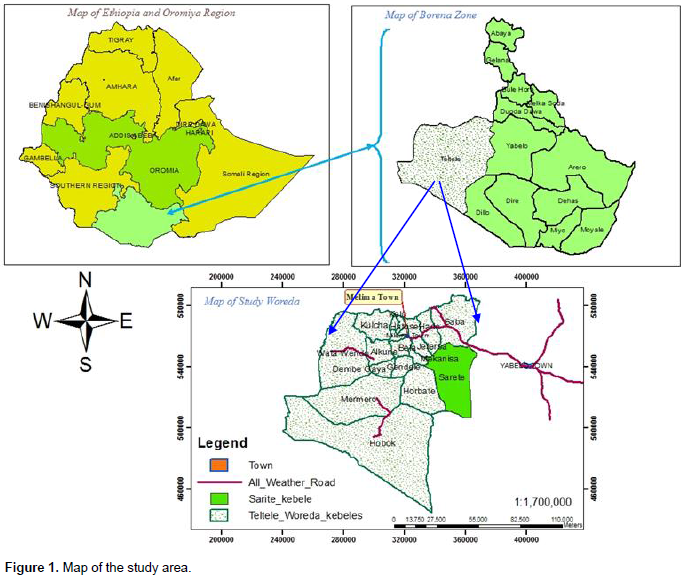
The study was undertaken in Teltele Woreda of Borana zone, Southern Oromia National Regional State, Ethiopia. Borana zone lies approximately between 4°3 ÌN to 5° N and 37° 4 ÌE to 38° 2 ÌE, and the landscape is characterized by slightly undulating peaks up to 2000 meters above sea level (m.a.s.l) in some areas (Coppock, 1994). Teltele Woreda is found at 100 km West of Yaballo, while the Sarite specific study site is found at 80 km Southwest of Yaballo (Figure 1). Borana weather is characterized by erratic and variable rainfall with most areas receiving between 238 and 896 mm annually (Ayana and Gufu, 2007). The rainfall pattern is distinctly bimodal, 59% of annual precipitation occurs from March to May, while 27% occurs from September to November (Coppock, 1994). The geological formations of the central Borana plateau are a Precambrian basement complex (38%), sedimentary deposits (2%), volcanic (20%) and 40% is quaternary deposits (Coppock, 1994), which influence soil fertility, and in turn, influences the vegetation characteristic. The three (3) main soils include 53% red sandy loam soil, 30% black clay, and volcanic light-colored silt clay and 17% silt (Coppock, 1994). The majority of Borana vegetation is characterized as Acacia-Commiphora woodland and bush land (Friis et al., 2011). The major land covers of the Borana zone are shrubland, grassland, woodland, cultivated land, and exposed surface (OWWDSE, 2010). However, high rates of land cover changing from grassland and bare land to shrubland have recently been observed (Daniel, 2010). The Borana communities use their grazing land as enclosures (Kalo), and also utilize open-grazed communal rangelands in which livestock graze throughout the year (Coppock, 1994). The specific study site was located around 04° 56’ 23” N and 37° 41’51” E at 970 to 100 m above sea level. As local elders reported, the rangeland was pure grassland with clay soil texture. Commonly encroaching woody species, and those that frequently thinned, include Senegalia mellifera, Vachellia reficiens and Vachellia oerfota.

Selection of the study site and sampling design
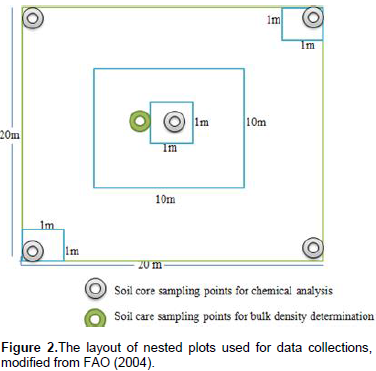
Teltele Woreda was selected because of the existence of bush encroachment and bush management practices. Sarite Kebele was selected because of the three rangeland types (bush encroached, non-encroached and bush thinned) found in proximity to one another. The term bush-encroached was used to designate the areas that were invaded by previously uncommon and subdominant woody plant species. The term bush thinned was used to designate bush-encroached areas in which encroaching woody plants were previously thinned for range management, while non-encroached rangelands include savannas and grasslands that had not been invaded by woody encroachers prior to the study. Within each rangeland type, one linear transect was systematically placed along a geographic gradient (elevation). Systematically placed plots along transect lines were selected since they are of considerable importance in the description of vegetation changes along environmental gradients or in relation to some marked features of topography (Mueller-Dumbois and Ellenberg, 1974). Six nested sampling plots were placed at 100 m intervals along each transect. Nested sampling plots consisted of a single 10 × 10 m2 subplot for sampling shrubs within a larger 20 × 20 m2 main plot used for sampling trees. Stratified within the main sampling plot and across the subplot, three additional 1 × 1 m2 quadrats were used for sampling seedlings, herbs, and grasses (Figure 2). Totally 18 nested sample plots, six from each rangeland type (encroached, non-encroached and bush thinned) were sampled. Soil samples were collected from the four corners and the center of all 20 × 20 m2 plots (main plot) at two depths (0-15 cm, 16-30 cm) and additional soil samples at the same depths were taken from the center of each of the main plots to determine bulk density.
Vegetation data collection and identification
Tree sampling
Tree (all individuals of woody species with DBH >5 cm) sampling was carried out by laying down 20 × 20 m2 plots using a measuring tape along the transect line at 100 m intervals. Within each 400 m2 plot, height and diameter of all individual trees were measured. The height was measured using a Silva-Hypsometer for trees taller than 4 m and using a measuring stick for trees less than 4 m high. Tree diameter was measured at the ankle (5 to 10 cm aboveground) and at breast height DBH (1.3 m above the ground) using a caliper. The longest crown diameter and diameter perpendiculars to the longest diameter and the crown height were measured using a 5 m long metal stick. In the case of multi-stemmed trees branched below DBH, the diameter was measured as the average of the DBH of each stem. If trees were branched or had separate trunks below the diameter at the ankle, each trunk was considered as a separate individual and thus their diameter was measured at DBH.
Shrub sampling
Shrubs are woody plants with multiple stems arising at or near the base and their canopy are intermediate between larger tree canopy and the understory plant (Allen et al., 2011). They were woody plants that were less than 5 cm DBH and greater than 2.5 cm circumferences at ankle and heights of less than 3 m. Shrub, bush and saplings measurements were collected from the 10 × 10 m2 subplots using similar methods used for measuring trees. As most of the encroaching species branched below DBH, measurements of the shrub diameter were made at the ankle; and crown diameter, crown height and total height were used to estimate aboveground biomass and carbon stocks, following previous study methods (Hasen et al., 2013).
Understory (grass and other herbaceous plants) sampling
In 1 × 1 m2 subplots, all herbaceous plants were identified, counted and recorded. All herbs, grasses, seedling, and climbers were clipped to the ground and separated into two groups; grass and non-grass after the species were identified. Their fresh weight was taken immediately in the field using a field balance, and sub-samples were taken where the sample was too large to manage for drying in an oven. For a small and manageable sample, the whole samples were stored in polyethylene bags and taken to Yaballo Pastoral and Dryland Agriculture Research Center soil laboratory and oven dried for 24 h at 105°C to determine the biomass and carbon stock. Identification of the species was made in the field with the help of field identification keys and plates and Flora of Ethiopia books (Edwards et al., 1995; Edwards et al., 1997; Edwards et al., 2000), or based on herbarium specimens collected from the sample plots. The name of the plant species was cross-checked with previous studies conducted in the study areas (Gemedo et al., 2005).
Plant diversity indices, similarity, and species composition
Measurement of diversity indices
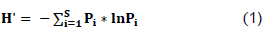
The formula for calculating the Shannon diversity index was from Magurran (2004):
where H’ = Shannon index of diversity; Σ = Summation symbol; total number of species in the sample; Pi = the proportion of the ith species (Pi = ni/N), ni= abundance of ith species and N = total number of individuals and ln = natural logarithm.
Dominance and Simpson index
Dominance was calculated as:
and Simpson index = 1-D
where D = Simpson index of dominance, (Pi =ni/N), ni= abundance of ith species and N = total number of individuals
Evenness or equitability index was calculated as:
E = (Hʹ)/lnS = (Hʹ)/ (Hʹ max) (3)
where E = Evenness; H’ = Shannon-Wiener Diversity Index; H max =ln(S).
Measures of similarity
Bray-Curtis similarity index and Sorensen coefficient of Similarity ( ) were calculated following Hammer et al. (2001), using Equations 4 and 5:
SS = 2a/(2a+b+c) (4)
where = Sorensen similarity coefficient, a = number of species common to both samples, b = number of species in sample 1, and c = number of species in sample 2.
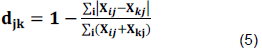
The Bray-Curtis similarity index is given by the formula:

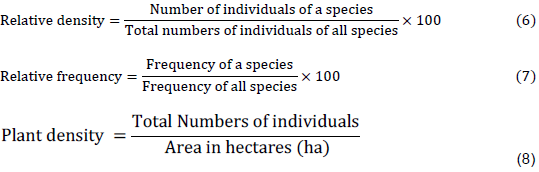
The counts of the species collected from each plot were pooled for each of the rangeland types. To determine the proportional representation of each species relative to the entire plant community, relative density and relative frequency values for each species were computed and expressed as a percentage following method used by Baxter, (2014).

Aboveground biomass and carbon stock determination
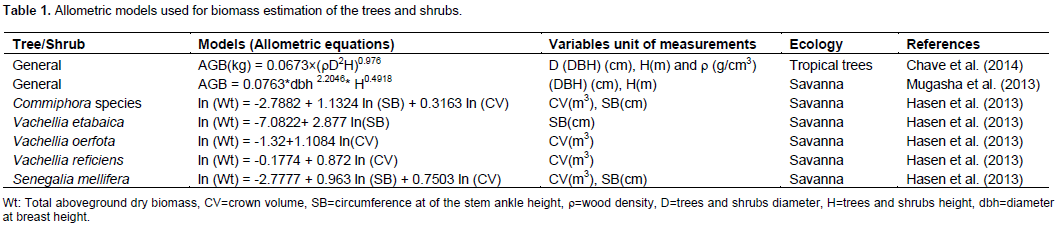
Tree and shrub biomass and carbon stock were estimated by non-destructive methods using an allometric equation. For major encroacher, woody species the locally developed allometric equations by Hasen et al., (2013) were used (Table 1). The canopy areas (CA) and volume (CV) of woody plants used as parameters in the model were calculated as an elliptic crown nature of shrubs following Hasen et al., (2013) using Equations 6 and 7, respectively.
CA= π ×a×b (9)
CV = 4/3×π×a×b×h (10)
where a = Crown radius, B = Crown width and h = Crown height

For trees and shrubs which have no locally developed allometric equation but have a wood density in the global wood density database, a general allometric model of Chave et al. (2014) was used to estimate the biomass (Table 1). The tree and shrub wood densities were estimated from the global wood density database (Zanne et al., 2009) by averaging the wood density of the tropical Africa region genera and families of that species. For the trees and shrubs which have no data in the global wood density database, an allometric model of Mugasha et al. (2013) was used to estimate biomass (Table 1). Aboveground tree/shrub carbon stock was calculated for each tree and shrub species as Equation 8 and belowground tree/shrub biomass was determined using a tropical tree regression model of Pearson et al. (2005). The total amount of tree and shrub biomass, and carbon stock per plot, were converted to per hectare basis (Pearson et al., 2005).
Carbon Stock = Aboveground biomass×0.5 (11)
BBD = EXP (-1.0587+0.8836×ln ABD) (12)
where BBD = belowground biomass density, and ABD = aboveground biomass density (t/ha).
Understory plants (herbaceous) biomass and carbon stock were determined by destructive methods. The herbaceous plants were clipped within 1 m x 1 m subplots along the diagonal of the main plot (Figure 2) and oven dried. The oven-dry weight was taken with a sensitive balance. The oven-dry weight of the three sub-sample plots from the main plots were averaged and converted to a hectare basis. The herbaceous carbon stock potential was estimated from the biomass of herbaceous plants using Equation 8. Belowground biomass of herbaceous plants was estimated from aboveground herbaceous biomass using a recommended root-to-shoot ratio value that is 50% of the ABG. Belowground carbon stock was calculated by multiplying the belowground herbaceous biomass by 0.5 (Persson et al., 2005).
BGB =AGB ×0.5 (13)
Methods of data analysis
Plant diversity was analyzed using PAST version 3.10, Paleontological Statistical software (Hammer et al., 2001). Prior to analysis, the data were tested for normal distribution using SPSS version 20 following Shapiro-Wilk methods. Diversity results with other vegetation attributes were analyzed using General Linear Model (GLM) procedures of the statistical analysis system with IBM SPSS version 20. One way analysis of variance (ANOVA) was used for all vegetation attributes and Tukey HSD (at P<0.05) was used to test for possible statistically significant mean pair differences.
Floristic compositions and diversity
Floristic composition
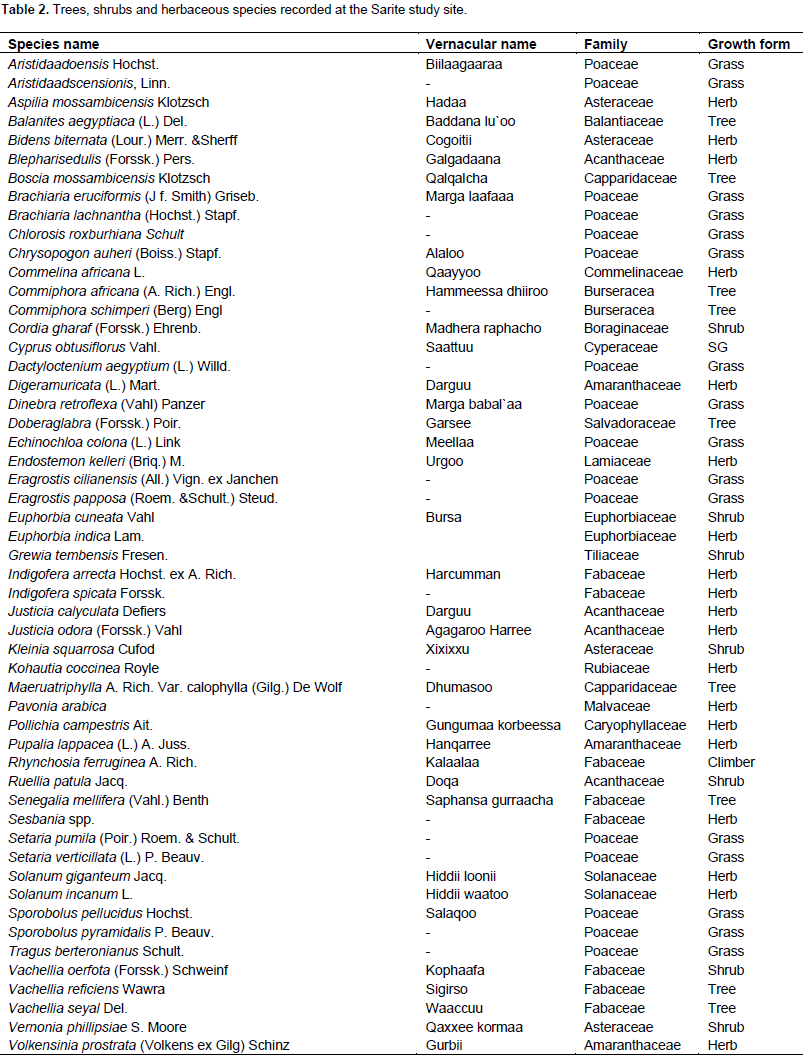
A total of 53 vascular plant species belonging to 19 families were encountered (Table 2) across the bush encroached, bush thinned and non-encroached rangeland types. Of the total species encountered in the study area, 12 species (Brachiaria eruciformis, Chlorosis roxburhiana, Cyprus obtusiflorus, Dactyloctenium aegyptium, Doberaglabra, Echinochloa colony, Indigofera arrecta, Endostemon Keller, Justicia calyculata, S. mellifera, Sporobolus pyramidalis and Volkensinia prostrata) were found on all three rangeland types. From the total species recorded in the study site, 15 species were either trees or shrubs and the remaining 38 were grass and non-grass herbaceous plant species. Among the total trees and shrubs identified, four species (Senegalia mellifera, Vachellia reï¬ciens, Vachellia oerfota and Commiphora africana) were found to be encroacher plant species. From the 19 total plant families recoded in the study area, Poaceae had the highest percentage (30.19%), while Fabaceae (15.09%), had the second highest followed by three families (Acanthaceae, Asteraceae and Amaranthaceae), which each accounted for 7.55% of the families encountered during the study. To determine the proportional representation of each species relative to the entire plant community, the relative density and frequency of all species were calculated for the bush encroached, bush thinned and non-encroached rangeland types of the study site and expressed as a percentage using the methods of Baxter (2014). Only the species with high relative density and frequency are presented here.
Senegalia mellifera, Vachellia reficiens, Dobera glabra and Vachellia oerfota were the tree/shrub, which had a relative density of 20.97, 7.98, 5.76 and 1.92%, respectively, in bush-encroached rangeland types. The relative frequencies of these trees and shrubs species were also high compared to other trees and shrubs in the bush-encroached rangeland types. Chlorosis roxburhiana, Setaria verticillata, Brachiaria eruciformis and Aristida adoensis were grass species encountered in the bush encroached rangeland types with high relative density and frequency compared to other grass species; on the other hand, Pupalia lappacea was the herb found only in bush-encroached rangeland type with the high relative density of 27.77% and frequency 4.76% in the study area. In bush thinned rangeland type, the trees/shrubs with high relative density were Senegalia mellifera and Dobera glabra, and the herbaceous plant species with high relative density and frequency were Brachiaria eruciformis, Aristida adoensis, Digera muricata, Sesbania sp. and Setaria verticillata; all of them were grasses except Sesbania species and Digera muricata. In non-encroached rangeland type, Brachiaria eruciformis, Sporobolus pyramidalis, Sporobolus pellucidus, Kohautia coccinea, Indigofera arrecta and Chlorosis roxburhiana were found with high relative density and frequency compared to other species. The Sarite study rangeland was moderately encroached and the explanation of bush encroachment is a recent phenomenon as noticed from field observations and according to local key informants. The evidence from this study suggests that the total number of species (tree/shrub and herbaceous) recorded in bush-encroached rangeland types was the highest compared to non-encroached and bush thinned rangeland types. Most of the plant recorded in bush thinned and non-encroached rangeland types were grasses and herbs.
Plant diversity
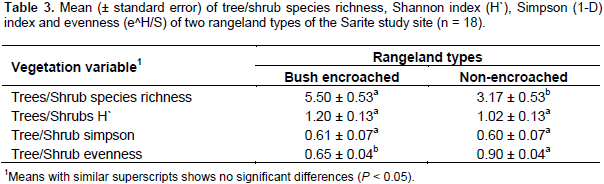
The diversity of flowering plant species varied widely among the studied rangeland types and vegetation types (tree/shrub and herbaceous). There was a significant difference between bush encroached and non-encroached rangeland types in terms of tree/shrub richness. However, the tree/shrub Shannon and Simpson diversity indexes were not significantly different between the two rangeland types (F=3.31, P=0.064; F=1.59, P=0.236, respectively). Bush encroached rangeland had the highest tree/shrub richness (Table 3). These two rangeland types were significantly different in the trees and shrubs evenness. Non-encroached rangeland types had more evenly distributed trees and shrubs as compared to bush encroached rangeland types; whereas, the tree/shrub species in the bush encroached rangeland type were less evenly distributed. The tree/shrub species richness was significantly higher in bush-encroached rangeland types as compared to non-encroached and bush thinned, which agrees with Tamrat et al. (2013) findings. This result indicated that bush encroachment increased woody plant species richness. The tree/shrub Shannon and Simpson diversity indices of bush encroached, and non-encroached rangeland types were not significantly different, this might be due to the encroaching species’ dominance in bush encroached rangeland types, while the non-encroached rangeland types tree/shrub were evenly distributed. Shannon diversity index (H) rises with an increasing number of species, as well as increasing equal distribution of species and vice versa.

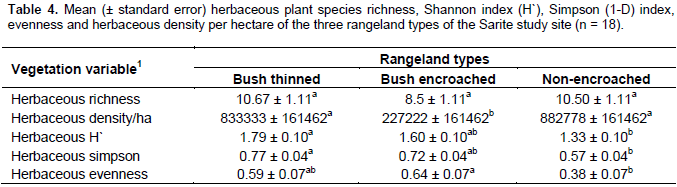
The herbaceous Shannon and Simpson diversity indexes and herbaceous species evenness were significantly different among bush encroached, bush thinned and non-encroached rangeland types, while the herbaceous richness did not show significant differences among the three rangeland types (Table 4). The herbaceous plant Shannon (1.79 ± 0.1) and Simpson (0.77 ± 0.04) diversity indices of bush thinned rangeland type was higher than that of the non-encroached rangeland Shannon (1.33 ± 0.1) and Simpson (0.57 ± 0.04) diversity indices; while the encroached rangeland type was not significantly different in terms of Shannon and Simpson diversity indices relative to the other two rangeland types (Table 4). Bush encroached rangeland type had the lowest herbaceous density; however, bush thinned and non-encroached rangeland types had higher and similar herbaceous plant density. The herbaceous plant species Shannon and Simpson diversity indices were the highest in bush thinned and the lowest in non-encroached rangeland types; however, bush encroached rangeland types were similar with the two rangeland types in terms of herbaceous plant species Shannon and Simpson diversity indices. These findings are in line with the results of Tamrat et al. (2013), who found an increase of plant species diversity, evenness and richness with woody plant encroachment. Contrary to this, previous studies by Bikila et al. (2014) and Niguse et al. (2014) in Borana ganglands showed that bush encroachment reduces the rangeland plant diversity compared to non-encroached.

The findings of the current study showed that the Shannon and Simpson diversity indices of herbaceous species in non-encroached rangeland type were not significantly different from the bush encroached rangeland types. Shannon and Simpson diversity indices of herbaceous species are higher in bush-encroached range type, even though it was not statistically significant. The reasons might be due to the establishment of shade-loving (tolerant) species (e.g. Pupalia lappacea was the herbaceous plant found only in bush-encroached rangeland type with a high relative density and frequency in the current study), or due to the heavy grazing in non-encroached rangeland type, or possibly due to the fact that the bush encroachment was a recent phenomenon in the area (the site moderately encroached). Its impact is highly variable depending on the level of encroachment and the local species composition. The herbaceous plant species density (number of individuals per hectare) and herbaceous biomass were lowest in bush-encroached rangeland types as compared to the non-encroached and bush thinned rangeland types. The result is in line with previous studies in the same agroecology, showing that woody density in both communal and enclosure grazing negatively correlated with the botanical composition of grass, basal cover, total range condition and grass yield (Gemedo et al., 2006; Teshome et al., 2012; Niguse et al., 2014). The increase in herbaceous plant species diversity, density and biomass following bush thinning were related with previous study findings that showed bush thinning increased herbaceous species composition and richness (Ayana, 2002; Ayana et al., 2012). Another study by Lesoli et al. (2013) indicated that bush controlling shifts the rangeland vegetation from dominance by woody vegetation to dominance by herbaceous vegetation through increased production of herbaceous vegetation.
The reduction in species richness and density of herbaceous plant species do not only result in the loss of biodiversity, but may also affect savanna ecosystem functions. In savanna ecosystems, the herbaceous component is considered to be a controlling element of the ecosystem and regulates functional processes such as water balance, productivity, nutrient cycling, fire and herbivores (Otto et al., 1996). The reduction in species richness, density and biomass of herbaceous plant species in bush-encroached rangeland types might be due to the aboveground (light) and belowground competitions. Senegalia mellifera, one of the encroaching species that occurs dominantly in the study area, was found to reduce understory radiation by approximately 53 to 65% (Belsky et al., 1993). Woody plant functional traits such as crown diameter, crown-base-height, evergreen and deciduous woody plants was found to be the major encroacher characteristics affecting the herbaceous cover in arid and semi-arid of southern Ethiopia (Tamrat and Moe, 2015). Woody encroachers with larger crown diameter and smaller crown base height usually have intact canopies that prevent solar radiation and rainwater infiltration to the understory vegetation (Tamrat and Moe, 2015). Encroaching species competition for light through shading, and for soil moisture and nutrients, because of their deeper root systems, reduce the growth of herbaceous species (Lesoli et al., 2013). In the non-encroached rangeland types, herbaceous plant composition and diversity declined; this might be due to increasing grazing pressures because of increasing livestock populations and the shrinkage in rangeland size due to the expansion of bush encroachments. According to Ayana and Gufu (2010), grazing pressure results in a reduction of herbaceous species composition and diversity.
Plant species composition similarity
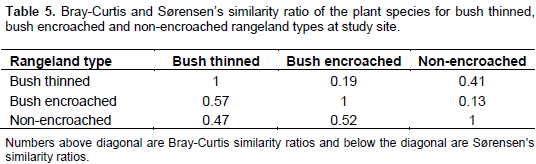
Vegetation composition similarity among the three rangeland types was compared using the Bray-Curtis similarity and Sørensen’s similarity indices. The Sørensen’s similarity index indicated that the bush thinned, and bush encroached rangeland types were more similar (0.57) than non-encroached and bush thinned rangeland types (0.47), and also for non-encroached and bush encroached (0.52). In contrast, Bray-Curtis similarity index, that considers the relative abundance of species, revealed that non-encroached and bush thinned rangeland types had the highest similarity ratio (0.41) than bush encroached and bush thinned rangeland types (0.19), and the least Bray-Curtis similarity ratio was showed by non-encroached and bush encroached rangeland types (0.13) (Table 5).

Plant biomass and carbon stock
Aboveground tree/shrub biomass and carbon stock
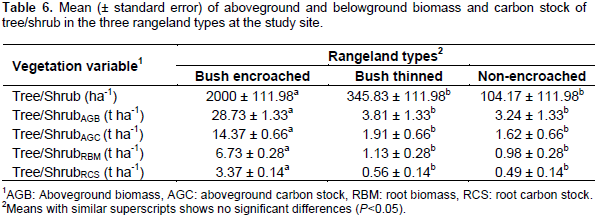
The density (that is the number of tree/shrub per hectare) in bush-encroached, bush thinned and non-encroached rangeland types were 2000 ± 111.98, 345.83 ± 111.98, and 104.17 ± 111.98, respectively; bush encroached rangeland type was significantly (df = 2, F = 84.92, P< 0.01) denser than bush thinned and non-encroached rangeland types (Table 6). Like the number of trees and shrubs per hectare, the trees, and/or shrubs aboveground biomass (df = 2, F = 120.7, P < 0.01) and carbon stock (df = 2, F = 120.7, < 0.01) were significantly different among the three rangeland types. The bush-encroached rangeland type stored significantly higher tree/shrub aboveground biomass and carbon stock (28.73 ± 1.33 t ha-1 and 14.37 ± 0.66 t ha-1, respectively) compared to non-encroached and bush thinned rangeland types; whereas, bush thinned, and non-encroached rangeland types were similar in terms of tree/shrub aboveground biomass and carbon stocks.

Belowground tree/shrub biomass and carbon stock
Belowground tree/shrub biomass and carbon stock showed similar trends to aboveground biomass and carbon stock. There were significant differences between bush encroached and the other two rangeland types (bush thinned and non-encroached) (P< 0.01 for both). The tree/shrubs root biomass and carbon stock in bush-encroached rangeland types were by far greater than non-encroached and bush thinned rangeland types, but not significantly different between non-encroached and bush thinned rangeland types (Table 6). The results revealed that tree/shrub aboveground and roots biomass and carbon stock was highly affected by the rangeland types. Bush encroached land stored carbon about 71% higher than the non-encroached, and 69% higher than the bush thinned rangeland types. The current result of aboveground tree/shrub carbon stock in bush-encroached (14.37 t ha-1) was related to the previous study by Hasen’s (2013) findings of the aboveground trees and shrubs carbon stock in highly encroached (13.8 Mgha-1) and severely encroached (13.6 Mgha-1) rangeland types. The increase in aboveground biomass and carbon stock following bush encroachment might indicate a positive contribution of bush encroachments for rangeland carbon sequestration and aboveground carbon stock. This finding agrees with Hasen (2013) who found significantly higher mean total AGC, shrub AGC, and tree AGC stocks were significantly increased with an increasing gradient of woody encroachment levels from low encroached to severely encroached rangeland. Another study in woody encroached savannas of central Argentina showed that the ecosystem carbon stock increased with increasing woody cover with mean values of 4.5 and 8.4 kg C m-2 in grassland and shrubland, respectively (Mariano et al., 2014). Like these findings, reviews of different studies by Archer and Predick (2014) indicated that the aboveground carbon pool could increase within the range from 0.3 t ha1 to 44 t ha-1 in less than 60 years of woody encroachment. The current study indicated that bush thinning significantly reduced the tree/shrub density and aboveground biomass and carbon stock as compared to bush encroached rangeland types. This result is consistent with a study by Archer and Predick (2014) who showed that bush management substantially and rapidly reduces the aboveground biomass and carbon stock of woody plants.
Herbaceous plant biomass and carbon stock
The results indicated significant differences in herbaceous biomass and carbon stock among the studied rangeland types. The aboveground herbaceous plant biomass was significantly (df = 2, F = 8.84, P< 0.01) higher in bush thinned and non-encroached rangeland types than bush encroached rangeland types; however, there was no significant difference between the bush thinned and non-encroached in terms of herbaceous biomass (Table 7). Like the aboveground herbaceous biomass, the aboveground and belowground herbaceous carbon stock was significantly affected by the studied rangeland types (df = 2, F = 8.76, P< 0.01) for both the aboveground and root herbaceous carbon stock. Bush encroached land had the lowest herbaceous aboveground and belowground carbon stock (Table 7). In general, most herbaceous parameters studied were affected by the rangeland types. Bush encroachment decreased herbaceous biomass and carbon stock. There was no significant difference between bush thinned and non-encroached rangeland types in terms of herbaceous aboveground and belowground biomass and carbon stock. In contrast to tree/shrub aboveground biomass and carbon stock improvements that follow bush encroachment, herbaceous aboveground carbon stock and biomass were significantly reduced by bush encroachment. Bush encroachment reduced the herbaceous aboveground carbon stock by 42% as compared to non-encroached rangeland types.
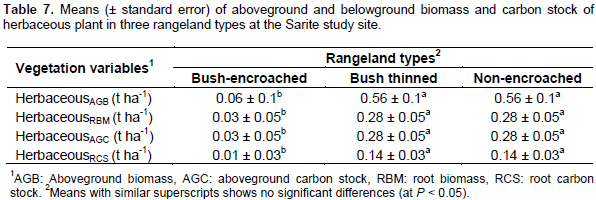
The herbaceous aboveground carbon stock in bush-encroached rangeland types (0.03 t ha-1) in the current study was similar with that reported by Hasen (2013) for severely encroached open grazing land (0.03 t ha-1) in Borana rangelands; however, less than highly encroached (0.5 t ha-1), moderately encroached (0.5 t ha-1) and low encroached (1 t ha-1) of open grazing land. The herbaceous aboveground carbon stock in bush thinned and non-encroached rangeland types were similar (0.28 t ha-1), but the result was less than that reported by Bikila et al. (2016) in the communal grazing land (0.4 t ha-1) of Borana rangeland. This difference in herbaceous Biomass and carbon stocks might be due to the precipitation, edaphic and topography variations of the two study areas. Similarly, Ayana, (2007) and Bikila et al., (2014) found that bush controlling improved herbaceous biomass accumulation and species diversity in the Borana rangelands. Review of studies in other areas shows that even with increased herbaceous biomass enhanced by bush management, the results were relatively short-lived (less than 6 years), because the encroaching plants regenerate again after some time (Archer and Predick, 2014).
Soil bulk density and carbon stock
The soil bulk density was significantly different among the rangeland types (P = 0.034); however, it did not significantly vary across soil depths (P = 0.051). There were no significant rangeland types and soil depth interactions effects on soil bulk density (P = 0.31). The bush thinned rangelands had lower soil bulk density as compared to non-encroached rangelands, while the soil bulk density of the bush encroached rangeland types was not significantly different from the other two rangeland types (Table 8). The soil carbon store of the studied land rangeland types was significantly different (df =2, F = 11.22, P < 0.01) and there were significant rangeland types and soil depth interaction effects on soil carbon stock (F=5.57, P < 0.01); however, soil carbon stock was not significantly different among the different soil depths (P = 0.17). The total soil carbon stock in 0 to 30 cm soil depth was greater (31.19 ± 1.69 t ha-1) in the bush thinned rangeland types as compared to the non-encroached rangeland types (22.39 ± 1.69 t ha-1), but not significantly different (26.95 ± 1.69 t ha-1) from bush encroached rangeland types (Table 8). The results of total soil carbon stock in bush thinned, bush encroached and non-encroached rangeland types fell within the range of earlier studies reported by Vågen and Winowiecki (2013) for tropical woodland and savanna ecosystems (20 to 80 t ha-1). The soil organic carbon stock in bush encroached rangeland types was greater than that of non-encroached rangeland type even though it was not statistically significant.
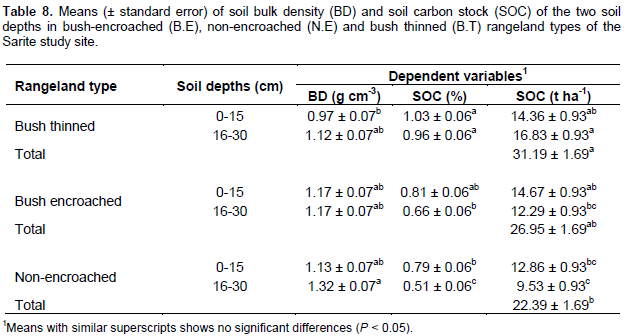
The results indicated that bush encroachments improve soil carbon stock by about 5% compared to non-encroached; and bush thinning also improves soil carbon stock by 6% compared to bush encroachments in the study area. The increase in soil carbon stock with bush encroachment might arise from high amounts of litter deposits and dead root addition to the soil from encroaching species, or the improvement of microclimate under bush encroached rangeland types. Alternatively, it might be due to the heavy grazing in non-encroached rangeland types. Soil carbon sequestration may initially increase with bush encroachment, but then declines if bush densities become so high as to inhibit understory herbaceous growth (Hudak et al., 2003). A study by Hasen et al. (2015) showed that soil organic carbon stock (SCS) is affected by grazing, woody encroachment and soil texture. Changes in soil organic carbon (SOC) such as those associated with the conversion of grasslands to shrublands or woodlands ranged from positive to neutral to negative (Eldridge et al., 2011). Bush thinned rangeland types had lower soil bulk density (not statistically significant) and have higher soil organic carbon stock as compared to non-encroached rangeland types. A review by Archer and Predick (2014) showed that we have insufficient information about potential outcomes of bush management effects on the soil carbon stock.
The increases of SOC in the current study that were observed following bush thinning might be due to several reasons. These include the high biomass return from cutting woody species or root death after cutting woody plants to the soil, or the increase in herbaceous plant species density (positively correlated (48%) with soil carbon stock), and biomass which in turn reduces soil erosion, or could be due to heavy grazing in the non-encroached rangeland type. However, the herbaceous plant density and biomass was similar for bush thinned and non-encroached rangeland types. So, the scenario that the potential cause for increases in SOC following bush thinning might be more evident due to the high biomass return from cutting woody species or root death after cutting woody plants. The extent to which shrub roots are impacted by bush management is unknown; but if bush stumps are killed, large amounts of carbon could enter the soil pool and accumulate to significant amounts (Archer and Predick, 2014). The net soil carbon sequestration in dryland primarily depends on the rate of input of organic matter, the rate of decomposition of organic matter and the rate of carbon loss through soil respiration (Tennigkeit and Wilkes, 2008).
Total carbon stock
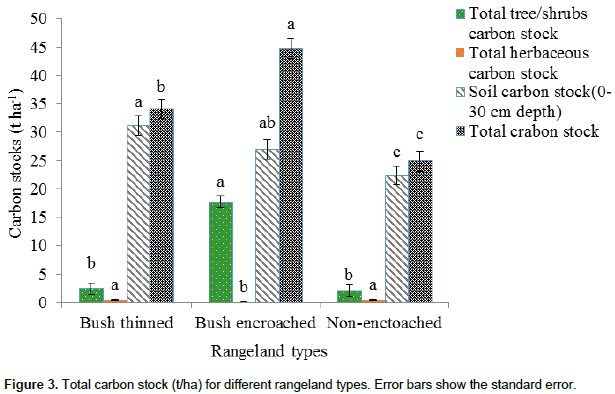
As Figure 3 shows, the overall carbon stock (that is aboveground and belowground living tree/shrub, herbaceous, and soil carbon stock up to 30 cm depths) was highly significantly different among the three rangeland types (df =2, F = 19.31, P<0.01). Bush encroached rangeland types had the highest amount of total carbon stock (44.73 ± 1.76 t ha-1), followed by the bush thinned rangeland type (34.08 ± 1.76 t ha-1). The lowest total carbon stock was found in non-encroached rangeland types (24.92 ± 1.76 t ha-1). The soil carbon stock had the highest total carbon stock of the three rangeland types. The total carbon stock (aboveground and belowground living tree/shrub, herbaceous, and soil carbon stock up to 30 cm depths) of the studied rangeland type, bush encroached, bush thinned and non-encroached of the current study were 44.73, 34.08 and 24.92 t ha-1, respectively. The result was less than that reported in semi-arid areas of a communally grazed (141.5 t ha-1) Borana pastoral ecosystem (Bikila et al., 2016), and that reported in communal grazing management (93.01 t ha-1) in the semi-arid pastoral ecosystem of northern Kenya (Dabasso et al., 2014). The variation might be due to the climate, vegetation, topography and edaphic variations of the study areas; moreover there could be differences in the methods of estimating the aboveground carbon stock and the carbon pool components incorporated in the total aboveground carbon stock. Dryland organic carbon stock, in aboveground vegetation and soils, declines with aridity; and inorganic soil carbon increases as aridity increases (David et al., 2005).

According to the present study, bush encroached rangelands store more carbon (19%) than non-encroached, and 10% more store carbon than bush thinned rangeland types. In all studied rangeland types, soil carbon stock has the highest proportions, that is 92% in bush thinned, 60% in bush-encroached and 90% in non-encroached rangeland types for total carbon stocks of the rangeland ecosystem as compared to the vegetation components. These results concurred with studies indicating that most of the carbon in grassland ecosystems is stored in soils (Tennigkeit and Wilkes, 2008; Dabasso et al., 2014; Bikila et al., 2016). This study found, a significant increase in ecosystem carbon stock with woody plant encroachments. These results are consistent with other studies in the same agroecology that have shown the estimated AGC stocks in highly encroached sites were up to three times greater than that of the less encroached sites (Hasan, 2013). Moreover, the current results were similar to those of a study in woody encroached savannas of central Argentina (Mariano et al., 2014) that indicated total carbon stocks in grasslands, shrublands, open and closed forests are 4.5, 8.4, 12.4, and 16.5 kg cm-2, respectively.
A study in South American semi-arid savanna showed that closed woodlands have three times more total ecosystem carbon than grasslands, and the net gain in the ecosystem carbon stocks along the woody cover gradient was due to the increases in soil organic carbon stock (González-Roglich et al., 2014). The tree and shrub plant species richness and Shannon diversity index were significantly positively correlated with aboveground tree/shrub carbon stock and total carbon stock of the studied rangeland ecosystem. This indicates that woody plant species diversity and richness have a significant contribution for the rangeland ecosystem carbon sequestration. The dramatic shift in the AGC stock with woody plant encroachment is likely to increase overall AGC stock within the ecosystem; however, encroachment supersedes the herbaceous biomass, density and carbon stock component of the ecosystem. The reduction in herbaceous biomass and density is adversely affecting the pastoral economy, which is often the main reason for starting bush controlling or management practices in the study area. However, bush thinning, or clearing reduced the total carbon stock, and did not significantly increase the soil carbon stock as compared to bush encroachment in the study area.

The change in vegetation communities following bush encroachment has direct consequences on ecosystems functioning and services delivery. Our study found that bush encroachment increased tree and/or shrub species richness, and aboveground tree/shrub and soil carbon stock. Consequently, herbaceous plant biomass and density were reduced, and resulted in declining productivity of the rangeland ecosystem. On the other hand, controlling bush encroachment in the form of thinning improved herbaceous species density and biomass, and soil carbon stock. In general, this study confirmed bush encroachment increased total carbon stock of the studied rangeland ecosystem. These results might lead to the assumption that bush encroachment could contribute to climate change mitigations and payments for ecosystem service from the rangelands in the study area. However, it reduces the productivity of rangelands, which is the mainstay of a pastoralist’s livelihood. Moreover, further study is also important to detect the effects of bush encroachment on others rangeland ecosystem processes such as underground water and contributions by soil microorganisms.
The authors would like to express their gratitude to USA Forest Services for providing MSc training cost and research fund (totally about 3582 US$) and the staff of Yaballo Pastoral and Dryland Research Centre for helping and facilitating the field work.
The authors have not declared any conflict of interests.
REFERENCES
|
Adisu AZ (2009). Bush Encroachment and its Impacts on Plant Biodiversity in the Borana Rangelands. A Thesis Submitted to the School of Graduate Studies Addis Ababa University In Partial Fulfillment of the Requirements for the Degree of Master of Science in Environmental Science, 99 p.
|
|
|
|
Allen VG, Batello C, Berretta EJ, Hodgson J, Kothmann M, Li X, McIvor J, Milne J, Morris C, Peeters A, Sanderson M (2011). An international terminology for grazing lands and grazing animals. Grass Forage. Sci. 66:2-28.
Crossref
|
|
|
|
|
Andela N, Liu YY, van Dij AIJM, de Jeu RAM, McVicar TR (2013). Global changes in dryland vegetation dynamics (1988–2008) assessed by satellite remote sensing: comparing a new passive microwave vegetation density record with reflective greenness data. Biogeosciences 10:6657-6676.
Crossref
|
|
|
|
|
Anteneh B, Zewdu KT (2016). Mechanisms of bush encroachment and its inter-connection with rangeland degradation in semi-arid African ecosystems: a review. J. Arid Land 9(2):299-312.
|
|
|
|
|
Archer SR, Predick KI (2014). An ecosystem services perspective on brush management : research priorities for competing land-use objectives, J. Ecol. 102(6):1394-407.
Crossref
|
|
|
|
|
Auken OV (2000). Shrub invasions of North American semiarid grasslands. Annu. Rev. Ecol. Syst. 31:197-215.
Crossref
|
|
|
|
|
Auken OV (2009). Causes and consequences of woody plant encroachment into western North American grasslands. J. Environ. Manage. 90:2931-2942.
Crossref
|
|
|
|
|
Ayana A (2002). The effect of clearing bushes and shrubs on range condition in Borana, Ethiopia. Trop. Grass. 36:69-76.
|
|
|
|
|
Ayana A (2005). The ecological impact of bush encroachment on the yield of grasses in Borana rangeland ecosystem, pp. 14-20.
|
|
|
|
|
Ayana A (2007). The Dynamics of Savanna Ecosystems and Management in Borana, Southern Ethiopia. Ph.D. Thesis, Norwegian University of Life Sciences, Department of International Environment and Development Studies, Ås, Norway.
|
|
|
|
|
Ayana A, Gufu O (2007). Relating long-term rainfall variability to cattle population dynamics in communal rangelands and a government ranch in southern Ethiopia. Agric. Syst. 94:715-725.
Crossref
|
|
|
|
|
Ayana A, Gufu O (2008). Herder Perceptions on Impacts of Range Enclosures, Crop Farming, Fire Ban and Bush Encroachment on the Rangelands of Borana, Southern Ethiopia. Hum. Ecol. 36:201-215.
Crossref
|
|
|
|
|
Ayana A, Gufu O (2010). Effects of grazing pressure, the age of enclosures and seasonality on bush cover dynamics and vegetation composition in southern Ethiopia. J. Arid Environ. 74:111-120.
Crossref
|
|
|
|
|
Ayana A, Gufu O, Adunya T (2012). Bush Encroachment Control Demonstrations and Management Implications on Herbaceous Species in Savannas of Southern Ethiopia. Trop. Subtrop. Agroecosyst.15:173-185.
|
|
|
|
|
Baxter J (2014). Vegetation Sampling Using the Quadrat Method. Dept. of Biological Sciences, Spring, 2014.
|
|
|
|
|
Belsky AJ, Mwonga SM, Amundson RG, Duxbury JM, Ali AR (1993). Comparative effects of isolated trees on their under canopy environments in high-rainfall and low-rainfall savannas. J. Appl. Ecol. 30:143-155.
Crossref
|
|
|
|
|
Bikila N, Bedasa E, Samuel T, Barecha B, Jaldesa D, Nizam H (2014). Control of bush encroachment in Borana zone of southern Ethiopia: effects of different control techniques on rangeland vegetation and tick populations. Pastoralism 4:18.
Crossref
|
|
|
|
|
Bikila NG, Tessam ZK, Abule EG (2016). Carbon sequestration potentials of semi-arid rangelands under traditional management practices in Borana, Southern Ethiopia. Agric. Ecosyst. Environ. 223:108-114.
Crossref
|
|
|
|
|
Chave J, Réjouâ€Méchain M, Búrquez A, Chidumayo E, Colgan MS, Delitti WB, Duque A, Eid T, Fearnside PM, Goodman RC, Henry M (2014). Improved allometric models to estimate the aboveground biomass of tropical trees. Glob. Chang. Biol. 20(10):3177-3190.
Crossref
|
|
|
|
|
Coppock D (1994). The Borana Plateau of Southern Ethiopia: Synthesis of Pastoral Research, Development and Changes 1980-1990. In: System Study No.5. ILCA, 374 p.
|
|
|
|
|
Dabasso BH, Taddese Z, Hoag D (2014). Carbon stocks in semi-arid pastoral ecosystems of northern Kenya. Pastoralism 4(1):5.
Crossref
|
|
|
|
|
Daniel J (2010). The extent of Bush Encroachment and Its Impacts on Selected Soil Properties in Borana Rangeland, Ethiopia. MSc. Thesis, Hawassa University Wonndo Genet College of Forestry and Natural Resources, Integrated Watershed Mangement.
|
|
|
|
|
David N, Juan P, Robin W, Rattan L, Mark W, Juliane Z, Stephen P, Emma A, Caroline K (2005). Dryland Systems, Part III: An Assessment of Systems from which Ecosystem Services Are Derived, In: M E Series & RS Rashid Hassan (Ed.), Ecosystems and Human Well-being: Current State and Trends. Island Press. Washington DC 1:623-662.
|
|
|
|
|
Edwards S, Sebsebe D, Hedberg I (1997). Flora of Ethiopia and Eritrea, Vol. 6, The National Herbarium, Addis Ababa University: Addis Ababa and Department of Systematic Botany, Uppsala University, Uppsala.
|
|
|
|
|
Edwards S, Mesï¬n T, Hedberg I (1995). Flora of Ethiopia and Eritrea, Vol. 2 (2), the National Herbarium, Addis Ababa University: Addis Ababa and Department of Systematic Botany, Uppsala University, Uppsala.
|
|
|
|
|
Edwards S, Mesï¬n T, Sebsebe D, Hedberg I (2000). Flora of Ethiopia and Eritrea, Vol.2 (1), the National Herbarium, Addis Ababa University: Addis Ababa and Department of Systematic Botany, Uppsala University, Uppsala.
|
|
|
|
|
Eldridge DJ, Matthew AB, Fernando TM, Erin R, James F, Walter GW (2011). Impacts of shrub encroachment on ecosystem structure and functioning: towards a global synthesis. Ecol. Lett. 14(7):709-722
Crossref
|
|
|
|
|
Food and Agriculture Organization (FAO) (2004). Assessing carbon stocks and modeling win-win scenarios of carbon sequestration through land-use changes. Rome.
|
|
|
|
|
Gemedo-Dalle T, Brigitte LM, Johannes I (2005). Plant Biodiversity and Ethnobotany of Borana Pastoralists in Southern Oromia, Ethiopia. Econ. Bot. 59(1):43-65.
Crossref
|
|
|
|
|
Gemedo D, Brigitte LM, Johannes I (2006). Encroachment of woody plants and its impact on pastoral livestock production in the Borana lowlands, southern Oromia, Ethiopia. Afr. J. Ecol. 44:237-246.
Crossref
|
|
|
|
|
Hammer Ø, Harper DAT, Ryan PD (2001). PAST: Paleontological Statistics Software Package for Education and Data Analysis. Palaeontologia Electronica 4(1):9.
|
|
|
|
|
Hasen YM (2013). The influence of land use and cover changes on the pastoral rangeland systems of southern Ethiopia - How much woody cover is enough? Ph.D. Thesis, University of Hohenheim.
|
|
|
|
|
Hasen YM, Treydte AC, Abule E, Sauerborn J (2013). Predicting aboveground biomass of encroacher woody species in semi-arid rangelands, Ethiopia. J. Arid Environ. 96:64-72.
Crossref
|
|
|
|
|
Hasen Y, Treydte AC, Sauerborn J (2015). Managing Semi-Arid Rangelands for Carbon Storage: Grazing and Woody Encroachment Effects on Soil Carbon and Nitrogen. Plos One, 10(10): 01090.
|
|
|
|
|
Hudak AT, Wessman CA, Seastedt TR (2003). Woody overstorey effects on soil carbon and nitrogen pools in South African savanna. Austral Ecol. 28:173-181.
Crossref
|
|
|
|
|
Hughes RF, Archer SR, Asner GP, Wessman CA, Mcmurtry C, Nelson J, Ansley RJ (2006). Changes in aboveground primary production and carbon and nitrogen pools accompanying woody plant encroachment in a temperate savanna. Glob. Chang. Biol. 12:1733-1747.
Crossref
|
|
|
|
|
Friis IB, Demissew S, van Breugel P (2011). Atlas of Potential Vegetation of Ethiopia. Addis Ababa, Ethiopia: Addis Ababa University Press and Shama Books.
|
|
|
|
|
Lal R (2008). Carbon sequestration. Phil. Tran. Roy. Soc. Biol. Sci. 363:815-830.
Crossref
|
|
|
|
|
Lesoli MS, Gxasheka M, Solomon TB, Moyo B (2013). Integrated Plant Invasion and Bush Encroachment Management on Southern African Rangelands. licensee InTech.
|
|
|
|
|
Magurran AE (2004). Measuring biological diversity. Blackwell, Oxford.
|
|
|
|
|
González-Roglich M, Swenson JJ, Jobbágy EG, Jackson RB (2014). Shifting carbon pools along a plant cover gradient in woody encroached savannas of central Argentina. For. Ecol. Manag. 331:71-78.
Crossref
|
|
|
|
|
Maestre FT, Bowker MA, Puche MD, Hinojosa MB, Martinez I, Garcia-Palacios P, Castillo AP, Soliveres S, Luzuriaga AL, Sanchez AM, Carreira JA, Gallardo A and Escudero A (2009a). Shrub encroachment can reverse desertification in semi-arid Mediterranean grasslands. Ecol. Lett. 12: 930-941.
Crossref
|
|
|
|
|
Mitchard ETA, Flintrop CM (2013). Woody encroachment and forest degradation in sub-Saharan Africa's woodlands and savannas 1982- 2006. Phil. Trans. R. Soc. B. 368(1625):20120406.
Crossref
|
|
|
|
|
Mueller-Dumbois D, Ellenberg D(1974). Aims and methods of vegetation ecology. John Willey and Sons, Inc, USA. P 547.
|
|
|
|
|
Mugasha WA, Eid T, Bollandsås OM, Malimbwi RE, Chamshama SAO, Zahabu E, Katani JZ (2013). Allometric models for prediction of above- and belowground biomass of trees in the miombo woodlands of Tanzania. For. Ecol. Manag. 310:87-101.
Crossref
|
|
|
|
|
Niguse BD, Mekuria AD, Gemedo D (2014). Plant Diversity and Vegetation Structure in Encroached and Non-encroached Areas of Borana Rangelands: The Case of Hallona and Medhacho Pastoralist Associations. J. Agric. Sci.Technol. 4:787-796.
|
|
|
|
|
OWWDSE (Oromia Water Works Design & Supervision Enterprise) (2010). The National Regional State of OromiaOromia Land and Environmental Protection Bureau. Borana Land Use Planning Study Project. Finfinne/Addis Ababa.
|
|
|
|
|
Otto TS, Ernsto M, Juan FS (1996). Biodiversity and tropical savanna Properties: Global review. Berlin, Springer.
|
|
|
|
|
Pearson T, Sarah W, Sandra B (2005). Sourcebook for Land-use, Land-use Change and Forestry Projects. Benoit Bosquet and Lasse Ringius.
|
|
|
|
|
Robin W, Siobhan M, Mark R (2000). Grassland Ecosystem. In pilot analysis of global ecosystems. Washington D.C. World Resources Institute.
|
|
|
|
|
Scholes RJ, Archer SR (1997). Tree-Grass Interactions in Savannas. Annu. Rev. Ecol. Syst. 28:517-544.
Crossref
|
|
|
|
|
Shapiro SS, Wilk MB (1965). An Analysis of Variance Test for Normality (Complete Samples). Biometrika, 52:591-611.
Crossref
|
|
|
|
|
Sheikh AQ, Skinder BM, Pandit AK, Ganai BA (2014). Terrestrial Carbon Sequestration as a Climate Change Mitigation Activity. J. Pollut. Effects Contr. 30:1-8.
Crossref
|
|
|
|
|
Tache B, Oba G (2010). Is Poverty Driving Borana Herders in Southern Ethiopia to Crop Cultivation? Hum. Ecol. 38(5):639-649.
Crossref
|
|
|
|
|
Tamrat AB, Totland Ø, SR Moe (2013). Woody vegetation dynamics in the rangelands of lower Omo region, southwestern Ethiopia. J. Arid Environ. pp. 94-102.
|
|
|
|
|
Tamrat AB, Stein RM (2015). Assessing the Effects of Woody Plant Traits on Understory Herbaceous Cover in a Semiarid Rangeland. Environ. Manag. 56:165-175.
Crossref
|
|
|
|
|
Tamrat AB, Ørjan T, Stein RM (2013). Ecosystem responses to woody plant encroachment in a semiarid savanna rangeland. Plant Ecol. 214:1211-1222.
Crossref
|
|
|
|
|
Tennigkeit T, Wilkes A (2008). An Assessment of the Potential for Carbon Finance in Rangelands. ICRAF China Working Paper No.68, Beijing.
|
|
|
|
|
Tilahun A, Teklu B, Hoag D (2017). Challenges and contributions of crop production in agro-pastoral systems of Borana Plateau, Ethiopia. Pastoralism 7(1):2.
Crossref
|
|
|
|
|
Teshome A, Abule E, Lisanework N (2012). Evaluation of woody vegetation in the rangeland of Southeast Ethiopia. Int. Res. J. Agric. Sci. Soil Sci. 2(3):113-126.
|
|
|
|
|
Vågen TG, Winowiecki LA (2013). Mapping of soil organic carbon stocks for spatially explicit assessments of climate change mitigation potential. Environ. Res. Lett. 8:015011.
Crossref
|
|
|
|
|
Wilfred MP, Izaurralde RC, West TO, Liebig MA, King AW (2012). Management opportunities for enhancing terrestrial carbon dioxide sinks. Front. Ecol. Environ. 10:554-561.
Crossref
|
|
|
|
|
Zanne AE, Lopez-Gonzalez G, Coomes DA, Ilic J, Jansen S, Lewis SL, Miller RB, Swenson NG, Wiemann MC, Chave J (2009). Data from: Towards a worldwide wood economics spectrum. Dryad Digital Repository.
View
|
|