Full Length Research Paper
ABSTRACT
INTRODUCTION
For millennia the earth’s greatest diversity of ungulates has been carried by African savannahs that extend from Senegal in the west to Ethiopia in the east. These biomes include tropical ecosystems characterized by a continuous grass layer occurring together with trees under a different climatic regime (Justice et al., 1994). These ecosystems provide shelters and food for wildlife. Unfortunately during these last decades, researches have shown that savannahs are undergoing degradation and fragmentation due to combined effects of fire, human activities and climate variation (Riggio et al., 2013). Consequently, some species are highly endangered and at risk of extinction among which the large mammals like ungulates are the most threatened (Baskaran et al., 2011). In West Africa particularly in Senegal, the Derby Eland (Taurotragus derbianus derbianus Gray, 1847) is one of the mammalian species on the International Union for Conservation of Nature (IUCN) red list of critically endangered species and even close to extinction (UICN, 2008).
The Derby Eland was widespread to West African savannah and its historical range covered Cameroon – Gambian’s axis (Dorst and Dandelot, 1970). Nowadays owing to natural and human pressures its wild habitat is solely restricted to the Niokolo Koba National Park (NKNP) and its neighbouring Faleme Hunting Zone both (East, 1998; IUCN, 2008). NKNP is Senegal’s largest and oldest national park set on Sudano-Guinean savannah (Madsen et al., 1996; Mbow, 2000). Despite its already shrunk location, the Eland’s natural habitat in the national park is currently undergoing degradation emphasizing its shrinking and the number of Eland individuals is decreasing (IUCN, 2008). In 1990, the population of Eland was estimated at 1000 individuals (Sournia and Dupuy, 1990) but its later estimation set between 400 to 800 individuals (East, 1998) and has been decreased to approximately 170 individuals in wildlife in the NKNP (Hájek and Verne, 2000; Renaud et al., 2006).
This continuous decreasing population puts Eland on the UICN critical list of endangered species (IUCN, 2008). In the light of this, some preservative measures were taken with the establishment of the first breeding ex-situ herd in Bandia reserve (Antoninova et al., 2004). Till recent date, little is known on the wild habitat of the Derby Eland in its last natural refuge. Researches had been done on the Western Derby Eland in wild but they had a narrow-scope, mainly oriented on aerial and ground survey in the NKNP (Galat et al., 1992; Hájek and Verne, 2000; Renaud et al, 2006) and on the diet constituents (Hejcmanová et al., 2010). There is lack of ecological information on its habitat which deserves to be filled. In contrast to the habitat of its relative, the Eastern Derby Eland (Taurotragus derbianus gigas Heuglin, 1863) which is dwelling in savannah vegetation is dominated by Isoberlinia doka (Bro-Jorgensen, 1997; East, 1998; Grazian and d’AlessiSilvio, 2004) is more documented.
Therefore it becomes urgent for a better conservation strategy and a sustainable management in the wild habitat to describe its last habitat. Hence this study aims to improve knowledge and information on the last worldwide wild habitat of the Western Derby Eland for its better ecological management and for decision making. Research focused on the species’ composition and diversity in relation with the environmental factors in order to provide basic knowledge for the sustainable management of the Western Derby Eland population in NKNP. As the Derby Eland is a browser (Grazian and d’AlessiSilvio, 2004), the study hypothesized that it lives in habitat with a similar floristic composition.
MATERIALS AND METHODS
.png)
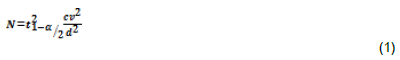
 = 2.04 as value of the Student t distribution test at probability of 0.975 and Cv= 57 % as coefficient of variation of basal area from 30 trees’ individuals randomly chosen during a pre-inventory.


RESULTS
Fifty trees species belonging to 40 genera and 29 families were recorded (Appendix 1). The most represented families were Combretaceae (13.92%), Leguminosae-mimosoideae (12.66%), Leguminosae-caesalpinioideae (11.39%), Leguminosae-papilionoideae (7.59%), Rubiaceae (7.59%) and Tiliaceae (6.33%). The most abundant species were Combretum glutinosum Perr. ex DC., (28.79%), Pterocarpus erinaceus Poir. (12.42%), Crossopteryx febrifuga (Afzel. ex G. Don) (7.30%), Strychnos spinosa Lam. (7.18%) and Hexalobus monopetalus (A. Rich.) Engl. & Diels (7.06 %).
The non-metric multidimensional scaling (NMDS) indicated a very good ordination of the plots with r2 = 0.943 and a stress value of 0.122 (Figure 3). Figure 3 indicates no clear discrimination of the plots, suggesting that floristic composition is quite similar among zones
.png)
The species richness and Shannon-Wiener diversity index are higher (S=50 and H’= 3.99) in ZHPEO than in ZMPEO (S=18 and H’=3.20) whereas Pielou’s index is higher in ZMPEO (Eq= 0.77) than in ZHPEO (Eq= 0.71) (Table 1). Species indicator analysis (Table 2) reveals no indicator species in ZHPEO while the most indicator species or species combinations for ZMPE O included Combretum glutinosum + Crossopteryx febrifuga, Crossopteryx febrifuga, Combretum glutinosum + Pterocarpus erinaceus, Crossopteryx febrifuga + Pterocarpus erinaceus and Combretum collimum + Crossopteryx febrifuga.
.png)
.png)
Relationship species-environmental variables
The results of the CCA indicated that the first three axes accounted for 69.46% (29.39% for the first axis, 21.45% A= specificity, it is the probability that the surveyed site belongs to the target site group given the fact that the species has been found; B= fidelity, it is the probability of finding the species in sites belonging to the site group; IndVal = Indicator Value Index. for the second one and 18.61% for the third one) of the total variation captured by the CCA. Most of the environmental variables showed high correlations (0.51 to 0.88) with the three axes (Table 3).Axis 1 is negatively correlated to altitude, while fire and tree cover are positively correlated to axis 2 (Table 3). Axis 3 is positively correlated to soil type and herbaceous cover and negatively correlated to fire and hardness (Table 3). Projections of these environmental variables on these three CCA axes with the plots (Figure 4a, b) showed that plots of ZMPEO are located in area with low altitude and low tree cover, less occurrence of fire and on short (sandy) to compact clay soils (less hard) whereas plots of the ZHPEO scattered showed a correlation with high altitude and high tree cover, more occurrence of fire and hard substrate (outcrop granite).
.png)
.png)
.png)
DISCUSSION
Floristic composition and diversity
Predominant families such as combretaceae, leguminosae-mimosoideae, leguminosae-caesalpinioideae, leguminosae-papilinoideae, rubiaceae and tilliaceae found are in accordance with findings run on the diets of Derby Eland in NKNP (Hejcmanová, et al., 2010). The richness of 50 woody species with dbh ≥ 5 cm assessed on 6.24 ha is different compare to the 59 species of trees and shrubs identified on an area of 5 km2 (HejcmanovÄ-Nežerková and Hejcman, 2006) but lower than the106 woody species found on an area of 228 km2both in NKNP (Traore, 1997). This diversity is an important asset for herbivorous browsers such as Eland which find variate fodder within their habitat. However, this woody plant richness is very low compared to those found in of the Eastern Eland’s (T. d. gigas) habitat. Indeed Grazian and d’AlessiSilvio (2004) recorded 212 species and Bro-Jorgensen (1997) noted less than 10 common species in the habitat of the Eastern Eland in Central African Republic. This difference may be attributed to data collection method, geographical location and local climatic conditions. Habitats of the Western and the Eastern Eland are also different in terms of species composition (Spinage, 1986; Bro-Jorgensen, 1997; Kingdon, 1997). The Eastern Eland is found in Isoberlinia doka (Craib & Stapf) savannah (Bro-Jorgensen, 1997; East, 1998) while this species is not recorded in Senegalese flora (Berhaut, 1967; Ba et al., 1997).
The NMDS analysis reveals that the vegetation of the confined area of the Derby Eland in NKNP harbours almost the same woody species (Figure 3). This finding supports hypothesis that the Eland frequents habitat with a quite similar floristic composition (Kruskal, 1964b). This floristic similarity is witnessed by the results of species indicator analysis. Indeed even though some species or combinations of species present specificity none fidelity of species recorded in the Derby Eland habitat (Dufrene and Legendre, 1997; De Cáceres and Legendre, 2009; De Cáceres et al., 2012) (Table 2).
The CCA analysis reveals that fire, soil type, altitude and trees cover are the most important environmental factors influencing the vegetation distribution. Overall, shrubs and small trees are found in ZMPEO whereas big trees are found in ZHPEO. Traore (1997) and HejcmanovÄ- Nežerková and Hejcman (2006) identified soil type and topography as factors impacting the species composition of the NKNP. Topography was also described as key factors determining Eland habitat (East, 1998), and this is witnessed by park rangers’ observations. Indeed migratory movements are noticed from low altitude and marshy areas to high altitude and hilly rocky areas from the dry season to the raining season (park rangers’ observations).
Mbow (2000) identified fire as patter controlling the species composition in NKNP. Indeed early fires are used every year by park rangers as tool management to prevent damages of late fires occurring in the late dry with catastrophic consequences. These fires improve regrowth of some herbaceous species participating to herbivores feeding, increase sight possibilities for tourism and remove predation for herbivores. In NKNP apart from removal predation and preventing consequences of late fire, these early fires do not impact really on Derby Eland survival because Hejcmanová et al., (2010) found that the Western Derby Eland feeds on grasses less than 5%. In contrast Bro-Jorgensen (1997) admitted that Eastern Eland never feeds on grass while Hillman and Fryxell (1998) showed that Eastern Eland takes a few amount of fresh sprouting grass in the early wet season. Trochain (1940) and Lawesson (1995) argued that climatic conditions are the most important factors that determine the vegetation NKNP and habitat of Derby Eland.
CONCLUSION AND RECOMMENDATIONS
The zones of occurrence of the Derby Eland has a high floristic diversity of which Combretacea is the dominated family even though the estimated number of plant species in NKNP is exceeding 1000 (Madsen et al., 1996). Altitude, fire occurrence and vegetation cover were the most important environmental factors influencing the distribution of these species. These factors were identified as influencing factors on the vegetation of NKNP but they seem not to have negative impact on the floristic composition because HejcmanovÄ-Nežerková and Hejcman (2006) identified similar species richness. However, compare to the habitat of its relative relative the Eastern Derby Eland; the Habitat of the Western Derby Eland has less rich and diverse flora.
Nevertheless information on the floristic composition of Derby Eland’s confined area is bedrock for its conservation, and will assist management decisions on the choice of new sites for future in-situ conservation fencing for the remaining wild population in NKNP and eventually for the ex-situ population at Badian and Fathala reserves. To enhance a sustainable management and conservation of the Derby Eland in NKNP, further to the settlement of the in-situ enclosure, it is highly recommend the use of telemetric tools like GPS collars and camera traps in order to enhance information in its last wild habitat.
CONFLICT OF INTERESTS
The authors have not declared any conflict of interests.
ACKNOWLEDGEMENTS
This work has been funded by the German Federal Ministry of Education and Research (BMBF) through the West African Science Service Centre on Climate Change and Adapted Land Use (WASCAL, www.wascal.org). The authors acknowledge the helpful cooperation with the Senegalese Directorate of the National Parks. The authors acknowledge enlightening exchanges from Dr Fortune Azihou and Dr Seyni Salack. We express our gratitude to the anonymous reviewers who gave us constructive comments to improve this article.
REFERENCES
|
Antoninova M, Nežerková P, Vincke X, Al-Ogoumrabe N (2004). Herd Structure of Giant Eland in Bandia Reserve. Agric. Trop. Subtropica. 37(1):1-5. |
|
|
Ba AT, Sambou B, Ervick F, Goudiaby A, Camara C, Diallo D (1997). Vegetation and flora of the cross-bordering Niokolo-Badiar. G.H.M.Messana, I. Diop and M.B. Sow (Eds.). European Union, Aarhus. |
|
|
Baskaran N, Kannan V, Thiyagesan K, Desai AA (2011). Behavioural Ecology of four horned antelope (Tetracerusquadricornis de Blainville, 1816) in the tropical forests of southern India. Mammal. Biol. 76:741-747. |
|
|
Berhaut J (1967). Flora of Senegal. (2nded.). Claire Afrique, Dakar, 1–485. |
|
|
Bro-Jorgensen J (1997). The ecology and behaviour of the Giant Eland (Tragelaphus derbianus, Gray 1847) in the wild. Master's thesis, University of Copenhagen. pp. 1-106. |
|
|
Dagnelie P (1998). Applied and theorical statistic, vol. 2. De Boeck and Larcier, Belgique, Paris. |
|
|
East R (1998). African Antelope Data Base. Ed Gland, Switzerland: The IUCN Species Survival Commission, Compiler 1999:355-383. |
|
|
De Cáceres M, Legendre P (2009). Associations between species and groups of sites: Indices and statistical inference. Ecology. 90(12):3566-3574. |
|
|
De Cáceres M, Legendre P, Wiser SK, Brotons L (2012). Using species combinations in indicator value analyses. Methods in Ecology and Evolution. 3:973-982. |
|
|
De Cáceres M, Legendre P (2013). Dissimilarity measurements and the size structure of ecological communities. Methods Ecol. Evol. 4(12):1167-1177. |
|
|
Dorst J, Dandelot P (1970). A field guide to the larger mammals of Africa. Collins, London, pp. 1-287. |
|
|
Dufrene M, Legendre P (1997). Species assemblages and indicator species: the need for a flexible asymmetrical approach. Ecol. Monogr. 67(3):345-366. |
|
|
Galat G, Mauvais B, Chevillotte H, Diop A, Duplantier JM, Galat-Luong A, Pichon G (1992). Cenus of the big fauna of Niokolo Koba National Park, Senegal. 1990-1991:1-57. |
|
|
Grazian P, d'AlessiSilvio G (2004). Radio-telemetric monitoring of Derby Eland (Tragelaphus derbyanus gigas) in north Centre Africa. Project ECOFAC-ZCV, I.E.A. (Instituto di EcologiaApplicata) – ROMA. pp. 1-77. |
|
|
HejcmanovÄ-Nežerková P, Hejcman M (2006). A Canonical Correspondence Analysis (CCA) of the Vegetation-Environment Relationships in Sudanese Savannah, Senegal. South Afr. J. Bot. 72(2):256-262. |
|
|
Hejcmanová P, Homolka M, Antonínová M, Hejcman M, Podhájecká V (2010). Diet Composition Of Western Derby Eland (Tauratragus derbianus derbianus) In Dry Season In A Natural And Managed Habitat In Senegal Using Fecal Analyses. South Afr. J. Wildlife Res. 40(1):27-34. |
|
|
Hájek I, Verne PH (2000). Aerial Census of Big Game in Niokolo-National Park and Falemé Region in Eastern Senegal. Proceed. All Africa Conference on Animal Production, Alexandria. 3:5-9. |
|
|
Hillman JC, Fryxell JM (1988). Sudan. 5-16. In: East, R. ed. Antelopes: Global survey and regional action plans, Part 1: East and Northeast Africa. Gland: IUCN. |
|
|
IUCN SSC Antelope Specialist Group (2008). Tragelaphus derbianus ssp. derbianus. The IUCN Red List of Threatened Species. Version 2015.2. <www.iucnredlist.org>. Downloaded on 10 July 2015. |
|
|
Justice C, Scholes R, Frost P (1994). African Savannahs and the Global Atmosphere: Research Agenda. IGBP (Report No. 31), Stockholm. |
|
|
Kingdon J (1997). The Kingdon Field Guide to African Mammals. Academic Press, London and New York: Natural World. |
|
|
Kruskal JB (1964a). Nonmetric multidimensional scaling: A numerical method. Psychometrika. 29:115-129. |
|
|
Kruskal JB (1964b). Multidimensional scaling by optimizing goodness of fit to a nonmetric hypothesis. Psychometrika: 29:1-27. |
|
|
Kruskal JB, Wish M (1978). Multidimensional Scaling, Sage University Paper series on Quantitative Applications in the Social Sciences. 07–011, Beverly Hills and London: Sage Publications. |
|
|
Lawesson JE (1995). Study of woody flora and vegetation in Senegal. Opera Botanica. 125:1-172. |
|
|
Lebrun JP, Stork AL (1991-1997). Enumeration of flower plants of Tropical Africa. 4 volumes. Geneva: Conservatory and Botanic Garden, Geneva. |
|
|
Madsen J, Dione D, Traore SA, Sambou B (1996). Flora and vegetation of NiokoloKoba National Park, Senegal. In: van der Maesen, J et al., (Eds.), The Biodiversity of African Plants. Kluwer Academic Publishers, Dordrecht. pp. 214-219. |
|
|
Magurran AE (2004). Measuring biological diversity. Blackwell Science Ltd. |
|
|
Mbow C (2000). Study of the spatio-temporal characteristic of bush fire and their relation with the vegetation in Niokolo-Koba National Park (South-East Senegal). Thesis Dissertation University Cheikh Anta Diop, ISE/FST. 1–121. |
|
|
Mbow C, Chhin S, Sambou B, Skole D (2013). Potential of dendrochronology to assess annual rates of biomass productivity in savannah trees of West Africa in Dendrochronologia (2012). Dendrochronologia. 31(1):41-51. |
|
|
Oksanen J, Blanchet FG, Kindt R, Legendre P, Minchin PR, O'Hara RB, Simpson LG, Solymos P, VenablesWN, Ripley BD (2002). Modern Applied Statistics with S. Fourth Edition. Springer, New York. ISBN 0-387-95457-0 |
|
|
Renaud PC, Gueye MB, Hejcmanová P, Antoninova M, Samb M (2006). Aerial and pedestrian census of the fauna and records of the pressures in Niokolo Koba National Park. African Park Conservation/Ministry of environment and of the protection of nature. pp. 1-44. |
|
|
Riggio J, Jacobson A, Dollar L, Bauer H, Becker M, Dickman A, Funston P, Groom R, Henschel P, de Iongh H, Lichtenfeld L, Pimm S (2013). The size of savannah Africa: a lion's (Pantheraleo) view. Biodiv. Conserv. 22:17-35. |
|
|
Sambou B, Bâ AT, Goudiaby A, Sonko I, Mbow C (2007). Étude de la flore et de la végétation ligneuse pour la détermination des types d'usages compatibles avec une gestion durable de la forêt classée de Patako (Sénégal), Webbia: J. Plant Taxono Geograp. 62(1):85-96. |
|
|
Sambou B, Ba AT, Mbow C, Goudiaby A (2008). Studies of the woody vegetation of the Welor forest reserve (Senegal) for sustainable use. West Afr. J. Appl. Ecol. 13:67-76. |
|
|
Spinage CA (1986). The Natural History of Antelopes. Croom Helm (Eds.), London. pp. 1-310. |
|
|
Sonko I (2000). Study of effect of early and late fire on the flora and ligneous vegetation of plates of Niokolo-Koba National Park, South-East Senegal. Thesis Dissertation University Cheikh Anta Diop of Dakar, ISE/FST. pp. 1-124. |
|
|
Sournia G, Dupuy A (1990). Senegal. In: EAST, R.: Antilopes. Global survey and regional action plans, Pt 3: West and Central Africa, IUCN Gland. |
|
|
Traore SA (1997). Analysis of ligneous flora and vegetation in Simenti zone (Niokolo Koba National Park), Eastern Senegal. Thesis Dissertation, University Cheikh Anta Diop of Dakar, ISE/FST. pp. 1-136. |
|
|
ter Braak CJF (1986). Canonical correspondence analysis: a new eigenvector technique for multivariate direct gradient analysis. Ecol. 67:1167-1179. |
|
|
terBraak CJF (1987). The analysis of vegetation-environment relations by canonical correspondence analysis. Veg. 69:69-77. |
|
|
Trochain JL (1940). Contribution to the study of vegetation of Senegal. Memory IFAN, Larose, Paris, 2:1-434. |
|
Copyright © 2024 Author(s) retain the copyright of this article.
This article is published under the terms of the Creative Commons Attribution License 4.0


