ABSTRACT
Currently, the majority of land used in South Africa for wildlife by the private sector has been converted from livestock farms to game farms and covers more land than state-owned provincial and national parks conservation areas combined. One animal that stands out above most wildlife regarding its popularity is the lion. From a private land owners’ point of view, lions are amongst the most sought after animals for photographic safaris and trophy hunting, leading to the increase of lion breeding and populations on private land to the point where the private sector is responsible for managing the largest portion of the lion population in South Africa. Therefore, the aim of this research is to determine the economic significance of lion breeding within the South African wildlife industry. Qualitative interviews were conducted with 21 breeders in South Africa. The results revealed that lion breeders contribute R500 million (US$ 42 million) annually to the South African economy. The contribution of this research is twofold. Firstly, it was the first time such research has been conducted amongst lion breeders, and secondly, it points to the economic significance of lion breeding regarding the amount spend by breeders as well as number of jobs maintained by this breeders.
Key words: Consumptive and non-consumptive wildlife tourism, economic significance, ecotourism, lion breeding, wildlife tourism.
The wildlife industry in South Africa is currently conducted on a large scale with an estimated 9000 wildlife properties covering an area of approximately 18 million hectares, which is 2.2 times greater than the state-protected area network of the country (Van Hoven, 2005; Els, 2017). What makes South Africa’s wildlife industry unique in the world is that wildlife can be privately owned (Du Plessis, 1997). The majority of today's land used for wildlife by the private sector
in South Africa, has been converted from livestock and crop farms due to reasons such as wildlife developed an economic value, wherein the 1900s to 1960s that was no or very little value; it [Rev1] became more economically viable to keep and use wildlife for commercial purposes than livestock (Cloete et al., 2015); in the 1990s, the demand for an African safari experience expanded rapidly, and tourism started to flourish (Scriven and Eloff, 2003). Before this, wildlife was perceived as an undesirable competitor to livestock farming for limited grazing land.
As it became clear that a much wider range of income possibilities could be generated from wildlife, landowners began to realise that the wildlife industry might be an alternative option to, for example, livestock farms or other agricultural activities such as crop farming (Du Plessis, 1997). Since then, the wildlife industry has expanded, and today, the wildlife industry in South Africa provides consumable activities, such as recreational hunting, trophy hunting, biltong and wildlife meat production as well as non-consumable activities, namely breeding of wildlife and ecotourism (game viewing, walking safaris, and photographic safaris). One animal that stands out above most wildlife regarding its popularity for non-consumptive as well as consumptive use (Lindsey et al., 2007, 2012b; Higginbottom, 2004), is the lion. Historically, lions could be found all over the African, European and Asian continents. However, there has been a dramatic decline in lion distribution and numbers in Africa due to habitat destruction, poaching, killing to protect livestock, hunting and depletion of the prey base as well as the direct consequences of the bush meat trade (Bauer and Van der Merwe, 2004; Bauer et al., 2008).
In the case of South Africa, lions had been eradicated from much of their historical range by the 1900s (Nowell and Jackson, 1996). Fortunately for South Africa, in the early 1990s lions were reintroduced into several reserves and national parks to increase their numbers (Funston, 2008; Slotow and Hunter, 2009), and today the Kruger National Park, Kgalagadi Transfrontier Park and Hluhluwe-iMfolozi Game Reserve are seen as specific strongholds for lions in South Africa (Government Gazette, 2015; Hayward et al., 2007; Hunter et al., 2007). From a private land owner’s perspective, lions are among the most sought-after animals for photographic safaris and trophy hunting (Van der Merwe and Du Plessis, 2014; Saayman and Saayman, 2014), leading to the increase in populations on private land due to breeding and buying of lion prides.
[Rev2]
Lion conservation management in South Africa is classified into four categories: Wild lions (largely unmanaged, which exist just in proclaimed national parks and game reserves); managed wild lions (all lions that have been re-introduced into smaller fenced reserves, <1000 km2) and captive lions (bred exclusively to generate money and managers actively manipulate their breeding) (Funston and Levendal, 2015). Added to the South African captive lion population are animals kept in ex-situ facilities (e.g. sanctuaries, zoos and lion parks), where roaming is restricted, and where there is a high level of human contact (Funston and Levendal, 2015).
The wildlife industry (lion industry) in South Africa is largely located in the rural provinces of the country, predominantly the Northern Cape, North West, Limpopo, Free State, Mpumalanga, KwaZulu-Natal and Eastern Cape provinces (van der Merwe et al., 2007). Legislation further impacts on the South African private lion sector regarding where and how game species can be hosted. For example, most provinces allow private ownership of lions, but it is mainly the Free Sate and North West Provinces (80% of the hunting of lions is conducted in these two provinces, of which 50% are in Free State Province) that allow the hunting of lions (Williams et al., 2015; Els, 2017). In fact, no lions are hunted for trophy proposes in any of the national parks in South Africa, though limited hunting is allowed in some provincial state-owned reserves (Funston and Levendal, 2015). Therefore, lion hunting is predominantly conducted by the private wildlife industry on private land.
As the focus of this research is on determining the economic significance of lions, the researchers first had to identify what research had been previously conducted in this regard. Only a few studies pertaining to the economics of lions were found which included those by Lindsey et al. (2007, 2012a, b) and Cadman (2009). The research by Lindsey et al. (2007) focused on the economic and conservation significance of the trophy hunting industry in sub-Saharan Africa (Botswana, South Africa, Mozambique, Namibia, Tanzania, Botswana, Zimbabwe and Zambia), which included the hunting of lions. However, the latter revealed little about any economic significance of trophy hunting or that of lion hunting. In 2012, two studies were conducted by Lindsey et al. (2012a, b).
The second study by Lindsey et al. (2012b) determined the possible relationships between the South African captive-bred lion hunting industry and the hunting and conservation of lions elsewhere in Africa. The study’s main aim was not to determine the economic impact or significance of lion hunting or breeding. They, however, indicated that the captive-bred lion hunting industry in South Africa had grown rapidly in the last couple of years, while the number of wild lions hunted in other African countries has declined. In 2009 and 2010, 833 and 682 lion trophies were exported from South Africa, respectively, more than double the combined export (2009, 471; 2010, 318) from other African countries. The export of lion bones from South Africa also increased, and it was found that at least 645 (carcases) were exported in 2010, 75.0% of which went to Asia. In this study, they again only supplied the average price of lions hunted, which is US$37000 to 76000.
A report by Cadman (2009) commissioned by The National Council of SPCAs in South Africa (Society for the Prevention of Cruelty to Animals), however, indicated some economic results regarding lion hunting and breeding. In the report, Cadman (2009) indicated that lion hunting generated some R97,104,200 in 2007 and R49,240,240 in 2006. These figures reflect only the species fee, meaning no other costs were captured regarding travel and accommodation, for example. Cadman (2009) indicated that the average fee per lion is R152 920 and further stated that an estimated 900 people are employed in the lion industry. The report also indicates that lion breeders had invested some R700 million in land and infrastructural developments. The Cadman report, however, gives no clear indication of how this was conducted; therefore, leaving one with more questions than answers, especially on what the economic significance of the lion industry in South Africa is. Further to this, none of these studies investigated the economic significance of lion breeding (from supply side point of view), except Cadman, but it lacks a sound methodology. Lion breeding and hunting have also featured in the media, notably so in the documentary “Blood lions” and that of ‘Cecil the Lion’ that created a great deal of negative publicity on the topic. All these aspects contribute to this study being conducted based on the question; what is the economic significance of lion breeding in South Africa, how many people are employed and how much it costs to breed them?
To breed lions is a complex operation. Firstly, the development of the appropriate infrastructure, which includes holding facilities, staff houses, proper fencing of hunting camps (minimum size of 1000 ha), roads, accommodation facilities, to name but a few, is required. Secondly, there are the operational costs that consist of general running costs (wages, salaries, water and electricity), marketing, licence fees and operation leases (Els, 2017). For this study, the researchers excluded capital intensive infrastructure for the analysis and simply used the operational cost to determine the economic significance of the lion breeding industry. The reason for this was that infrastructure development differed significantly from farm to farm and did not take place within the year of the analysis (2016) (which is important for determining economic significance) as capital developments normally take place over several years as the product develops.
Determining the said significance in this research was undertaken because it measures the scale of the economic activity and, as a result, provides useful information when trade-offs are involved (Crompton, 2006). Economic significance is one of the numerous ways to define and measure value. Although other types of value are often important, this kind of significance is useful to consider when making economic choices that involve trade-offs in allocating resources. Economic significance is a measure of the importance of the finding in supporting or disproving one’s hypotheses (Ecosystem Valuation, 2015), but it does not evaluate any loss in economic activity if it did not take place. Rather, it measures the size of the economic activity and, based on this, provides useful information when trade-offs are involved (Crompton, 2006). Therefore, the aim of this research is to determine the economic significance of lion breeding within the South African wildlife industry .
Qualitative research was conducted using structured interviews. According to Creswell (2013), qualitative research is an approach to exploring and understanding the meaning individuals or groups ascribe to a social or human problem. This approach involves emerging questions and procedures; data are typically collected in the respondents setting; data analyses are inductively built from particulars to general themes (Creswell, 2013).
The interviewed population consisted of members of the South African Predators Association (SAPA). For the purpose of this study, the focus was on lion breeders, lion traders and lion owners in South Africa. Stratified purposive sampling was used, where every third respondent on the SAPA members’ list was chosen, from whom to gather data. The stratified purposive sampling approach was selected so that each respondent had an equal chance to be chosen and because resources for this study were limited. According to Patton (2002), purposive sampling is a technique used widely for most effective use, in such a case. According to Nieuwenhuis (2007), this form of sampling means that respondents are selected according to a preselected criterion relevant to a specific research question; in this case, it referred to the lion farmers on the given list.
This qualitative interview instrument was newly developed, based on work conducted by Van der Merwe et al. (2011) and Saayman and Van der Merwe (2003). The interview instrument consisted mostly of closed response questions and a few open-ended questions. It contained three main sections: Demographic (for example, age and the highest level of qualification), development (number of lions and variations of lions on your establishment), economic (cost per month to operate lion facilities and the average price per lion) and management (size of camps and the number of employees).A letter by the president of SAPA was sent to SAPA members to explain the aim of the research and also to indicate that SAPA management does endorse the research. Members were informed that they would be contacted telephonically. The members of SAPA were interviewed from June 2015 to September 2016, using telephonic or face to face interviews. Members were telephoned and again what the aim of the research is explained to them, and if agreed to be interviewed, the researcher continued with the interview.
Data analysis
The South African Social Accounting Matrix (SAM) model based on the Input-Output model was employed to determine the economic significance of the private lion industry. The SAM model is one of the most popular models, used by various analysts (Akkemik, 2012), and has been extensively utilised to analyse numerous issues such as energy (Akkemik, 2012; Hartono and Resosudarmo, 2008), fisheries (Seung and Waters, 2009), foreign direct investment (Harun et al., 2012), climate change (Pal et al., 2011) and tourism (Rossouw and Saayman, 2011; Akkemik, 2012; Li and Lian, 2010; Cloete and Rossouw, 2014) as well as various other issues.
The SAM is an extension of the Input-Output model. Input-Output (I-O) models are described as sets of equations that describe the components that link the output of one industry within all other industries in an economy. This model can be used to determine the impact of a factor within each industry and may provide more significant information than do measures of the mere income, output and employment (Broomhall, 1993). According to Cameron (2003), I-O analysis is a logical framework devised with the intention of evaluating the interconnection of industries in an economy. In their most primitive form, I-O models can be defined by a system of linear equations that describe the allocation of an industry’s product throughout the economy. This model is a complete method to estimate the flow of money between sectors, sub-sectors, organisations, businesses and consumers, while researchers mentor the interdependence effects when applying the various multipliers (Reeves, 2002). The I-O model can measure precise effects of macroeconomic changes on the local economy and also examine the improvement that a particular sector of the local economy could achieve. These models may be tailored to be relevant for precise conditions and economies or applied to address economies of scale associated with changes of output (Reeves, 2002).
The inter-sectorial links in I-O models are expanded through SAM by identifying the link between production sectors and all institutions within the tourism economy (Akkermik, 2012). The SAM can be used to examine the interrelationship between production structure, income distribution and household expenditure (Pal et al., 2011). The SAM model stands out from various other models due to its ability to detail the supply and demand, as well as who benefits from increased spending. This is especially important since the distribution of income of a certain activity can shed light on the influence that it has on both inequality and poverty in the country. Furthermore, Jones (2010) indicates that various types of multipliers can be derived from SAM models to capture the direct, indirect and induced impacts on output.The analysis of economic significance is determined by using the operational cost per year of a participant, which is converted to the associated increase in production, income and jobs in the provincial economy using economic multipliers from a Social
Accounting Matrix (SAM) model. The multiplier measures the changes in economic activity due to a change in spending in the economy. The multiplier captures the direct, indirect and induced effect of an increase in spending. The direct effect is the initial change in economic activity due to the spending, while the indirect effect measures the increase in production in other sectors due to their linkage with the direct activity sectors. The induced effect measures the increase in economic activity due to an increase in household income. It should be noted that the full effect is not immediate, but will only be realised over time (Pal et al., 2011).
The SAM multiplier approach makes use of specific multipliers for each cost-related subdivision. Costs are converted into the associated increase in output and income through the multipliers, while secondary effects are determined as the spending of a participant circulated through the national economy. The 2012 National Social Accounting Matrix (SAM) was used to determine the direct (spending by breeder on fencing) and indirect impact (fencing company pays their suppliers and employees) of a typical lion breeding farm in the country. The 2012 SAM consists of 62 activities, 140 commodities and 14 different household types based on income levels (Van Seventer et al. 2016).
The results from this study are discussed in three sections; firstly, the socio-demographic profile of participants; secondly, the operational cost of lion breeders; and thirdly, the household income.
Socio-demographic profile
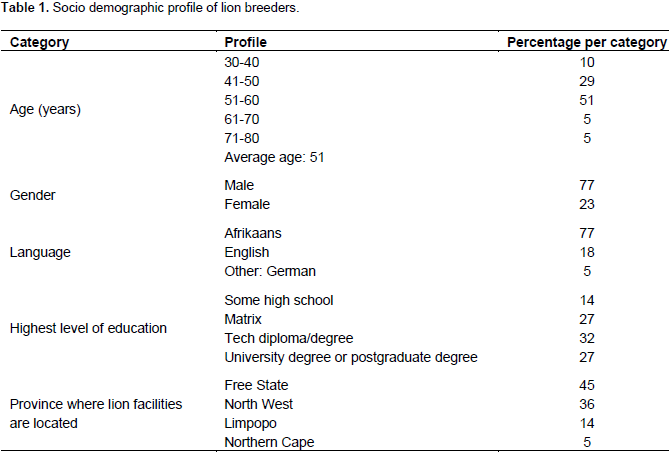
The socio-demographic profile of the participants who formed part of the research was based on age, gender, home language, the highest level of education, training and province where situated. The majority of participants were male (77%), while a small percentage of participants were female (23%). The average age of the participants was 51 years of age, with the most commonly spoken language being Afrikaans (77%), followed by English (18%) and German (5%). It was clear from Table 1 that the majority of participants were well educated. Thirty-two percent (32%) of participants held a technical diploma/degree, 27% had attained a university degree or a postgraduate degree, 27% held a matric qualification, while 14% had achieved a high school grade. The research shows (Table 1) that the largest percentage of participants are located in the Free State Province (45%), followed by the North West Province (36%) while a small proportion of participants are situated in the Limpopo (14%) and Northern Cape Provinces (5%).

Operational costs of a typical lion breeding establishment
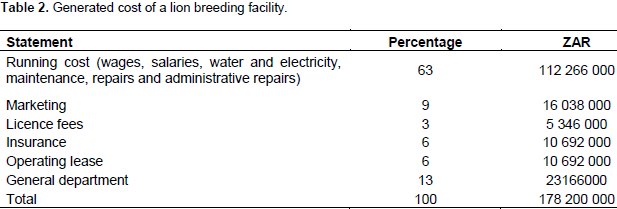
The operational cost refers to recurring costs per year
and therefore offers a reliable indication of the loss of economic activity in the absence of lion breeding. The breakdown of operational costs into various commodity items used to shock the SAM was obtained via the surveys. The operational cost of a typical lion breeding farm (Table 2) consists of the following items: Running costs (wages, salaries, water and electricity, maintenance, repairs and administrative repairs), marketing, licence fees, insurance, operating lease and general department.Table 2 provides an indication of what lion breeders spend their operational costs on. A typical lion breeder spends 63% of operational cost on running costs per month, while 13% is expended on general aspects, 9% on marketing, 6% on insurance, 6% on an operational lease and a small percentage on licence fees (3%). Based on these amounts, the average running cost per lion breeding facility is approximately R50,000 per month. This equates to R600,000 per year: If one multiplies this by the number of breeding facilities (297), the total amounts to R178 200 000 per year. This merely represents expenditure on operational costs per year, excluding the infrastructure costs.
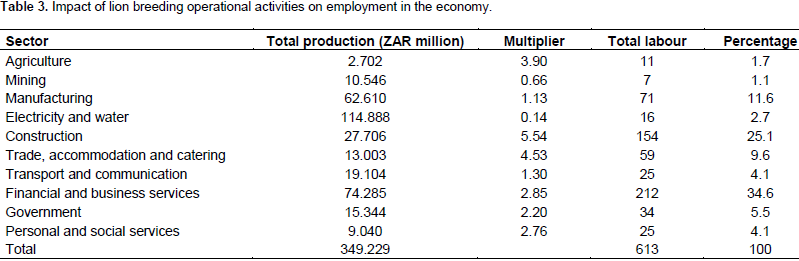
The calculations of the direct, indirect and induced impacts of the operational cost per year of these farms are presented in Table 2. To determine the economic significance of lion breeding activities, all of the cost items were divided into one of the SAM commodity divisions (excluding salaries paid to workers). Using the multipliers, the subsequent indirect and induced effects on production in the economy of the direct spending by the total lion breeding industry were determined. The results were then aggregated into the main national accounts sector, as illustrated in Table 3. Production refers to the total turnover generated by each sector in the provincial economy. The production consists of two elements, the first being the transitional inputs by an activity and the second, the total value added that is generated by an activity
From Table 3, it is clear that the highest spending by lion breeders is on financial and business services. Therefore, the largest direct impacts are also in financial and business services (23.3%), manufacturing (28.1%), followed by construction (10.1%) and water and electricity (10.2%). Large indirect and induced impacts through the ‘backwards linkages’ are also experienced in the manufacturing sector, reflecting an indirect impact of R17.2 million and induced impact of R24.75 million. Agriculture (0.8%), personal and social services (2.6%) and mining (3.0%) recorded the lowest total impacts.
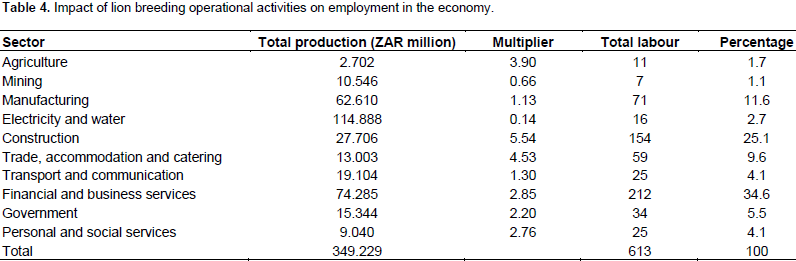
The aggregate multiplier can be derived by dividing the total impact by the direct impact. According to this calculation, the production multiplier is equal to R3.93, which signifies that every R1 spent by a lion breeder leads to an increase in production in the South African economy of R3.93.The impact of the private lion industry on labour income is illustrated in Table 4, reflecting the effects on labour. In the production process, labour is an important factor and considered to be the most variable short-run input, so that any increase in production normally creates a positive impact. Table 4 indicates the effect of the private lion breeding industry’s annual spending on job creation. The labour multiplier is derived from labour and output ratios and consequently illustrates the increase in the demand for labour due to an increase in production. Table 4 indicates that the private lion breeding industry is sustaining an additional 613 employees in the economy. This excludes workers who are working on the farms. Including such workers, a total of 1,162 jobs are sustained in the economy due to private lion breeding activities. Cadman (2009) indicated that 900 people are employed, and the current research showed more people are employed. The sectors most affected regarding job opportunities are financial and business services (34.6%), construction (25.1%), and the manufacturing sector (11.6%).


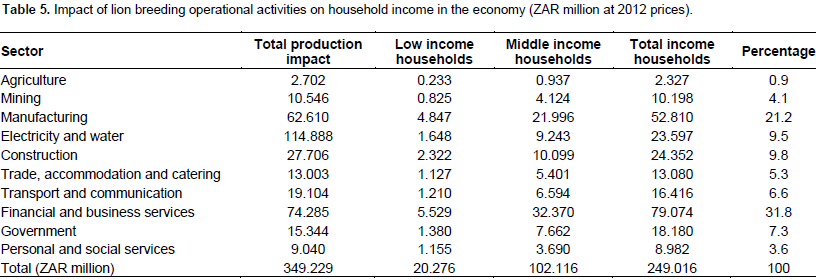
Household income
Using the SAM multiplier, it was possible to determine the impact of spending at the level of families’ income. To determine the impact, particular household income multipliers for each activity were calculated; these results were then multiplied by the values of the total sector’s impact using the household allocation, from which it is possible to derive the benefit that low-, middle- and high-income families derive from lion breeding activities. From Table 5 it is clear that low-income households benefit to the extent of R20.3 million from the private lion industry.Again, the total lion breeding industry’s operational spending per year is used; it is evident that this spending creates economic activities in some sectors, which leads to income for households working in that sector. In total, the R88 million spent by lion breeding creates an income of just more than R249 million for the economy. This excludes the salaries/wages paid by the average farmer, which amount to an additional R67.4 million per year for the industry, making the industry’s contribution to household income more than R316 million annually. The income multiplier is, therefore, R2.81, which means that for every R1 spent by a typical lion breeder, families earn up to R2.81 in the economy. The report by Cadman (2009) found that lion breeding contributes R78 million, including land. This research, therefore, found that lion breeding contributes more than that what was previously found, excluding land.

From the results of the research, the following discussions are presented. Firstly, the research highlights the profile of a typical lion breeder. The average age of product owners is 51 years of age, indicating that they have been in the industry for some time, since it takes time and money to develop infrastructure for lion breeding. A significant percentage (59%) of respondents is well educated, which supports the notion that breeding of wildlife has become a science, and therefore is crucial in safeguarding the industry. Lion breeders can be regarded as entrepreneurs, and these results give us the profile of entrepreneurs in this industry. It is clear that lion breeding operations are small to medium-sized enterprises and these entrepreneurs contribute to job creation and development in rural areas.
Secondly, the economic contribution of these breeding facilities from a regional economic development point of view is important as that these facilities are mainly situated in the rural provinces of South Africa (Free State, North West, Limpopo and Northern Cape) where there is a need for economic development and job creation since they are some of the poorest provinces. It is, therefore, important for local government to support these types of developments in rural areas. One example is streamlining legislation and regulations in the wildlife industry as they differ from province to province to improve entrepreneurial opportunities and by doing this stimulate needed economic growth.
Thirdly, spending by lion breeders impacts several sectors in the respective provincial economies and consequently on the national economy. The sectors that benefit most as indicated are business services, construction, and the manufacturing sector. If lion breeding is banned or ceased to exist, these sectors will be impacted on especially in rural areas. This will result in fewer employment opportunities and reduction in new entrepreneurs in the breeding of wildlife. To conclude, the study makes three contributions to current research; firstly, it was the first time that an investigation has focused on the breeders and the economic contribution they made, which is based on sound methodology; secondly, the research afforded greater insight into the world of lion breeding and who the breeders are (profile) and where they operate in South Africa; and thirdly, the research also contributes to conservation in South Africa, since the private lion industry does create healthy lion populations.
The author(s) have declared that there is no conflict of interest.
The authors would like to thank NRF (National Research Foundation) and South African Predators Association (SAPA) for assistance in conducting this research.
REFERENCES
|
Akkemik, KA (2012). Assessing the importance of international tourism for the Turkish economy: A social accounting matrix analysis. Tourism Manage 33(4):790-801.
Crossref
|
|
|
|
Bauer H, Van der Merwe S (2004). Inventory of free-ranging lions Panthera leo in Africa. Oryx, 38(1):26-31
Crossref
|
|
|
|
|
Bauer H, Nowell K, Packer C (2008). Panthera leo, IUCN 2010. IUCN red list of threatened species. Version 2010.4.
View. Accessed 28 March' 2016
|
|
|
|
|
Broomhall D (1993). The use of multipliers in economic impact estimates. West Lafayette, Ind.: Purdue University. Cooperative Extension Service.
|
|
|
|
|
Cadman M (2009). Lions in captivity and lion hunting in South Africa. A report commissioned by the national council of SPCA'S. Alberton South Africa.
|
|
|
|
|
Cameron MJ (2003). The relationship between input-output (IO) analysis, social accounting Matrixes (SAM) and computable general equilibrium (CGE) models in a nutshell. Pretoria: Global Insight Southern Africa. (Unpublished working paper.)
|
|
|
|
|
Cloete PC, Rossouw R (2014) The South African wildlife ranching sector: A social accounting matrix Leontief multiplier analysis. Acta Commercii, 14(1):1-10
Crossref
|
|
|
|
|
Cloete PC, Van der Merwe P, Saayman M (2015). Profitability of the game ranching industry in South Africa. 2nd ed. Caxton Publishers, Pretoria.
|
|
|
|
|
Creswell JW (2013). Research design: qualitative, quantitative and mixed methods approaches. 2nd ed. Sage Publications, California
|
|
|
|
|
Crompton JL (2006). Economic impact studies: Instruments for political shenanigans? J Travel Res 45(1):67-82.
Crossref
|
|
|
|
|
Du Plessis PC (1997). Benuttingsvorme in die wildbedryf: 'n bestuursrekeningkundige evaluering. PhD, North-West university.
|
|
|
|
|
Ecosystem Valuation (2015). Basic concepts of economic value.
View. Accessed: 03 March 2015.
|
|
|
|
|
Els J (2017). Determining the economic significance of the lion industry in the private wildlife tourism sector. Master's Dissertation, North-West University.
|
|
|
|
|
Funston PJ, Levendal M (2015). Biodiversity management plan for lion (Panthera Leo) in South Africa. Government Gazette, 2 December 2015.
|
|
|
|
|
Funston PJ (2008). Conservation and management of lions in southern Africa: Status, threats, utilization and the restoration option. In B. Croes, H.H. De Jongh, & H., Bauer, (Eds.). Management and conservation of large carnivores in West and Central Africa. Leiden: Institute of Environmental Sciences. Pp. 109-131.
|
|
|
|
|
Hartono D, Resosudarmo BP (2008). The economy-wide impact of controlling energy consumption in Indonesia: An analysis using a social accounting matrix framework. Energy Policy 36(4):1404-1419
Crossref
|
|
|
|
|
Harun M, Mat SHC, Jalil AZA (2012). Impact of foreign direct investment on income distribution in Malaysia: Social accounting matrix framework. Glob Rev Account Finance 3(1):32-42.
|
|
|
|
|
Hayward MW, Kerley GI, Adendorff J, Moolman LC, O'Brien J, Sholto-Douglas, A, Bissett C, Bean P, Fogarty A, Howarth D, Slater R, Kerley GIH (2007). The reintroduction of large carnivores to the Eastern Cape, South Africa: An assessment. Oryx 41(2):205-214.
Crossref
|
|
|
|
|
Higginbottom K (2004). Wildlife Tourism: impacts, management and planning. Altoona Vic: Common Ground.
|
|
|
|
|
Holloway I, Wheeler S (2002). Qualitative research in nursing. Blackwell, London.
|
|
|
|
|
Hunter LTB, Pretorius K, Carlisle LC, Rickelton M, Walker C, Slotow R, Skinner JD (2007). Restoring lions Panthera leo to Northern KwaZulu-Natal, South Africa: Short-term biological and technical success but equivocal long-term conservation. Oryx 41(1):196-204
Crossref
|
|
|
|
|
Jones S (2010). The economic contribution of tourism in Mozambique: Insights from a social accounting matrix. Dev. Southern Africa 27(5):679-696.
Crossref
|
|
|
|
|
Li J, Lian C (2010). An empirical study on relative income determination of tourism industries with social accounting matrix of Jiangsu Province, China in 2002. Tourism Hosp. Res. 10(3):219-233.
Crossref
|
|
|
|
|
Lincoln YS, Guba EG (1985). Naturalistic inquiry. Sage, California. Lindsey P, Alexander R, Balme G, Midlane N, Craig J (2012a) Possible relationships between the South African captive-bred lion hunting industry and the hunting and conservation of lions elsewhere in Africa. S. Afr. J. Wildlife Res. 42(1):11-22.
|
|
|
|
|
Lindsey PA, Balme GA, Booth VR, Midlane N (2012b). The significance of African lions for the financial viability of trophy hunting and the maintenance of wild land. PloS ONE, 7(1):e29332.
Crossref
|
|
|
|
|
Lindsey PA, Roulet PA, Romanach SS (2007). Economic and conservation significance of the trophy hunting industry in sub-Saharan Africa. Biol Conserv 134(4):455-469.
Crossref
|
|
|
|
|
Nieuwenhuis J (2007). Qualitative research designs and data gathering techniques. In K. Maree (Ed.). First steps in research. Van Schaik Publishers, Pretoria, pp. 70-97.
|
|
|
|
|
Nowell K, Jackson P (Eds) (1996). Wild cats, status survey and conservation action plan. Gland, Switzerland: IUCN. (IUCN Cat Specialist Group.)
View.Accessed: 22 March 2015.
|
|
|
|
|
Oosterhaven J, Fan T (2006). Impact of international tourism on the Chinese economy. Int J Tourism Res 8(5):347-354.
Crossref
|
|
|
|
|
Pal B, Pohit S, Roy J (2011). Impact of economic growth on climate change: an environmentally extended social accounting matrix (ESAM) based approach for India. (MPRA Paper no. 36540.)
View. Accessed: 16 May 2016.
|
|
|
|
|
Patton MQ (2002). Qualitative research and evaluation methods. 3rd ed. Sage, California.
|
|
|
|
|
Reeves M (2002). Measuring the economic and social impact of the arts: A review. London: Arts Council of England.
|
|
|
|
|
Rossouw R, Saayman M (2011). Assimilation of tourism satellite accounts and applied general equilibrium models to inform tourism policy analysis. Tourism Econ 17(4):753-783.
Crossref
|
|
|
|
|
Saayman M, Saayman A (2014). Who is willing to pay to see the Big 7? Tourism Econ 20(6):1181-1198.
Crossref
|
|
|
|
|
Saayman M, Van der Merwe P (2003). Determining the profile of tourists visiting Pretoria National Zoo. Potchefstroom, S.A.: Institute for Tourism and Leisure Studies.
|
|
|
|
|
Scriven L, Eloff T (2003). Markets derived from nature tourism in South Africa and KwaZulu-Natal. In B. Aylward & E. Lutz (Eds.). Nature tourism, conservation, and development in KwaZulu-Natal, South Africa. World Bank Publishers, Washington, pp. 247-324.
|
|
|
|
|
Seung CK, Waters EC (2009). Measuring the economic linkage of Alaska fisheries: A supply-driven social accounting matrix (SDSAM) approach. Fisheries Res. 97(1):17-23.
Crossref
|
|
|
|
|
Slotow R, Hunter LTB (2009). Reintroduction decisions taken at the incorrect social scale devalue their conservation contribution: The African lion in South Africa. In M.W. Hayward & M.J. Somers (Eds.), Reintroduction of Top-Order Predators. Wiley-Blackwell, Oxford. South Africa, pp. 41-73.
Crossref
|
|
|
|
|
South Africa (2015). National Environmental Management: Biodiversity Act, 2004 (Act no. 10 of 2004) biodiversity management plan for African lion (Panthera leo). (Government Notice no, 351). Government Gazette, 38706, 17 April.
|
|
|
|
|
South Africa (2015) National Environmental Management: Biodiversity Act, 2004 (Act no. 10 of 2004). Government Notice no, 897). Government Gazette, 39185, 10 Sept.
|
|
|
|
|
Van der Merwe P, Du Plessis L (2014). Game farm and hunting tourism. AFRICAN SUN MeDIA, Stellenbosch.
Crossref
|
|
|
|
|
Van der Merwe P, Saayman M, Krugell W (2007). The determinants of spending by biltong hunters. S. Afr. J. Econ. Manage Sci. 10(2):184-194.
Crossref
|
|
|
|
|
Van Hoven W (2005). Ecotourism and game ranching: why it works. (Paper delivered at the Ecotourism South Africa Confex at the Indaba Hotel Johannesburg South Africa on the 9-11 November 2005) Johannesburg (Unpublished).
|
|
|
|
|
Van Seventer D, Hartley F, Gabriel S, Davies R.H (2016). A 2012 Social Accounting Matrix (SAM) for South Africa (No. 2016/26). WIDER Working Paper.
|
|
|
|
|
Williams V, Newton D, Loveridge A, Macdonald D (2015). Bones of contention: An assessment of the South African trade in African Lion Panthera Leo bones and other body parts. Accessed: 15 August 2016.
|
|