Woody species are the major components of traditional agroforestry systems. These species vary across the different types of agroforestry practices in different parts of Ethiopia. This study was conducted to assess woody species across land use in three different sites around Jimma town, Southwest Ethiopia. A total of 100 plots were laid out on six transect lines with sample plot size of 25 m × 25 m for 20 plots of homegarden, 19 plots of coffee farm and 20 plot of grazing land, 40 m × 40 m for 24 plots of crop field and 10 m × 10 m for 17 plots of woodlots and were calculated in hectares. Species diversity, richness, evenness, density and frequency were analyzed between land uses types and sites. The result showed that a total of 60 woody species belonging to 34 families and 54 genera were identified from these three sites. Fabaceae was the most dominant family with 11 (18.3%) species followed by Euphorbiaceae family with 7 (11.7%) species. Out of the identified species, 53.3% were trees, 45% shrubs and 1.67% climbers. In terms of species diversity, grazing lands (3.1) were more diversified than homegardens (2.87), crop field (2.555), coffee farm (0.667) and woodlots (0.643) in the overall study sites. In terms of tree and shrubs density, woodlots were the most dense (9495 stems/ha). Generally, agroforestry systems are conserving several woody species diversity in their systems and woody species varied among land use types in the study area. Practices which aimed at maintaining these woody species should be encouraged and applied to support the conservation of these species in agroforestry systems.
Description of study site
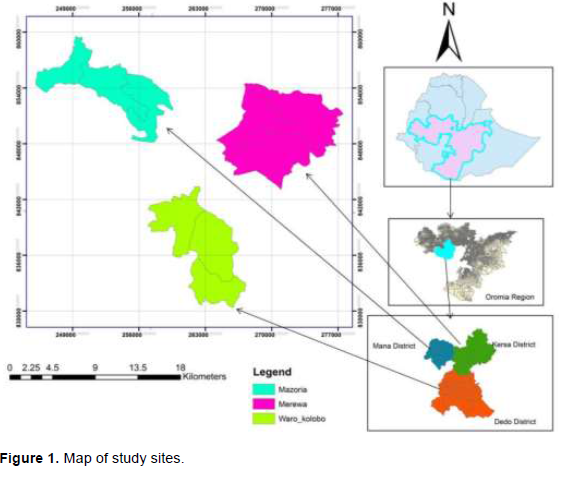
The study was conducted in Mazoria (Mana district), Merewa (Kersa district) and Waro-Kolobo (Dedo district) sites around Jimma town, Oromia National Regional State, Southwestern Ethiopia (Figure 1). Jimma zone is located in between 7°23' and 8°47' N and 35°52' and 37°30' E and its capital town is Jimma which is located 352 km away from Addis Ababa, the capital city of Ethiopia (BOFED, 2007). The study sites were found within 20 km radius around Jimma town in Mana, Kersa and Dedo districts with their altitudes of 1470-2610, 1740-2660 and 880-2400 m above sea level, respectively (BOFED, 2007). The annual rainfall of Jimma town ranges from 1138 to 1690 mm. The maximum precipitation takes place from the months of June to August, and minimum rainfall in December and January (Abebe et al., 2011). The total population of the study area is 43,486 (Male 22,538 and female 20,948) and the total household is 6671 (Mana WANRO, 2016; Kersa WANRO, 2016; Dedo WANRO, 2016).
Soil
Dystric Nitosol, Orthic Acrisols, Chromic and Pellic Vertisols are the major soil types found in Jimma zone (BOPED, 2000). The dominant soil types in Mana district are Dystric Nitosols and Orthic Acrisols, whereas Orthic Acrisols and Pellic Vertisols are dominant in Kersa and Dedo districts (BOPED, 2000).
Socio-economic activities
Agriculture is the means of the livelihood of the people. Most agricultural producers are subsistence farmers with small land sizes. The major crops grown in the area are maize, teff, sorghum, barley, pulses crops and coffee (BOPED, 2000). Coffee is the most important cash crop in the area (Zerihun et al., 2011). Also, cattle production is characterized mainly by traditional smallholders that are kept in freely-grazing communal rangelands throughout the year (Yisehak et al., 2013).
Data collection
In this study, both primary and secondary data sources were used. Secondary data were gathered from different sources like journal articles, district documents and regional documents to enrich literatures and knowledge gap.
Quantitative data were collected directly from field survey and field measurement. The primary data includes biophysical information (diameter at breast height (DBH), height and numbers of woody species) in different land use systems. Height and DBH of woody species were measured by using clinometers and diameter tape respectively. In this case, local names, number of all live individuals and DBH of all woody species with DBH ≥2.5 cm and height ≥2.5 m only were recorded. Trees and shrubs that are branched, along with the circumference was measured separately and average taken.
A total of 10 to 12 key informants (KIs) were selected from each Kebele. They were selected based on their knowledge and experience regarding the identification of woody species. Key informant interview and discussions were carried out at each study sites to obtained more information.
Local names of all woody species present in each site were recorded with the help of KIs and Development agents (Das). Species names were identified using specimen with the help of Useful Trees and Shrubs for Ethiopia (Azene, 2007) and the Honey bee Flora of Ethiopia (Fichtl and Admasu, 1994) at the field. Species that could not be identified in the field were collected, pressed and preserved following the criteria established by published volumes of the Flora of Ethiopia and Eritrea.
Sampling and sample size determination
Mazoria, Merewa and Waro-Kolobo sites were selected purposely to address the study objectives. Reconnaissance survey was carried out before actual survey and data collection using transect line within 20 km radius of Jimma town. It was done after consultation with expert from zonal office, districts agricultural office and development agents of study areas.
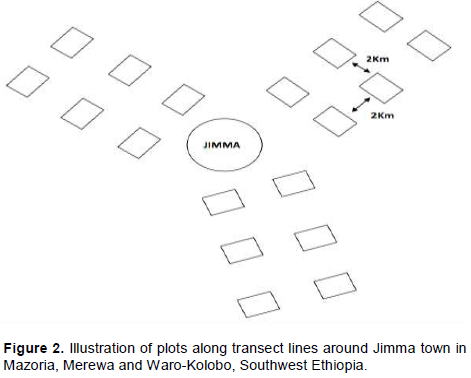
Two transect lines (total of 6 transect lines) were established in each study sites across different land use types. Systematic sampling method was applied to locate the sample plots to study woody species. The first sample plots were assigned randomly and the next sample plots were systematically allocated within 2 km intervals. Inventory of woody species were done using plots size of 25 m × 25 m (625 m2) for homegardens, coffee farms and pasture land in accordance with Egodawatta and Warnasooriya (2014), 40 m × 40 m (1600 m2) for crop field asper Nikiema (2005) and 10 m × 10 m plots size for woodlots following Feyera et al. (2002) (Figure 2). The assessment was carried out in every 2 km intervals with a total of 100 sample plots in six transect lines for all selected land use types. Two transect lines were laid out in each site with 20 plots of homegarden, 24 plots of crop field, 19 plots of coffee farm, 20 plot of grazing lands and 17 plots of woodlots along the transect lines.

Data analysis
The quantitative and qualitative approaches were used to analyze the data. All woody species present in each site were identified and grouped according to their habit and uses.
The population structure of all individuals ≥2.5 cm diameter and ≥2.5 m height woody species encountered in the field were grouped into diameter and height classes. Frequency tables and histograms were produced using the diameter and height classes versus the number of individuals categorized in each of the classes (Temesgen et al., 2015).
The collected data from the survey were entered into a computer (Microsoft Excel) and computed. The information was used to describe population structure, importance value index (IVI), height, frequency, Density, diameter at breast height (DBH) and basal area. DBH classes were categorized according to its thickness
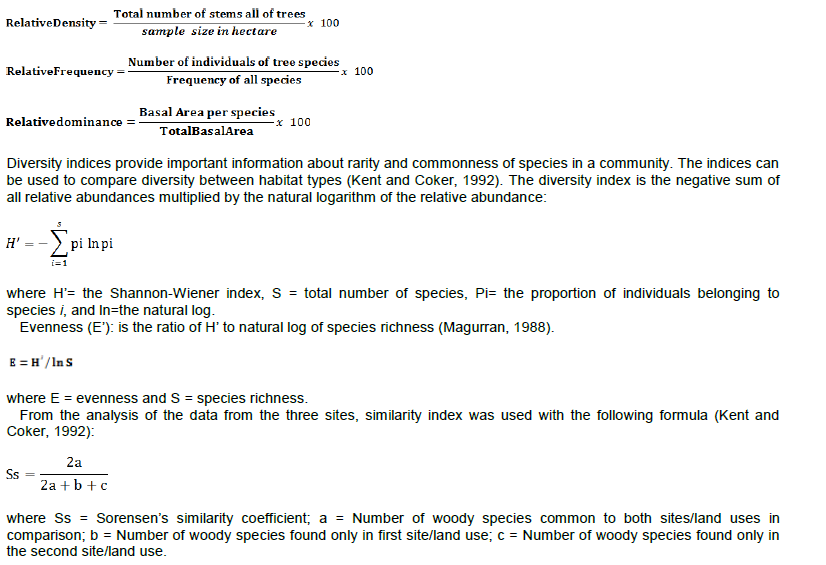
(Temesgen et al., 2015). DBH is the ratio of circumference to π. The basal area was calculated using the formula: BA = πd2/4, where d is diameter at breast height and π is 3.14. Density of the woody species was calculated by converting the total number of individuals of each woody species encountered in the plots to hectare.
Frequency is defined as the probability of chance of finding a species in a given sample area or quadrant (Kent and Coker, 1992). Thus, it shows the presence or absence of a given species within each sample plot.
Importance value indices were computed for all woody species based on their relative density (RD), relative dominance (RDO) and relative frequency (RF) to determine their dominance using the Kent and Coker (1992) formula:
IVI = Relative Frequency + Relative Density + Relative Dominance
Species diversity, richness and evenness
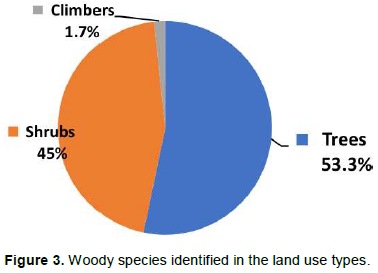
The results showed that a total of 60 woody species belonging to 34 families and 54 genera were identified in the three study sites. Among the identified woody species, 39 species were found in homegardens, 25 in crop fields, 33 in the grazing land, 34 in the coffee farm and 13 in the woodlots. Out of identified woody species 32 (53.3%) species were trees, 27 (45%) species were shrubs and 1(1.7%) species were climbers (Figure 3). This study indicated that the largest proportion of identified woody species were trees followed by shrubs in study sites. This study result is in line with the finding of Tefera et al. (2015), Mekonnen et al. (2014), Abiot and Gonfa (2015) and Motuma et al. (2008) who reported that the identified woody species were dominated by trees.
A total of 39 woody species recorded in homegarden were characterized by a higher numbers of woody species than other land use types. This study result is in line with the finding of Belay et al. (2014), Motuma et al. (2008) and Abiot and Gonfa (2015) who reported that higher number of woody plant species were present in homegardens than most of the other land use types.
A total of 25 woody species were identified from crop field of study sites. It was sparsely distributed in the field and relatively few as compared with homegarden, grazing land and coffee farm in terms of species richness
and individual numbers during inventory whereas higher than woodlots in species richness. In the study sites, the crop fields are owned by small-scale farmers who keep the woody species on their lands randomly in most cases. Woody species were different from site to site in the crop field. This study result is lower than similar study report of Motuma et al. (2008) in South-Central Ethiopia (32) and Tola et al. (2014) in Southern Ethiopia (49), and higher than the study result of Etefa and Raj (2013) in Tigray Region (15). This difference may be due to environmental factors.
In the study area, 33 woody plants species were identified and distributed as the small size of the patches of vegetation remaining in some part of the grazing land. This study result indicated lower number in which system of woody species were identified as compared with similar study reported by Mideksa et al. (2015) in South East Ethiopia and much higher than Belay et al. (2014) in Northern Ethiopia.
A total of 13 woody species were identified in woodlots of the three study sites. The number of species identified in this study was much lower than the result of Shiferaw and Pavlis (2012) in South Western Ethiopia (37) and Tyynelä (2001) in Northeastern Zimbabwe (39). This might be associated with the high relative density of Eucalyptus camaldulensis, Cupressus lusitanica and Grevillea robusta plantation. Light levels are positively associated with plant species richness and permanent open spaces in plantation forests provide an opportunity for enhancing biodiversity in the plantations (Georgie et al., 2007). Also, woodlots are characterized by dominant single species composition.
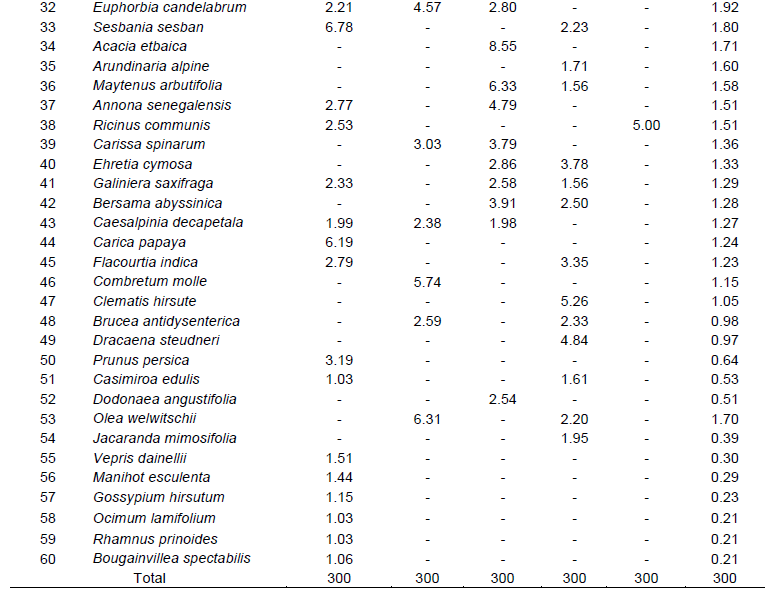
Species like E. camaldulensis, Ficus vasta, Croton macrostachyus, Albizia gummifera, Cordia africana, Millettia ferruginea, G. robusta, Acacia abyssinica, Ficus thonningii, Persea americana, C. lusitanica and Catha edulis are the top 12 dominant woody species in the study area.
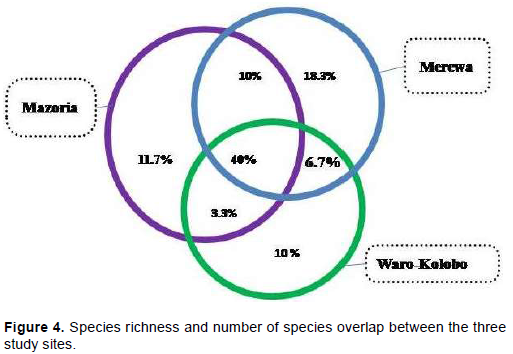
In terms of woody species distribution across sites, 24 (40%) of woody species are common to all sites, six species (10%) occurred only in Waro-Kolobo whereas seven (11.7%) and eleven (18.3%) species occurred only in Mazoria and Merewa sites, respectively. Again, six species (10%) were found in both Mazoria and Merewa, four (6.67%) species are common in Merewa and Waro-Kolobo, and only two species (3.3%) were found in Mazoria and Waro-Kolobo commonly (Figure 4).
The dominant families were Fabaceae represented by 18.3% of species, Euphorbiaceae 11.7% of total species, Moraceae, Myrtaceae and Rutaceae families each with 5% of total species, Asteraceae, Boraginaceae, Celastraceae and Rubiaceae families each with 3.3% of total species in the study area. The other remaining families (25) were represented by one species.
Fabaceae and Euphorbiaceae were the major woody species in the study area. This study result was in line with the report of Mesele et al. (2012) in south-eastern rift valley escarpment of Ethiopia, Balcha (2013) in Jimma, Belay et al. (2014) in northwestern Ethiopia and Bajigo and Tadesse (2015) in Gununo watershed at Wolayitta zone.
Species diversity of grazing land, homegarden, crop field, woodlots and coffee farm were 3.1, 2.87, 2.555, 0.667 and 0.643, respectively. The grazing land recorded highest species diversity than other land use system in overall study sites whereas species diversity of homegardens in each sites were higher than crop lands, coffee farm, woodlots and grazing land with the exception of Merewa site grazing land and Mazoria site crop field (Table 1). The observed trend might be due to the difference in land use types and functions of woody species. Woody species have various functions and purposes in different land use types. This result is in line with Chane et al. (2003) who reported that land use types determine the vegetation attribute of species.
The result indicated that the species diversity was higher in Merewa (H’= 2.58) followed by Mazoria (H’=2.32) and Waro-Kolobo (H’=2.48) and species evenness ranged between 0.773 and 0.788 in the homegarden agroforestry of study sites. It was lower in both species Shannon diversity and evenness than traditional agroforestry practice in Dellomenna District, Southeastern Ethiopia (Abiot and Gonfa, 2015) and higher than homegarden in Tigray region northern Ethiopia (Etefa and Raj, 2013).
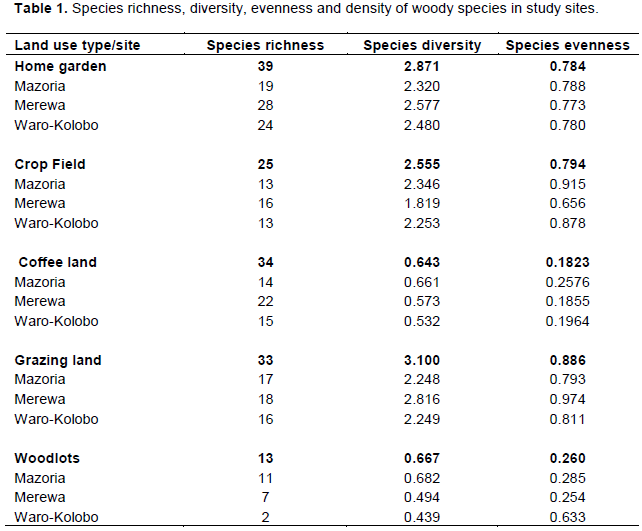
In crop land, the highest species diversity was recorded in Mazoria (H’=2.346) than Waro-Kolobo (H’=2.253) and Merewa (H’=1.819) sites and the evenness index of woody species ranged between 0.656 and 0.915 (Table 1). This result is similar to those of Mekonnen et al. (2014) who reported that the occurrences of species across crop field land use system of the study sites were variable. Shannon diversity index of woody species was more or less comparable with results reported by Motuma et al. (2008) in South-Central Ethiopia (H’= 2.22, E= 0.64). The result of Shannon diversity index and evenness was higher than the study result of Etefa and Raj (2013) in Tigray region, Ethiopia (H’= 1.12, E=0.41) and much higher than study result of Belay et al. (2014) in northern Ethiopia (H’=0.58, E=0.21).
The highest species were recorded in Merewa than in Mazoria and Waro-Kolobo sites; and evenness index of woody species ranged between 0.793 and 0.974 in the grazing land. The Shannon diversity index and evenness of this land use type were higher than similar results of Etefa and Raj (2013) in Tigray region, Ethiopia.
In coffee farm agroforestry, the highest species diversity was recorded in Mazoria than Merewa and Waro-Kolobo sites; and evenness index of woody species ranged between 0.186 and 0.258 (Table 1). The results show that single species dominated the coffee farm (Coffea arabica), less shade tree species number and not heterogeneous among species. This result is in line with the result of Bikila and Zebene (2016) who reported that due to intensive human interference, selective tree thinning shade tree species diversity are less in number and Belay et al. (2014) also reported low diversty occurring when single or few species dominated the area. The study result indicated lower Shannon diversity and evenness than study result of Dawoe et al. (2016) in West Africa and much lower than smallholder coffee farm (Getachew et al., 2014) in Southwest Ethiopia.
In woodlots, relatively higher levels of diversity were identified in Mazoria (0.682), followed by Merewa (0.494) and Waro-Kolobo (0.439). Woodlots composed of some woody species, and the diversity index was relatively lower in all sites than other land use types. The highest species number was recorded in Mazoria than Merewa and Waro-Kolobo sites.
Generally, this study showed that species richness, diversity and evenness varied with land use type and sites. Homegardens were more diversified followed by crop lands and grazing land in Waro-Kolobo site. Abreha and Gebrekidan (2014), Motuma et al. (2008) and Belay et al. (2014) reported that homegardens were more diversified than crop land and grazing land. Grazing land of Merewa was more diversified than other land use types. This result is in line with Abreha and Gebrekidan (2014) in Andabet Woreda and Etefa and Raj (2013) who reported that grazing land diversified than cropland and homegardens.
Key informants who participated in the discussion also reported that woody species cultivated in different land use types are more or less similar to the result obtained with the survey result. Farmers hang traditional beehives on larger trees in coffee farm, homegarden and grazing land. Key informants also articulated that woodlots of Eucalyptus increase onward due to a necessity of wood product (construction, fuel wood, etc), income and fast growing nature of the tree. This explanation is in agreement with Tola et al. (2014) who reported that the expansion of woodlots is due to increasing demand for various wood products.
Similarities index between sites
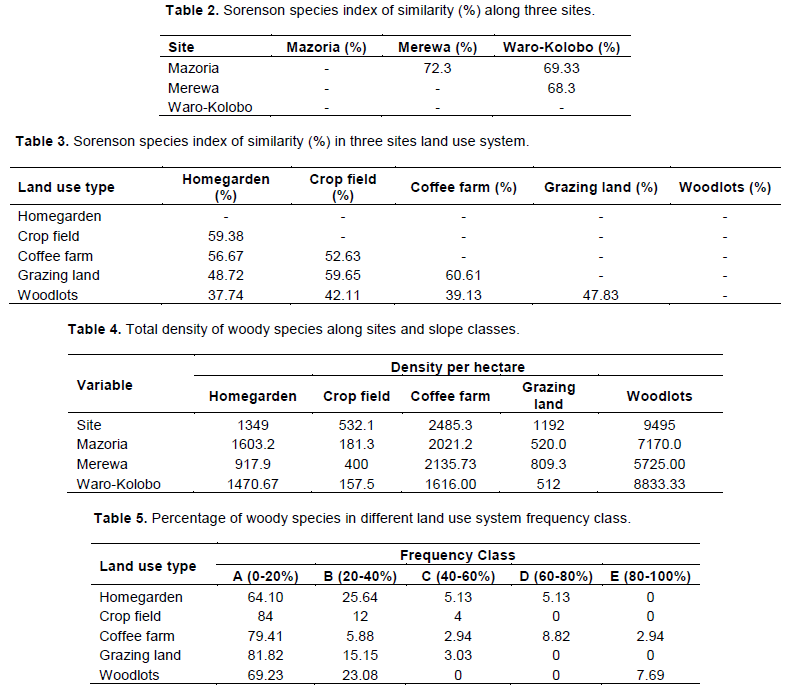
Sorenson’s index of similarity of Merewa and Mazoria sites showed the highest similarity (72.3%) followed by Mazoria and Waro-Kolobo sites (69.33%). Merewa and Waro-Kolobo sites had lowest similarity index (68.3%) as compared with other sites (Table 2). The similarity indexes of species showed the highest similarity (60.61%) between coffee farm and grazing land. Whereas woodlots and homegardens agroforestry systems had a lowest similarity index (37.74%) as compared with other agroforestry systems (Table 3).
Density
Comparatively, overall densities of woodlots were higher than other land use types followed by coffee farm and homegarden in all study sites (Table 4). Generally, in the homegarden agroforestry system of three study sites,
(E. camaldulensis, Erythrina brucei, Euphorbia tirucalli, C. lusitanica, G. robusta, C. arabica and P. americana) have the highest density (77 to 352 individuals per hectare) and other species were ranging from 16-72 individuals per hectare. During the vegetation survey, E. tirucalli had by far the highest density (269 individuals/ha) while others were much less dense, ranging from 6.25 to 25 individuals/ha in the crop field. C, arabica and Arundinaria alpine were densely populated (1401 and 224 individuals/ha, respectively) in the coffee farm agroforestry. In grazing land agroforestry system, C. lusitanica, Acacia mearnsii and G. robusta species were densely populated (144, 128 and 91 individuals/ha, respectively) and in woodlots, E. camaldulensis with 4250 individuals/ha and C. lusitanica with 2650 individuals/ha were much higher in density; while others also ranged between 100 and 600 individuals of woody species per hectare. Generally, E. camaldulensis were densely planted species in woodlots. Because E. camaldulensis is planted mostly with narrow spacing, E. brucei, E. tirucalli and Euphorbia cotinifolia species were commonly planted as a life fence for protection purposes.
The inventory results of this study also revealed that there was variation in woody species density across the land use of study sites. This result coincides with Aklilu et al. (2013) in terms of density in homegarden agroforestry; however, the density is higher in woodlots and farmland. The density of woody species in woodlots result was much higher than a similar study report of Shiferaw and Pavlis (2012) in South Western Ethiopia, Tyynelä (2001) in Northeastern Zimbabwe, and Abyot et al. (2014) in Gololcha District, Eastern Ethiopia (1845 stems/ha).
Frequency
Frequency was the number of plots in which a specific species occurred per the total plots number of land use in the study area. Species were grouped into A (0-20%), B (20-40%), C (40-60%), D (60-80%) and E (80-100%) frequency classes in each land use type. No species were recorded in D and E frequency class of crop field and grazing land and frequency class C and D in woodlots (Table 5).

The most frequently observed woody species in homegarden agroforestry system were P. americana and C. edulis (75 and 60%, respectively) in the overall study site. Whereas, P. americana (83.33%), Sesbania sesban (66.67%) and C. edulis (50%) were in the Mazoria site; P. americana (75%), C. edulis (75%), M. ferruginea (75%) and C. macrostachyus (62.50%) were in Merewa; and in Waro-Kolobo, P. americana (83.33%), Mangifera indica (83.33%), C. edulis (66.67%), C. arabica (66.67%) and A. abyssinica (50.00%) were the most frequented woody species in homegarden agroforestry system. Most of the species were frequently cited in another homegarden (Abreha and Gebrekidan, 2014; Ewuketu et al., 2014).
C. africana (41.67%) was observed in the overall sites of crop fields. A. gummifera (42.86%) in Mazoria, A. gummifera (50%) and C. africana (50%) in Merewa and C. africana (55.56%) were more frequently observed than other woody species. The least frequently observed woody species in class ‘C ’and most species (84%) fall between 0-20% (Class ‘A’) frequency class in this land use type than others.
The most frequently observed woody species were C. arabica (100%), C. macrostachyus (78.95%), A. gummifera (73.68%), C. africana (63.16%) and A. abyssinica (52.63%) in the study coffee farm agroforestry. E. camaldulensis was the most frequently observed species during the survey in woodlots around Jimma town. The frequency of E. camaldulensis was about 94.12% in the overall study sites, 100% in Mazoria and Merewa at each site and 85.71% at Waro-Kolobo site. Woodlots of study sites were dominated by single species, that is, E. camaldulensis and received relatively more special attention than other woody species in the study area. Tyynelä (2001) also reported that E. camaldulensis was found in all wood sample plots; and other species were found in 4.6 to 26% of the total plots number.
The result also indicated that higher percentage of woody species were frequently observed within the frequency classes ‘A’ in all land use systems (Table 5) which may be due to its greater economic or ecological value or social importance. This study results are in line with Abiot and Gonfa (2015) who reported that the frequency of tree species varied in different farms and Yirefu et al. (2016) reported that most of the trees and shrubs species were recorded in frequency class ‘A’ (61.5%).
Diameter at breast height (DBH) distribution
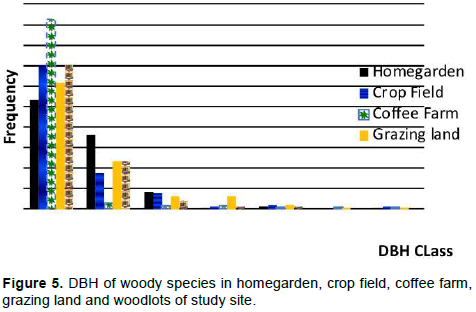
The distribution of woody species in different DBH classes was analyzed and classified into 6 classes: (1) 2.5-10 cm, (2) 10.1-20 cm, (3) 20.1-30 cm, (4) 30.1-50 cm, (5) 50.1-60 cm and (6) >60 cm. DBH class distribution of all individuals in different size classes showed an inverted J- shape in overall land use (Figure 5). The majority of the species had the highest number of individuals in the lowest DBH class distribution with gradual reduction toward high DBH classes. Out of the total woody species, 61.26, 26.50, 6.91 and 2.77% were distributed in the first, second, third and fourth diameter classes, respectively. Whereas about 2.56% of woody species identified in the study area were found under fifth and sixth diameter classes. This study result was similar with the results of Abyot et al. (2014), Temesgen et al. (2015) and Mohammed et al. (2015).
Importance value index (IVI)
The IVI of woody species recorded in each site and land use were estimated to evaluate the importance of each species. The IVI indicates the importance of individual woody species in the land use systems which were associated with farmers’ species preference and objectives. The interest of farmers for selection of species is linked with species market demand and service value.
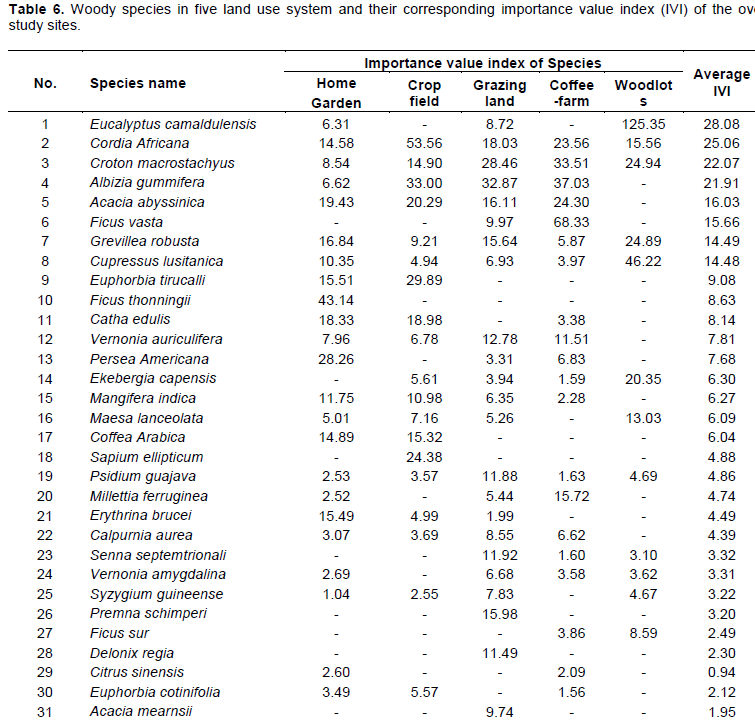
IVI is a composite index based on the relative measures of species frequency, abundance and dominance (Kent and Coker, 1992). The highest basal area of F. vasta, F. thonningii, M. ferruginea and A. gummifera made these species have a larger value of relative dominance (34.76, 9.75, 9.48 and 4.16%, respectively); and hence got the highest IVI in the overall study sites. E. camaldulensis (38.34%), G. robusta (6.05%), C. lusitanica (5.83%) and C. macrostachyus (4.19%) have higher relative density whereas C. macrostachyus (10%), A. gummifera (7.8%), C. africana (7.8%) and A. abyssinica (5.37%) have larger relative frequency values and contributed to the highest IVI. The current result agrees with Aklilu et al. (2013) who reported IVI value determined by density, frequency and basal area. Simon and Girma (2004) also revealed that species with the greatest importance values were the most dominant of particular vegetation.
The most abundant 10 plant species of each land use type were indicated in the report. Accordingly, P. americana, E. brucei, C. edulis, G. robusta, E. tirucalli, C. arabica, A. abyssinica, C. africana, M. indica and C. lusitanica were the ten top important species among the 39 woody species that were recorded in the homegarden agroforestry system of the study sites (Table 6). This finding is also in line with similar study report of Ewuketu et al. (2014) in Jabithenan district, Northwest Ethiopia
In the crop field, C. africana, A. gummifera, E. tirucalli, C. arabica, C. edulis, C. macrostachyus, A. abyssinica, G. robusta, Vernonia auriculifera and M. indica were the top ten important species among the 25 woody species that were recorded in crop field land use system of the study sites.
In the grazing land, woody species recorded were A. gummifera, C. macrostachyus, Senna septemtrionali, V. auriculifera, G. robusta, A. abyssinica, C. africana, A. mearnsii, F. vasta, Psidium guajava, Calpurnia aurea and Vernonia amygdalina were the top twelve important woody species in the study sites.
C. arabica, A. gummifera, A. abyssinica, C. macrostachyus, C. africana, F. vasta, M. ferruginea, V. auriculifera, P. americana and C. aurea were the most important woody species relatively in the coffee farm. Therefore, the species with higher IVI were most important for coffee shade and all woody species identified in study sites were distributed in the coffee farm for the purpose of shade. Bikila and Zebene (2016) stated that woody species with the highest IVI are C. arabica and other shade tree species.

Key informants also pointed out that A. gummifera, A. abyssinica and M. ferruginea species were the most preferred species as shade for coffee in their discussions. They stated that the leaves of these woody species are allowed an appropriate amount of light to reach the coffee and other undergrowth species due to leaf structure and size. Tola et al. (2014) also reported that small leaf tree species (A. gummifera, A. abyssinica and M. ferruginea) are most preferred for coffee shade. Small trees and shrubs were used for shade when farmers convert other land use and/or treeless field to coffee farm due to fast growing and soil fertility improvement. This justification also agrees with Tola et al. (2014) who reported that the fast-growing and shorter lived trees provide enough shade to the newly planted coffee until the preferred shade trees have grown big enough.
Most important woody species were E. camandulensis, C. lusitanica and G. robusta in woodlots. Number of species identified in this study was lower than the study result of Shiferaw and Pavlis (2012). The difference might be associated with the high relative density of E. camaldulensis plantation, C. lusitanica and G. robusta. E. camaldulensis was the dominant tree and accounts for most of the woody plants within the study area in woodlots.
Height of woody species in agroforestry system
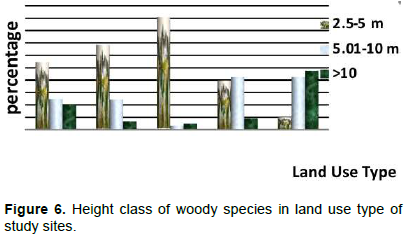
All individuals with ≥2.5 cm diameter at breast height and ≥2.5 m height woody species encountered from the fields were categorized into diameter and height classes. Based on height category, woody species was classified into three height classes in different land use type. Woody species individuals recorded in the study area were: (I) 2.5 to 5 m lower class height; (II) 5.01 to 10 m medium class height; and (III) ≥10 m upper class height woody species described as overall land use types and across each land use types with sites.
There was a higher frequency percentage of lower height class distribution of woody species in home-gardens, crop field and coffee farm. In case of coffee agroforestry practice, the system is covered by some individual numbers of woody species used for shade and higher coffee shrubs. Due to competition factors with the under growth plants, and use of tree parts in crop field and homegardens, the tree height was managed repeatedly. Most woody species cultivated in homegardens are fruit tree species and their heights are managed to collect fruits. Woodlots are purposely required for woody products and it is dominated by higher height woody plants in overall study sites (Figure 6).

This study result is in agreement with study report of Bikila and Zebene (2016) who reported that repeated management of trees height in homegardens and multi-use of tree species in the farmers’ field affects the height growth. Kufa and Burkhardt (2011) also reported that larger tree species, characterized by broad-leaved, dominated upper canopy; and coffee plants and small shrubs were found at the middle and lower height class.