ABSTRACT
The common eland is a highly adaptable species and can survive in landscapes where water is scarce. It is listed by International Union for Conservation of Nature (IUCN) as a species of “Least Concern” implying its population is considered to be relatively stable but due to environmental factors changes decline in some populations in range have been documented. In Kenya and Tanzania hunting, habitat loss and fragmentation are key factors contributing to eland population decline but this is exuberated by climate change and wildlife disease. Consequently, this study examined the population status, trend and distribution in the Tanzania-Kenya borderland which experienced a severe and long drought from 2007 to 2009. Eland was common in the entire study area but the Amboseli region had the highest number and density of elands (1,348.50 ± 729.10 individuals; 0.15 ± 0.08 individuals/km2), followed by Magadi -Namanga area (346.80 ± 220.10 individuals; 0.06 ± 0.03 individuals/km2), and the least was in West Kilimanjaro (70.80 ± 39.30 individuals; 0.02 ± 0.01 individuals/km2). In Amboseli and Lake Natron areas, eland density and distribution in landscapes changed more during the wet season; while in Magadi-Namanga and West Kilimanjaro, this was more during the dry season. West Kilimanjaro had the highest percentage increase in eland density (+1850.53) followed by Magadi-Namanga area (+667.76 ± 429.34), and lowest in Amboseli (+88.29 ± 6.19). After the year 2009, the eland population increased more during the wet season in most landscapes except in Lake Natron where they decreased in the dry season. Although the eland was affected by drought, it did not experience a huge decline in its population possibly because of its ecological and behavioral attributes that cushions it from the adverse drought effects.
Key words: borderland, Kenya, population trend and status, Tanzania, Common eland.
Abbreviation:
The Common eland Tragelaphus oryx is the largest antelope in Africa (Estes, 2012; Skinner and Chimimba, 2005), and are confined within sub-Saharan Africa with an estimated population of approximately 136,000 individuals as per 2008 (IUCN, 2008). East (1999) produced a total population estimate of 136,000, with stable/increasing national populations now confined to Namibia, Botswana, Zimbabwe, South Africa, Malawi, Kenya and Tanzania. Population trends vary from increasing to decreasing within individual protected areas, and are generally increasing on private land and decreasing in other areas. However, this population is far much less compared to estimates of the 1970s (over half a million then), but the IUCN has listed it as a species of “Least Concern” (IUCN, 2008).
The species inhabits diverse habitat types including Acacia savanna, alpine moorlands of up to 4,900 m above sea level, sub-deserts and Miombo woodlands (IUCN, 2008), and this is attributed to their ability to use a variety of food resources and to survival with little or no water (Skinner and Chimimba, 2005). They also use open plains but avoid dense vegetation types like forests (Pappas, 2002), and are mostly browsers, and feed on foliage but also other food items like seeds, tubers, succulent fruits and flowers (Skinner and Chimimba, 2005). During the wet season, they are likely to graze but tend to forage on high quality newly sprouted grasses (Pappas, 2002), but generally, they tend to select food based on its fiber content which is a function of the leaf stem ratio (Owen-Smith, 2002). Unlike most of the closest relatives, the common eland is quite nomadic and extremely gregarious and can form large herds of up to 500 individuals but are no-territorial (Estes, 2012; Pappas, 2002; La Grange, 2006).
In Kenya, the eland is still common in its former range (southern, central and northwestern) but the population is decreasing (East, 1999), and major populations are located outside protected areas in Kajiado, Narok and Laikipia where their numbers are considered to be stable. The largest protected area population was found inside and around Tsavo National Parks but declined rapidly from approximately 9,960 animals in 1991 to 760 in 1997, due to drought, rinder pest and increasing competition for food resources from livestock (East, 1999). Smaller but protected populations occur in areas like Meru, Nairobi, Amboseli and Aberdare National Parks (East, 1999). Some studies have shown a decline in the common eland population is some parts of the country such as in the Maasai-Mara ecosystem where over 76% decline between 1977 and 1997 (Ottichilo et al., 2000), and in the Athi-Kaputei ecosystem between 2006 and 2011 (Ogutu et al., 2013). These studies attribute this decline to a combination of factors such as land use changes, habitat loss and fragmentation, drought and forage completion with livestock. In Tanzania, the species is still common in savanna woodlands and grasslands especially in the Serengeti National Park, Katavi, Ruaha-Rungwa and Selous-Kilombero (East, 1999). Nevertheless, it has rapidly declined or disappeared in the small sized protected areas like Biharamulo Game Reserve and Ngorongoro Crater due to increased environment degradation and the insular effects created by such small protected areas on such a highly mobile species with a large home range requirement (East, 1999).
Throughout their range, the common eland faces numerous threats all of which have contributed to reduction in their population. Hunting and habitat loss due to expanding human settlements and infrastructure development are considered to be major contributors to this decline (East, 1999; Ottichilo et al., 2000; IUCN, 2008; Ogutu et al., 2013). The species is also prone to a variety of diseases including; foot-and-mouth, tuberculosis and roundworms (Bothma et al., 2002), and these can negatively affect their population performance. Climate variability especially prevalence of droughts is a major factor responsible for abrupt extermination of large populations of animal over wide areas (Ottichilo et al., 2000; Ogutu et al. 2013). For instance, in Kenya’s rangelands, the 2000 severe drought caused high mortality and decline in the population of large herbivores (wildlife and livestock) including a shift in their normal distribution pattern (Ogutu et al., 2013). Ecologically, drought leads to reduction in availability of forage and water resources which in turn become limiting factors to wildlife and livestock due to starvation. Although the Common eland can survive without frequent access to water because they can obtain enough moisture from their food (Estes, 2012; IUCN, 2008), its survival is still at risk due to increased mortality during droughts (Pappas, 2002; Skinner and Chimimba, 2005). The ongoing land use and land tenure changes, increase in human population and the resultant development in the Northern Tanzania and Southern Kenya borderland are likely to compound the threat posed by climate change to the Common eland population.
Between 2007 and 2009, the Southern Kenya and Northern Tanzania borderland experienced a severe drought which saw both wildlife and livestock die in large numbers. This study was therefore conducted in the wet and dry seasons of 2010 and 2013 to evaluate the population status and distribution of the Common eland in the region. Specific objectives were to 1) Determine the population status and trend of Common eland in the borderland; 2) assess spatial-temporal distribution of Common eland in the Kenya-Tanzania borderland; 3) make recommendations to enhance monitoring and conservation of wildlife populations across the borderland.
Study area
The Southern Kenya region comprises of Amboseli National Park, adjoining Maasai group ranches and private lands in the Oloitokitok area along the Kenya-Tanzania border, Namanga, Magadi and Nguruman in the southern part of Kajiado County approximately 8797 Km2, (Figure 1). On the Tanzania side, it is made up of the Natron and West Kilimanjaro landscapes, and the entire borderland covers an area of >25,000 Km2. The region has in the recent past experienced a rapid increase in human population particularly in the group ranches and along the slopes of Mt. Kilimanjaro (Ntiati, 2002; Reid et al., 2004; Okello and D’Amour, 2008). Further, it has also experienced widespread land use changes over the past
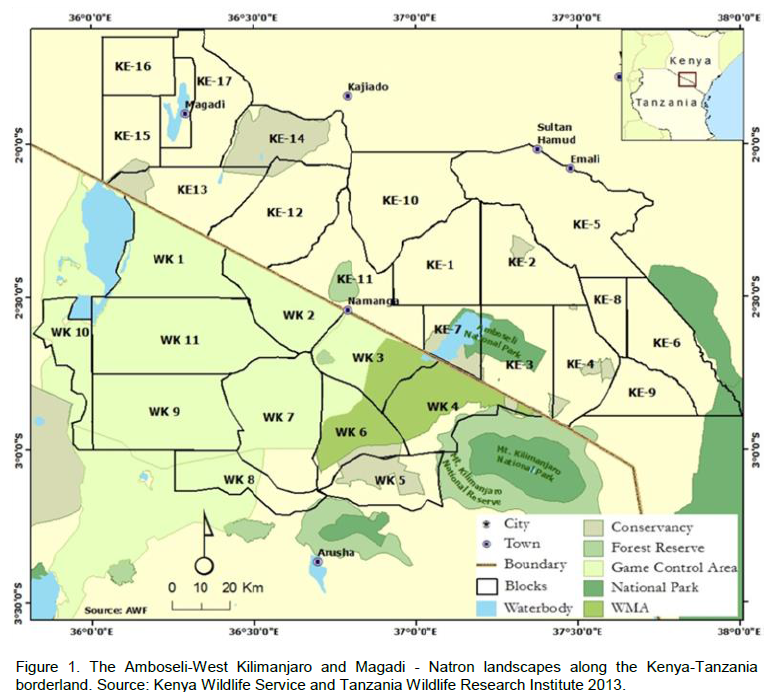
30 years in response to a variety of economic, cultural, political, institutional, and demographic processes (Reid et al., 2004). Pastoralism is mostly practiced by the predominantly Maasai people in the borderland has continued to decline forcing the community to turn to farming like other ethnic groups (Ntiati, 2002; Okello, 2005; Okello and D’Amour, 2008).
Most of the Amboseli region is classified as ecological zone VI and is characterized by a semi-arid environment, with most of it being suitable for pastoralism and wildlife conservation (Pratt and Gwynne, 1977). It has a bimodal rainfall pattern but the average annual rainfall is quite low ranging between 400 to 1000 mm (Reid et al., 2004). The long rains are normally received at the beginning of the year (between March and May) while the short rains occur at the end of the year (end of October and mid-December) (Western, 1975; Okello and D’Amour, 2008). Thus, rainfall is the key deter-minant of land use practices in the entire region (Ntiati, 2002; Okello, 2005). Surface water availability is sparse and the hydrology is mostly influenced by Mt. Kilimanjaro. Generally, vegetation of the region is typical of a semi-arid environment, with some of the dominant vegetation communities being; open grasslands, Acacia dominated bushland and the forest belt of Mt. Kilimanjaro, interspersed with patches of swamps-edge grasslands, Acacia woodlands and swamps (Croze and Lindsay, 2011).
The Namanga-Magadi covers an area of > 5, 000 Km2 most of which comprise of Maasai group ranches (Figure 1). Like other parts of the borderland, it is a semi-arid environment with little rainfall of between 400 - 600 mm, which is bimodal and highly variable and these conditions make it suitable for wildlife conservation and pastoralism (Kioko, 2008). In a few areas, mostly along the Maili-Tisa-Namanga road, the main rivers and Ewaso Nyiro, the locals usually carry out limited irrigated agriculture. There is spatial-temporal variation in vegetation types in response to variation in the landscape and elevation. Due to the semi-arid nature of the region, the soils are poorly developed but are mainly “black clayey” (grumosolic soils) comprising of a variety of “black cotton” soils including the calcareous and non-calcareous variants. Ewaso Nyiro River is the main water sources although there are several seasonal rivers like the Namanga, Ol Kejuado and Esokota.
Lake Natron area lies west of the West Kilimanjaro area, and its northern part is defined by the Tanzania-Kenya border, with a total area of approximately 7,047 Km2), (Figure 1). It’s largely a semiarid savannah interspersed with open acacia woodlands (Acacia spp. and Commiphora spp.). The southern boundary extends from the southeast corner of Ngorongoro Conservation Area eastward to the northwest corner of Arusha National Park, while the western part is situated along the eastern side of Lake Natron to Ngorongoro Conservation area. Similar to other landscapes of the borderland, rainfall is low (<350mm/year), and is highly variable and largely unpredictable. The vegetation types are very diverse and therefore provide expansive livestock grazing land.
The West Kilimanjaro is found in the Longido District, and its northern sector lies along the Kenya-Tanzania border from Namanga southeastward to Irkaswa covering >3000 Km2 (Figure 1). Annual rainfall varies depending on the elevation, with the semi-arid lower elevations receiving 341 mm/year and lower elevations on Mt. Kilimanjaro at Mt. Meru and Monduli in the south receiving part 890 mm/year (Moss, 2001). Nevertheless, it is generally variable and unpredictable. In terms of vegetation, the region has a complex and heterogeneous vegetation community with extensive swathes of farming and grazing lands. The dominant inhabitants are the Maasai people who have over the years tuned into agro-pastoralists. Numerous wildlife conservation areas are found in the region like Kilimanjaro National Park (755 Km2), Arusha N. P (137 Km2, Longido Game Controlled Area (GCA) (1,700 Km2) and Ngasurai Open Area (544 Km2).
Methods and analysis
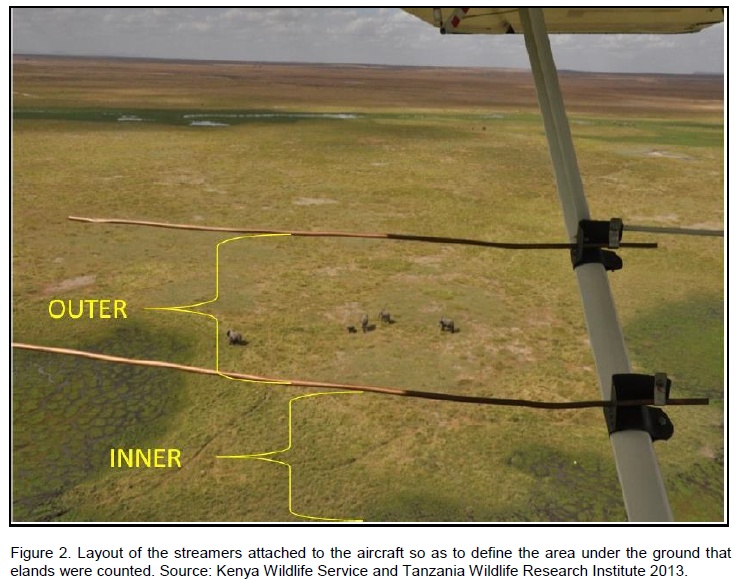
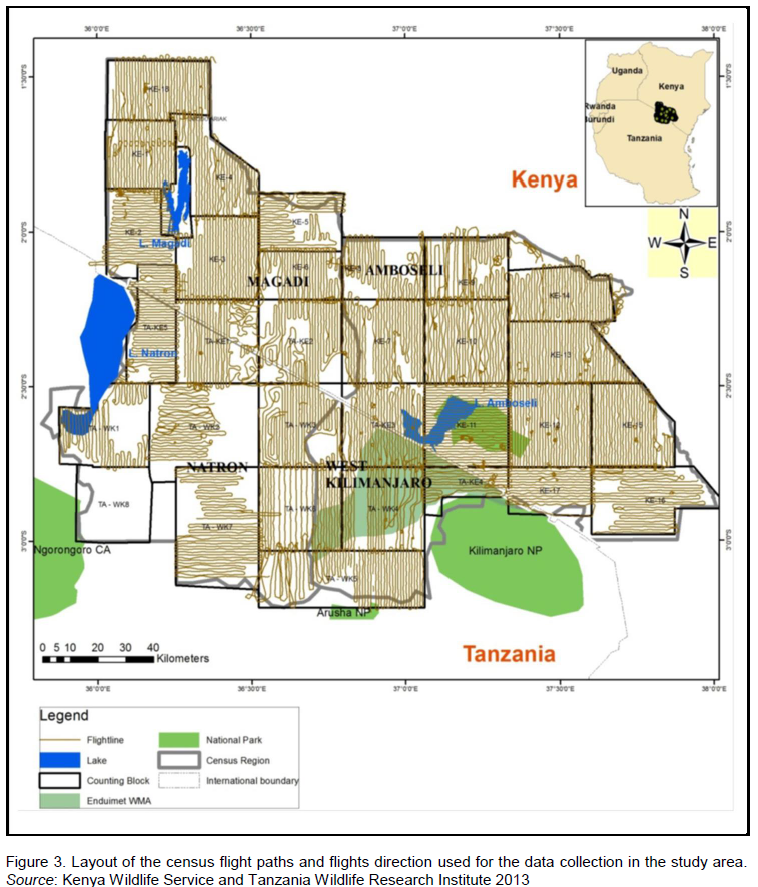
Eleven (11) and seventeen (17) blocks were delineated on the Tanzania and Kenya side respectively (Figure 1) in which trained wildlife biologists carried out a total aerial count of the Common eland in the wet (March) and dry (October) season of 2010 and 2013 (May, wet season and October, dry season) as described by Norton-Griffiths (1978). Aircrafts used in the counts were fitted with steamers on either side of the wings (Figure 2), and the field of vision of the streamers calibrated using mock flights as outlined by Ottichilo and Sinange (1985). Experienced and well trained flights rear observers then counted the number of Common eland appearing between the rods of the streamers (Dirschl et al., 1981) along 5 Km transect segments. The width of the count transects varied from 1-2 Km, with a North to South orientation and East to West direction depending on the degree of ground visibility and nature of the terrain (Figure 3). The average speed of the aircraft was 156 Kmph, and at a mean elevation of 383.8 ± 251ft above the ground. A single day was taken to cover the area with several aircrafts covering a single block so that it was accomplished in a single survey.

During the flight, the observers recorded the count data on tape recorders and data sheets. The coordinates of all the elands observed were taken using a GPS and in instances whenever more than ten individuals were encountered in a group, a photograph was taken and their correct tally verified later. A DNR-Garmin/Map Source software was used to download the GPS coordinates after which spatial distribution maps were created using ArcGIS 9.2 program. Statistical Package for Social Sciences (SPSS, 2011) version 20.0 (SPSS Inc., Chicago, Illinois, USA) was used to spartially analyze the data collected.
Population changes of the common eland were calculated using density estimates of 2013 and how they varied from 2010 for each season. Using the SPPS software, Chi – square goodness of fit and Chi – square cross – tabulations tests were also used to establish any differences and associations between eland numbers (across seasons and years) among various landscapes in the borderland region (Zar, 1999). For each test, Statistical tests were considered significant if type 1 error (alpha) was less than 5% (0.05) (Zar, 1999). Given that the census areas (for both wet and dry season) for 2010 and 2013 was the same, comparisons of the total numbers, density and percentages (proportions) of eland were considered appropriate.
Common eland was well represented in all the landscapes and ecosystems (protected areas and dispersal areas) along the Kenya – Tanzania borderland during the 2010 and 2013 censuses. Amboseli and its surrounding group ranches had the highest number of eland (Table 1) in the borderland (averaging 1,348.5 ± 729.1 eland), followed by a distant Magadi / Namanga area (346.8 ± 220.1 eland), Lake Natron area (210.3 ± 139.0 eland), and lastly West Kilimanjaro area (70.8 ± 39.3 eland).
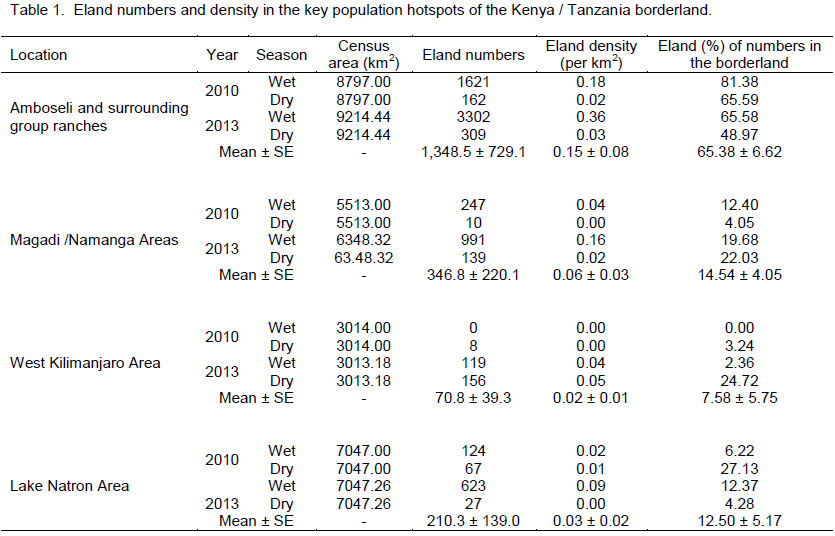
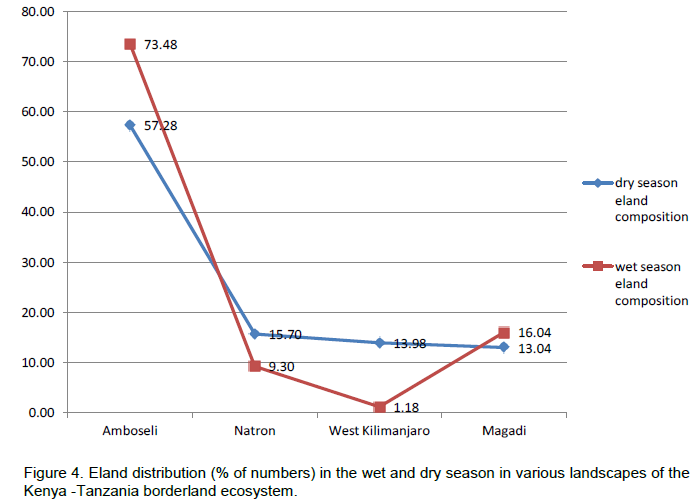
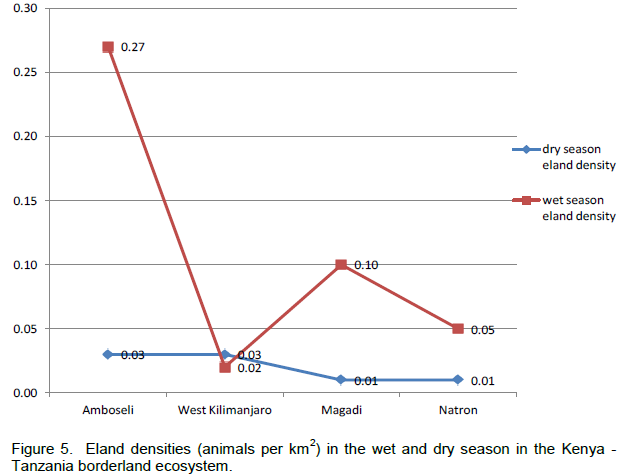
In terms of the distribution of elands in the landscapes, eland in each area of the borderland (Figure 4), similar order was seen, with Amboseli and surrounding group ranches leading (65.38 ± 6.62%) followed by Magadi / Namanga area (14.54 ± 4.05%), Lake Natron area (12.50 ± 3.86%), and lastly West Kilimanjaro (5.57 ± 2.60%). For eland density (Figure 5), Amboseli area had also the highest eland density (Table 1) averaging 0.15 ± 0.08 eland (per km2), followed by Magadi / Namanga area (0.06 ± 0.03 eland per km2), Lake Natron area (0.03 ± 0.02 eland per km2), and lastly West Kilimanjaro area (0.02 ± 0.01 eland per km2).
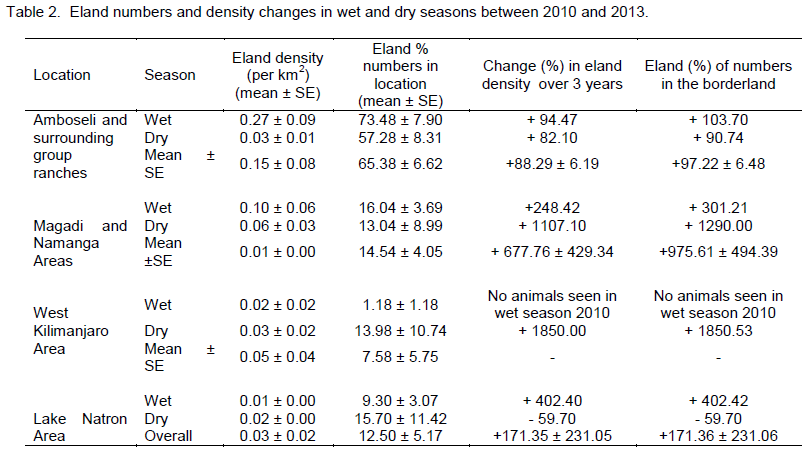
Considering (percent) changes in the density in each of the locations of the borderland between 2010 and 2013, West Kilimanjaro area had the highest positive average percent change (increase) in eland density (+1850.00 (which occurred in the dry season) compared to other locations in the borderland (Table 2). The positive growth in eland density was also seen in Magadi / Namanga area (+667.76 ± 429.34). The next positive increase in density occurred in Lake Natron area (+171.35 ± 231.05), but with high variability in the change because of negative growth in the dry season. Amboseli and surrounding group ranches had the lowest change in eland density (+88.29 ± 6.19) but without any negative (decline) change in eland numbers. All the changes in each season were positive for all locations (except dry season in Lake Natron area) implying a general increase in the eland density over time (Table 2).

each of the locations of the borderland, West Kilimanjaro area had also the highest positive (percent) change (increase) in eland numbers (+1850.53 (which occurred in the dry season) compared to other locations in the borderland (Table 2). The positive growth in eland number was next seen in Magadi / Namanga area (+975.61 ± 494.39). The next positive increase in eland numbers occurred in Lake Natron area (+171.36 ± 231.06), but with high variability in the change because of negative growth in the dry season. Amboseli and surrounding group ranches had also the lowest change in eland numbers (+97.22 ± 6.48) but without any negative (decline) change in eland numbers. All the changes in each season were positive for all locations (except dry season in Lake Natron area) implying a general increase in the eland numbers over time (Table 2).
There were more changes in eland density and composition in the wet season in Amboseli and Lake Natron areas, but more changes in the dry season in West Kilimanjaro and Magadi areas. The highest change differences in both density and composition were in West Kilimanjaro, Magadi, Lake Natron area and lastly Amboseli area. A decline (negative change) in eland density and numbers was only seen in the dry season and only in the Lake Natron area (Table 2).
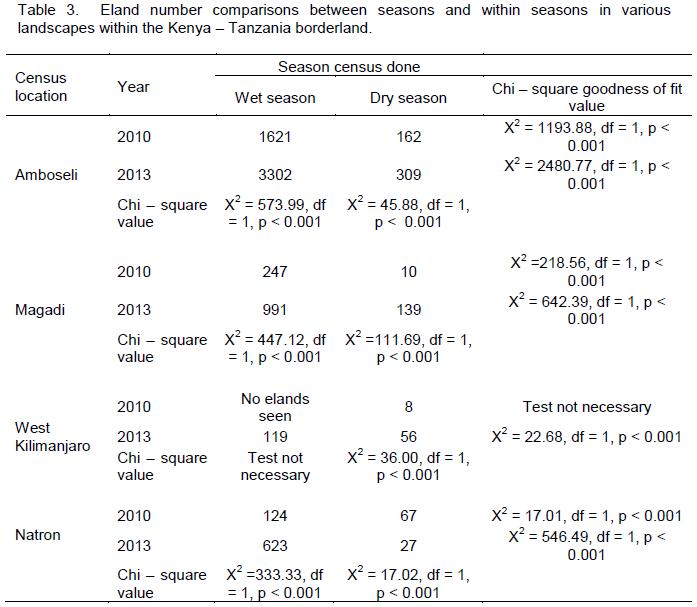
For Amboseli area, both 2010 and 2013, wet season number was higher (p < 0.001) than dry season number (Table 3). Further, eland numbers were increasing over time with both wet and dry season of 2013 higher (p < 0.001 in both cases) than for 2010 (that is eland number increased with time). For Magadi / Namanga area, both 2010 and 2013 wet season number was higher (p < 0.001) than dry season number. Further, eland numbers increased over time with both wet and dry season of 2013 higher (p < 0.001 in both cases) than for 2010 (Table 3).
For West Kilimanjaro area, elands were seen only in the dry season of 2010 and not the wet season of 2010. However, for 2013, wet season number was higher (p < 0.001) than dry season number (Table 3). Further, eland numbers increased over time with wet and dry season of 2013 being higher (p < 0.001 in both cases) than for 2010 (Table 3).
For Lake Natron area both, 2010 and 2013 wet season number was higher (p < 0.001) than dry season number (Table 3). For the set of wet season, eland number was higher (p < 0.001) in 2013 than 2010 (eland number was increasing with time in the wet season). However, for the set of dry season, eland number declined, with dry season of 2010 numbers being higher (p < 0.001) than in 2013 (Table 3).
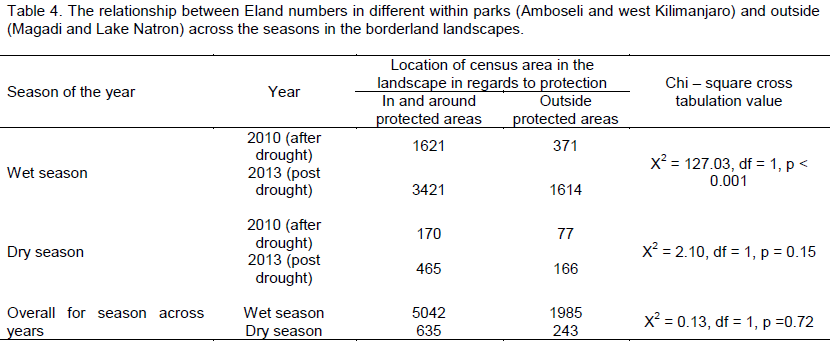
In terms of relationships between eland numbers in different locations, influence of seasons on eland numbers varied among the locations in the borderland depending on whether they were inside and round protected area (Amboseli and West Kilimanjaro) or entirely in the dispersal areas away from protected areas (Lake Magadi and Lake Natron) (Table 4). In general, eland population number in the different landscapes was independent (Χ2 = 0.13, df = 1, p = 0.72) of the season, with numbers across various landscapes being similar across seasons. Specifically, in the wet season, eland number in various landscapes was dependent (p < 0.001) on year, with numbers increasing with time. However, in the dry season, eland numbers in various landscapes was independent (p = 0.15) of year, with numbers remaining similar over time.
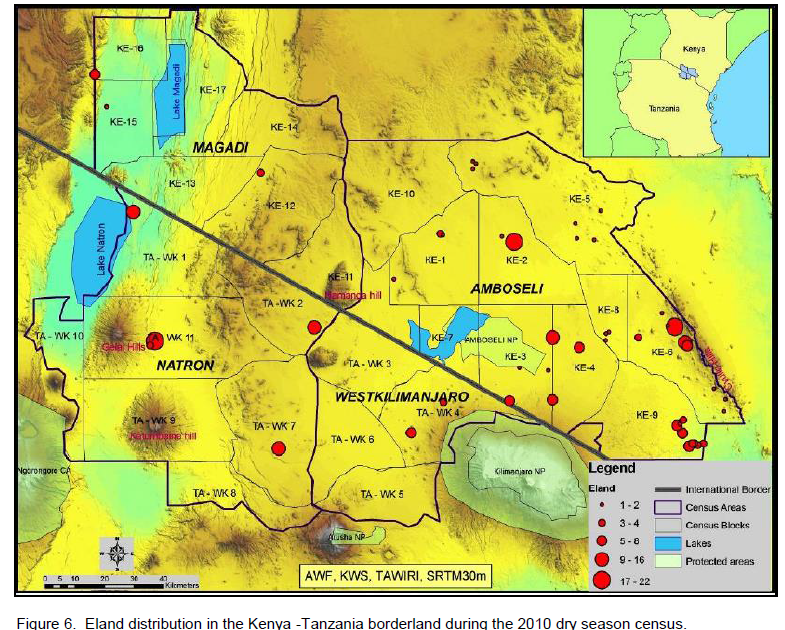
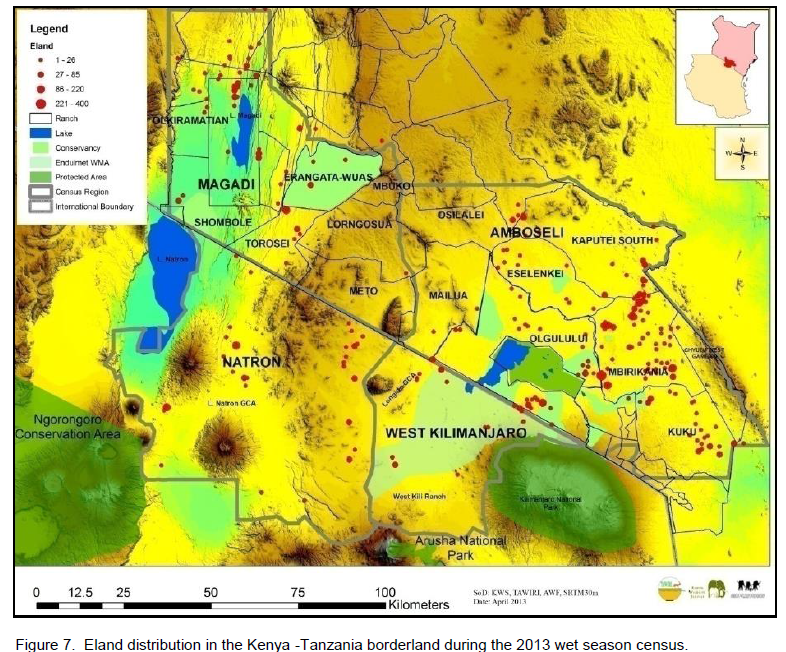
The Common eland is relatively well represented both in distribution and numbers in the borderland, but with all other species from census in Amboseli, West Kilimanjaro, Lake Natron and Magadi / Magadi area, the bulk of the species is in the Amboseli Ecosystem (Okello et al., 2015a, b). This, as with the conservation of other large mammals in these areas of the borderland, Amboseli area remains a very important hub for their conservation, and likely a source of dispersing individuals to the other ecosystems in the borderland. However, the distribution showed clumped nature in the locations where the eland was found. This is not unusual and is consistent with the social and grouping behavior of the elands. Elands can form very large herds than most bovids, with an example of about 500 individuals in one place in the Serengeti (Estes, 2012). Since eland density overall is often less than 1 eland per km2, their distribution can be unusually clumped, but this also depends on habitat quality and season (East, 1999). However, the clumped distribution in small areas in the borderland can likely serious general decline in these species due isolation, but this eventuality is corrected for by the highly mobile nature of the elands, allowing it to reach other groups and mate.
Even though the bulk of the elands were found in Amboseli, other locations (led by Magadi / Namanga, Natron and West Kilimanjaro respectively) had eland presence. This indicates that these ecosystems are still important habitats and ranging lands for the elands on the borderland. But more important is when you examine the rate of density and number changes over time and across seasons. Amboseli had the least positive (growth) change in the number and density of elands, possibly because it had many elands already, and may be reaching a potential carrying capacity for eland given that it shares that range with a host of other wild herbivores and livestock. Natron, with a negative (decline) growth in eland numbers and density in the dry season, could have had its eland population dying of natural mortality, poached, or illegally or simply moved to other locations (most likely because of their high mobility and adaptable nature). But the fact that high positive changes occurred, the three other landscapes other than Amboseli area (West Kilimanjaro and Magadi / Namanga areas in particular) points the fact that elands may have moved in (colonized this area) or multiplied. This implies that these areas are important range for elands, and that they can be colonized by eland populations (moving from elsewhere such as Amboseli) and with a potential to build its own sizeable and viable eland populations. Elands increased with time and generally had higher wet season numbers than dry season numbers in several locations except in Lake Natron where they decreased with time in the dry season. Further, even though there were no elands in West Kilimanjaro in wet season (March) 2010, they were present in later in subsequent counts implying they moved out during the drought in search of better forage and water, but moved back (recolonized) the area after the droughts (dry season October 2010). Eland numbers in locations were independent of season, and numbers were similar near and inside protected areas as with landscapes further that were not protected areas. This may seem odd as we expect that generally it will be higher inside and near protected areas; and also that herbivore numbers will depend on season in which numbers will increase in the wet than dry season. These can be explained by the high mobility, highly adaptable foraging behavior and ability for elands to go for long without drinking water (Estes, 2012).
Both frequent and long distance movements as well as mixed feeding (on grass and leaves) afford them the ability to move long areas searching for forage and water and hence they will be less confined by the seasons and its influence on distribution of forage and water. Therefore, elands are able to escape the limitations of the dry season and droughts and minimize mortality and impacts on its population size through this movements and adaptive foraging strategies. This could also explain why elands in the borderland have maintained quite good population size following the droughts of 2007 and 2009 which greatly increased dry season mortality and reduced population numbers of other herbivores in the borderland.
The eland is one of the most adaptable antelopes (Estes, 2012). It moves long distances utilizing resource in broad habitat use such as in acacia open lands as well as in woodlands and bushlands, but avoiding dense forests (Estes, 2012). In the dry season, they range widely seeking fresh forage (leaves and green grass) but also fruits, pods, seeds, herbs and tubers as an adaptable selective mixed feeder (Estes, 2012). This broad and extremely varied diet allows it to achieve its high tolerance of habitats types and make it one of the most adaptable mixed feeders. As it moves, it seeks to conserve water through both behavioral and through body metabolism process. When water becomes very scarce, elands allow their body temperatures to rise as high as 7°C above the body temperature during the day in anticipation of cooler night time to cool them again. Their large body size keeps the temperatures from rising much faster than it would do in other similarly adopted species like Oryx and gazelle, and hence allow them to store more heat and release it when temperatures cool in evenings or night time, by feeding more at night and late in the morning, and by seeking shade in the heat of the day. This reduces water loss by evaporative cooling (Estes, 2012; Estes, 2012, East, 1999).
The number of elands in and around protected areas and in unprotected landscapes was independent of the year (time) in the dry season, but was dependent on year (time) in the wet season. This relationship is also affected by the ability of elands to be adaptable on forage, stay for long without drinking free running water, and long movements it makes over the landscapes. We generally expect that eland numbers will increase in any location in the wet season because of plenty of forage and water, and that these conditions may also lead to new births which may coincide with this plentiful of resources necessary for its survival. Indeed mating and birth for elands occur most of the year, but definite peaks in births occur late in the dry season and early in the rainy season (Estes, 2012; East, 1999). We therefore expect, with new births (and immigrations if necessary) increase in eland populations over time, but specifically during the wet season. This explains why eland numbers were dependent on time (year) in the wet season because of the enhanced reproduction and hence new individuals in the population. For the dry season, eland numbers will be independent because eland will move from one place to another, sometimes in long distances as they seek suitable forage and water consistent with its adaptability and mobility abilities.
The finding that eland population was increasing with time after the 2007 and 2009 droughts mean that they were on the way to full recovery in the borderland. But even though this is positive population trend, it is likely that this buildup will remain localized to suitable habitats and where these species are safe from impacts of people such as human encroachment, poaching by bushmeat and habitat destruction. Management attention should be focused on Lake Natron and Magadi / Namanga areas of the borderland because they had lowest numbers and recovery rate of these species. With increasing eland numbers in the wet season, and with time, there is great potential and opportunity to get the numbers build up again and become viable populations in all landscapes that form the borderland Meta - population.
Lastly, the safety of eland and other large mammal species in the borderland is critical for allowing for re - colonization of the space where wildlife large mammals in the borderland can again live after the droughts. Reduced conflicts with wild herbivores over damages (may be due to crop raiding and in some cases competition for water, pasture and space), and threats (such as bush meat poaching) and habitat destruction will lead to a steady large herbivore decline in the borderland. We need to establish what other human - induced mortality has led to a decline of these four species and take remedial action. In this regard, continued cross border collaborative management and population monitoring (between Kenya and Tanzania) is very essential. Further, joint effort in ground population monitoring and undertaking anti – poaching that allow positive population growth and dispersal of large wild mammals in the borderland landscape will enhance the new legal obligations of countries in cross border conservation collaboration in East Africa.
The authors did not declare any conflict of interest.
REFERENCES
|
Bothma JP, Van Rooyen N, DuToit JG (2002). Antelope and other smaller herbivores. In: J du P Bothma (ed.), Game range management, fourth edition. Van Schaik Publishers, Pretoria, South Africa. pp. 226-228.
|
|
|
|
East R (1999). African antelope database 1998. IUCN/SSC Antelope Specialist Group. IUCN Species Survival Commission Occasional Paper No 21. IUCN, Gland, Switzerland and Cambridge, UK. Pp. 434.
|
|
|
|
|
Estes RD (2012). The behaviour guide to African mammals; including hoofed mammals, carnivores and primates. The University of California Press
|
|
|
|
|
Croze H, Lindsay WK (2011). Amboseli ecosystem context: past and present. In: Moss, C. J., Croze, H. and Lee,. P C. (eds.), The Amboseli elephants; a long-term perspective on a long-lived mammal. The University of Chicago Press, Chicago and London. Pp. 11-28
Crossref
|
|
|
|
|
Dirschl H, Norton-Griffiths M, Wetmore SP (1981). Training Observers for Aerial Surveys of Herbivores. Wildlife Society Bulletin 9: 108 - 119.
|
|
|
|
|
International Union for Nature Conservation (IUCN) (2008). IUCN SSC Antelope Specialist Group. Tragelaphus oryx. The IUCN Red List of Threatened Species. Version 2014.2. www.iucnredlist.org. (Accessed on 23/10/2014).
|
|
|
|
|
Kioko J (2008). Natural resource conservation and livelihood options: the proposed illeng'arunyani conservancy in Mailua group ranch, Kajiado district, Kenya, African Conservation Center Report.
|
|
|
|
|
La Grange M (2006). The capture, care and management of wildlife. Van Schaik Publishers, Pretoria, South Africa. Pp. 152-181.
|
|
|
|
|
Moss CJ (2001). The demography of an African elephant (Loxodonta africana) population in Amboseli. J. Zool. 255: 145-156.
Crossref
|
|
|
|
|
Norton–Griffiths (1978). Counting animals. Handbook 1, 2nd edition, Nairobi, Kenya. African Wildlife Foundation. Nairobi, Kenya.
|
|
|
|
|
Ntiati, P. (2002). Group ranches subdivision study in Loitokitok division of Kajiado District. Land Use Change Impacts and Dynamics (LUCID) Working Paper 7, Intl. Livestock Res. Institute (ILRI), Nairobi.
|
|
|
|
|
Ogutu J, Owen-Smith N, Piepho H, Said M, Kifugo S, Reid R, Gichohi H, Kahumbu P, Andanje S (2013). Changing wildlife populations in Nairobi National Park and adjoining Athi-Kaputiei Plains: collapse of the migratory wildebeest. Open Conserv. Biol. J. 7: 11-26.
Crossref
|
|
|
|
|
Okello MM (2005). Land use changes and human-wildlife conflict in the Amboseli Area, Kenya. Human Dimensions of Wildlife 10: 19-28.
Crossref
|
|
|
|
|
Okello MM, D'Amour DE (2008). Agricultural expansion within Kimana electric fences and implications for natural resource conservation around Amboseli National Park, Kenya. J. Arid
Crossref
|
|
|
|
|
Okello MM, Kenana L, Maliti H, Kiringe JW, Kanga E, Warinwa F, Bakari S, Gichohi N, Ndambuki S, Kija S, Sitati N, Kimutai D, Mwita M, Muteti D, Muruthi, P (2015)a. Population Status and Trend of Water Dependent Grazers (Buffalo and Waterbuck) in the Kenya-Tanzania Borderland. Nat. Res. 6:91-114
Crossref
|
|
|
|
|
Okello MM, Kenana L, Maliti H, Kiringe JW, Kanga E, Warinwa F, Bakari S, Ndambuki S, Kija H, Sitati S, Kimutai K, Gichohi N, Muteti D, Muruthi P, Mwita M (2015)b. Population Status and Trend of the Maasai Giraffe in the Mid Kenya-Tanzania Borderland. Nat. Res 6:159-173.
|
|
|
|
|
Ottichilo WK, Sinange RK (1985). Differences in the Visual and Photographic Measurements in the Estimation of Strip Widths for Aerial Censuses of Animal Populations. DRSRS, Ministry of Planning and National Development, Nairobi.
|
|
|
|
|
Ottichilo WK, de Leeuw J, Skidmore AK, Prins HHT, Said MY (2000). Population trends of large non-migratory wild herbivores and livestock in the Maasai Mara ecosystem, Kenya, between 1977 and 1997. Afri. J. Ecol. 38:202-216.
Crossref
|
|
|
|
|
Owen-Smith RN (2002). Adaptive herbivore ecology: from resources to populations in variable environments. Cambridge University Press, Cambridge. Pp. xi and 374.
Crossref
|
|
|
|
|
Pappas LA (2002). Taurotragus oryx. Mammalian Species 689:1-5.
Crossref
|
|
|
|
|
Pratt DJ, Gwynne MD (1977). Rangeland management and ecology in East Africa. Hodder and Stoughton, London, England.
|
|
|
|
|
Reid R, Gachimbi L, Worden J, Wangui E, Mathai S, Campbell D, Maitima J, Butt B, Gichohi H, Ogol E. (2004). Linkages between changes in land use, biodiversity and land degradation in the Loitokitok area of Kenya. Land Use Change Impacts and Dynamics (LUCID) Working Paper Series 49. pp. 1-29.
|
|
|
|
|
Skinner JD, Chimimba CT (2005). The mammals of the Southern African sub-region. Cambridge University Press, Cambridge. Pp. xxv and 814.
Crossref
|
|
|
|
|
Statistical Package for Social Scientists (SPSS) (2011). Statistics for Windows, Version 20.0. IBM Corp., Armonk.
|
|
|
|
|
Western D (1975). Water availability and its influence on the structure and dynamics of a savannah large mammal community. East Afri. Wildlife J. 13:265-285.
|
|
|
|
|
Zar JH (1999). Biostatistical analysis 4th edition. Prentice Hall. Upper Saddle River, New Jersey.
|
|