Lack of knowledge of genetic variation within cocoyam germplasm limits its effective utilization in developing ideotypes with desirable traits for various end-uses. An agro-phenotypic characterization study was therefore conducted at the Njala Agricultural Research Centre (NARC) experimental site, Sierra Leone. The aim of the study was to evaluate the level of diversity within cocoyam germplasm using factor, cluster and minimum spanning tree analyses. A total of 27 genotypes were grown in a randomized complete block design with three replications in 2013 and 2014. Forty-two agro-morphological traits measured from the genotypes were analyzed using factor analysis (FA), hierarchical cluster analysis (HCA) and minimum spanning tree (MST). Above ground, biotic stress, underground storage organ and quality traits were useful in discriminating within and between species studied. Factor analysis loaded six factors which explained 77.5% of the total agro-phenotypic variation in the dependence structure. Other factors (>6) explained the rest of the genetic variation and may not be important in cocoyam breeding programme. The dendrogram of the HCA, based on the agro-morphological traits, showed four major groups, which supports the MST and FA. This study demonstrated wide agro-phenotypic variation among cocoyam germplasm which implied their utilization in breeding program. Findings are also useful for conservation planning of cocoyam. However, further biochemical or molecular studies are needed to complement and confirm the current agro-morphological variation.
Cocoyam is an important herbaceous perennial tuber staple of about 400 million people in the world (Lebot, 2009). It belongs to the Araceae family and consists of more than 1000 species (Ivancic et al., 2003). However, the two most economically important species of the edible aroids are taro (Colocasia esculenta) and tannia (Xanthosoma sagittifolium) (Janseens, 2001). It is widely cultivated in tropical and subtropical regions of the world. Cocoyam is the fifth widely grown root and tuber crop after cassava, potato, sweet potato and yam with diverse food, feed and industrial applications (Perez, 2010; Ndabikunze et al., 2011). Cocoyams are traditionally propagated using corms or cormels.
This asexual reproduction technique results in genetically uniform clones. Sexual propagation is utilized to generate improved cultivars in genetically diverse populations (Wilson, 1980). Some of the constraints limiting progress in the crop’s development include rare natural flowering, fruiting and seed setting (Mboubda et al., 2007), lack of improved genotypes and sufficient healthy planting materials (Onokpise et al., 1999) and high yield losses of up to 90% due to high infection of vegetative propagules (Onokpise et al., 1999; Mboubda et al., 2007). However, in non-flowering genotypes, sexual propagation is enhanced through application of giberellic acid (Wilson, 1980).
The world production of cocoyam is estimated at 11.8 million tons per annum (Vishnu et al., 2012), produced from about 2 million hectares with mean yield of 6.0 t.ha-1 (Singh et al., 2012). Small holder production systems in developing countries account for most of the global cocoyam production that utilizes minimum external resource input (Singh et al., 2012). Despite its importance, the average yield is far below the potential yield ranging from 30 to 60 t.ha-1 (Lebot, 2009). In Sierra Leone, the level of phenotypic diversity and genotypic performance of local varieties of cocoyam is unknown. This is partly due to research neglect of the crop in many regions of the world including Sierra Leone (Paul et al., 2012). The dearth of knowledge also indicates the need to explore the possibly vast and largely untapped potential of useful existing diversity within underutilized crops (Akwee et al., 2015a).
It is generally believed that crop diversity has been considerably maintained in traditional agro-ecosystems and through sustainable dynamic evolutionary processes (Kehlenbeck and Maass, 2004; Tamiru et al., 2006). Moreover, human knowledge that shaped diversity for generations is also preserved (Bellon, 1991). The key players involved in crop evolution include genetic diversity, farmers’ knowledge and selection and exchange of crop varieties (Brush, 2000). Genetic diversity is the amount of genetic variation among individuals of a genotype, species or population, which provides adaptability to erratic environmental conditions and the potential to develop new genotypes (Brown, 2000). Farmers often treasure diversity in crops wrought by factors of heterogeneous environment and production, risk, market demand and supply, which affect how different products are utilized (Bellon, 1996). This is evident in farmers’ decisions about which cultivar to grow belonging to similar or different species. Such preferences in the development and utilization of traditional varieties or landraces have influenced specific and intra-specific diversity in crops (Tamiru et al., 2006).
Evaluation of genetic diversity between individuals within a species or between different species or populations is imperative in crop improvement program for selection of genetically diverse parental lines to obtain superior recombinants (Kithinji, 2012; Akwee et al., 2015b). The process saves storage space and makes selection by plant breeders simple. Selection of genotypes by phenotypic traits has contributed to the domestication of plants with desired traits that meet farmers’ demands (Gepts, 2004). The traditional technique used for the measurement of diversity depends on the ability to resolve differences in morphological traits (Karp et al., 1996). Agro-morphological characterization of collected cocoyam germplasm will enhance the detection of desired traits, identification of duplicate accessions and structuring of population for conservation (Reed et al., 2004). The aim of this study was therefore to evaluate the level of diversity within collected cocoyam germplasm using various multivariate tools for conservation of core collections and utilization of genotypes with desirable traits in the cocoyam improvement programme.
Germplasm collection and conservation
Twenty seven genotypes of cocoyam comprising 25 genotypes of X. sagittifolium, one genotype of C. esculenta and one genotype of Alocasia macrorhizza were collected from various locations in Sierra Leone by Njala Agricultural Research Centre (NARC) scientists between late December and January 2012. Details on genotypes and their collection sites are presented in Table 1. Thirty to 40 corms of each genotype were collected and assigned an accession number and maintained in a cool shady nursery environment.
Experimental site
The experiment was conducted at Njala Agricultural Research Centre (NARC) during 2013 and 2014 cropping seasons. Njala is situated between latitude 80°6' N and longitude 12°06' W with an elevation of 50 m above sea level. The soils at the trial site belong to the Njala series (orthoxic palehumult) that is largely gravely clay-loam texture, slightly acidic with pH ranging between 5.5 and 6.0, and of predominantly secondary bush vegetation (MAFFS/NARCC, 2005). The total rainfall, mean monthly relative humidity and mean monthly minimum and maximum air temperatures recorded during 2013 cropping season were 2567.0 mm, 74.6%, 21.3 and 31.1°C, respectively. In 2014, the total rainfall, mean monthly relative humidity and mean monthly minimum and maximum air temperatures were 2616.6 mm, 76.9%, 21.5 and 31.2°C, respectively.
Experimental layout, design and planting
The experiment was first ploughed, laid out in a randomized complete block design (RCBD) with three replicates and mounded prior to planting. During each year, pre-sprouted corms from the nursery were carefully removed in mid-May using hand trowel; dead roots and leaves were removed, and injured parts dusted with wood-ash prior to planting. The treated pre-sprouted corms were then planted on the crest of mounds spaced 1 × 1 m between and within rows giving a population of 10,000 plants.ha-1.


Data collection and analysis
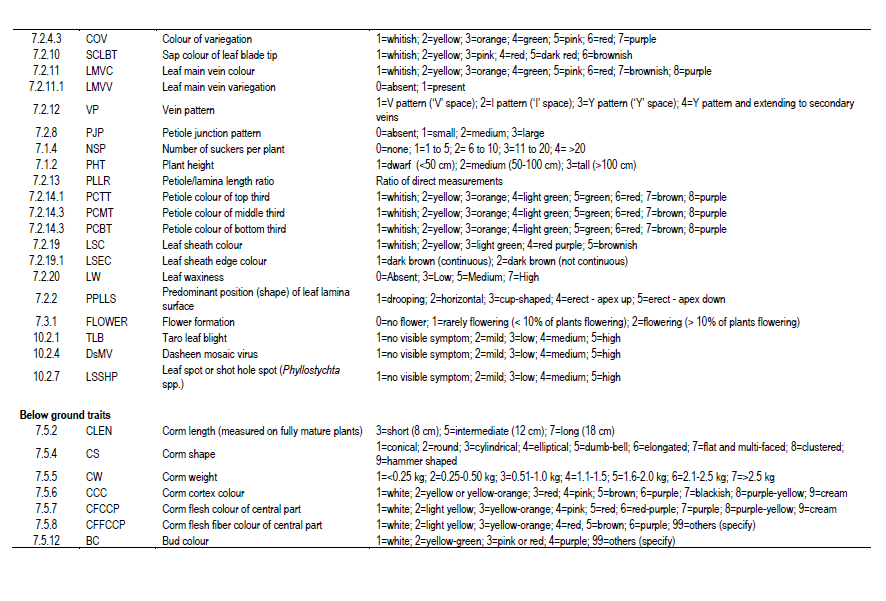
A total of 42 characters were collected according to the International Plant Genetic Resources Institute (IPGRI) Taro descriptor with slight modification (IPGRI, 1999) (Table 2). Of the 42 traits, 29 above ground parameters were evaluated between 3 to 6 months after planting. Prior to the above ground data collection, five plants were randomly selected and tagged at one month after planting. Multivariate analysis of the 27 × 42 data matrix comprising of PCA, FA, HCA and MST was performed in GENSTAT 15th edition statistical programme (Release 15.1, Lawes Agricultural Trust, Rothamsted Experimental Station, Harpenden, UK, 2012). In the PCA, eigen-values and load coefficient values were generated from the data set. The 42 agro-morphological traits (X-variables) assessed were rank transformed before using to compute the principal component scores in order to obtain uniform residuals (Norman et al., 2014). In the FA, eigen-values and load coefficient values were generated from the data set.
The principal components (PCs) that had eigen-values > 2.3 were selected, and those traits that had load coefficient values > 0.25 were considered as relevant scores for the FA, which significantly contributed to distinguish between the genotypes (Jeffers, 1967; Norman et al., 2014). For cluster analysis, rank transformed data matrix was used to generate pair-wise genetic similarity values among accessions, that is, the Euclidean dissimilarity coefficient, and then used to generate a hierarchical dendrogram through an unweighted pair-group method average (UPGMA) (Sokal and Michener, 1958). This analysis was used to study patterns of variance and relationships among accessions, where accessions with close genetic distances were placed in close proximity in the dendrogram. The Euclidean minimum spanning tree is a spanning tree of a graph with edge weights corresponding to the Euclidean distance between vertices which are points in the plane or space. Given a connected graph G = (V, E) with real-valued edge weights ce, minimum spanning tree (MST) is a subset of the edges T Í E such that T is a spanning tree whose sum of edge weights is minimized. This principle was used to augment cluster analysis (CA) in describing the spread and genetic distances among genotypes of the various species studied.


Morphological variation within studied accessions
The variation in gross morphology of above and underground traits of representative genotypes of the species studied is presented in Figure 1. Of the 27 genotypes studied, two genotypes with S. Nos. 26 and 27 had peltate leaf shape; and 25 had sagittate leaf shape. The predominant position of leaf lamina surface of the various accessions were: genotype MOSLCOY026-13 of C. esculenta had drooping leaves, genotype MOSLCOY027-13 of A. macrorhizza had horizontal leaves, while the remaining genotypes belonging to X. sagittifolium comprised of nine members with cup-shape (S. Nos. 9, 15, 24, 10, 21, 18, 17, 11 and 14) and 16 genotypes had erect apex-down. Five genotypes (S. Nos. 9, 7, 27, 25 and 8) exhibited wide (>100 cm) plant span, and the remaining had a medium (50 to 100 cm) plant span.
Twelve genotypes (S. Nos. 3, 4, 2, 5, 6, 12, 13, 21, 23, 16, 20 and 22) were dwarfs (<50 cm), while the remaining 15 were medium in height (50 to 100 cm). Leaf main vein variegation was present in 11 genotypes (S. Nos. 1, 3, 4, 8, 10, 12, 13, 19, 26, 21 and 22) and absent in 16 genotypes. Leaf main vain colour was green in 10 genotypes (S. Nos. 3, 4, 6, 12, 14, 23, 22, 19, 25 and 27), 17 genotypes exhibited yellow main veins. The vein pattern of leaves was of two kinds: genotype MOSLCOY026-13 exhibited y-pattern extending to secondary veins whereas the 26 other genotypes had y-pattern veins. The type of variegation varied from mottle(S. No. 27); stripe (genotypes with S. Nos. 9, 10, 11, 15, 17, 18, 20, 26, 21 and 24); and the other 16 had no variegation. The colour of variegation varied from whitish (genotypes with S. Nos. 9, 10, 11, 20, 15, 21 and 24), yellow (genotype MOSLCOY027-13), to green (genotypes with S. Nos. 17, 18 and 26); and the remaining had no colour variegation. Petiole junction pattern and petiole junction colour were absent in all genotypes, except, MOSLCOY026-13, which exhibited medium and light green, respectively. The sap colour of leaf blade tip was milky (whitish) for all genotypes, except, MOSLCOY026-13, which had brownish sap. All genotypes did not flower during both years, except, MOSLCOY027-13.
The variation within storage cormel shapes included the following: two genotypes, S. Nos. 26 and 4, exhibited cylindrical cormels; two genotypes, S. Nos. 15 and 24 had elongated cormels; two genotypes, S. Nos. 27 and 14, had elongated and curved cormels; nine genotypes with S. Nos. 9, 7, 3, 19, 10, 21, 17, 18 and 11 had elliptical cormels; and the cormel shape of the remaining genotypes was conical. Variation in bud colour included the following: three genotypes (S. Nos. 9, 15 and 24) had purple buds; seven genotypes with S. Nos. 17, 18, 11, 10, 21, 20 14 had pink buds; six genotypes with S. Nos. 7, 4, 25, 16, 13 and 3) had white buds; nine genotypes with S. Nos. 8, 1, 2, 19, 12, 22, 6, 23 and 5 had yellow green buds. The weight of cormels had two main categories: genotypes with S. Nos. 2, 4, 12, 13, 14, 21, 22 and 16 produced < 100 g.cormel-1, whilst the weight per cormel of the remaining genotypes ranged from 100 to 200 g.cormel-1. The multivariate analysis based on the 42 morphological traits revealed considerable diversity among the 27 genotypes of cocoyam assessed in this study. Each of the first 10 principal components had eigen-value greater than 1.0 and together explained 90.06% of the total variance in the data set (Table 3). The higher the eigen-value of a component, the more representative it is of the data. The percent of variance explained is dependent on how well all the components summarize the data.

The factor analysis
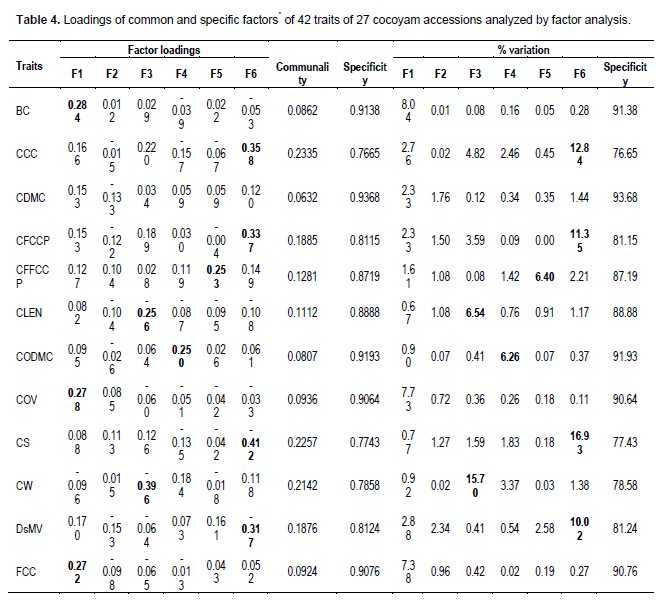
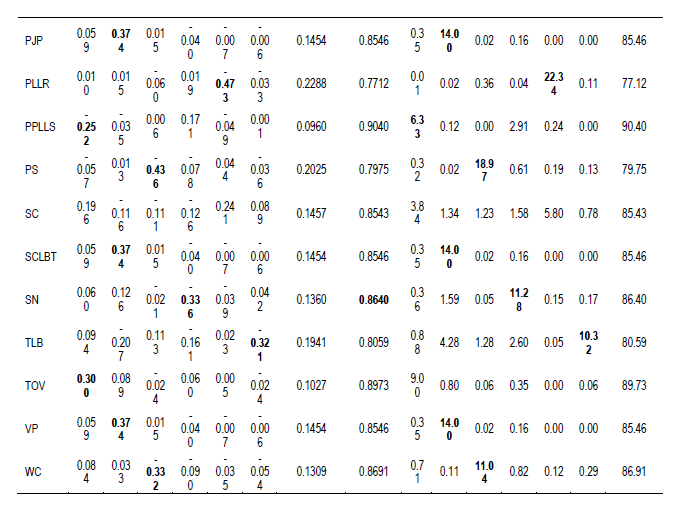
The six principal component eigen-values that were greater than 2.0 (Table 4) suggest the use of six factors in the factor analysis (Biabani and Pakniyat, 2008). Factor loadings with coefficients greater than or equal to 0.25 (ignoring the sign) were considered important and emboldened. These large and moderate loadings indicated how the traits were related to the factors (Manly, 1994). The contributions by the communalities were generally low for all traits measured compared to the specificity (Table 4). Factor 1 was high-loaded with: bud colour (0.284), colour of variegation (0.278), flesh colour of cormels (0.272), leaf blade colour (0.293), leaf blade colour variegation (0.297), predominant position of leaf lamina surface (-0.252) and type of variegation(0.300). Factor 2 was high-loaded with: petiole junction colour (0.374), petiole junction pattern (0.374), sap colour of leaf blade tip (0.374) and vein pattern (0.374).
Factor 3 was high-loaded with: corm length (-0.256), corm weight (-0.396), leaf spot or shoot hole spot (-0.333), plant height (-0.324), plant span (-0.436) and weight of cormels (-0.332).
Factor 4 was high-loaded with: dry matter content of cormels (0.269), flowering (-0.412), scientific name (-0.336) and leaf base shape (0.326). Factor 5 was high-loaded with: corm flesh fiber colour of central part (0.253), leaf lamina length/width ratio (0.371), leaf main vein colour (0.256), leaf waxiness (0.416) and number of cormels (-0.358) and petiole/lamina length ratio (-0.473). Factor 6 was high-loaded with: corm apex colour (0.358), corm flesh colour of central part (-0.337), corm shape, (-0.412), leaf sheath edge colour (-0.393) and taro leaf blight (-0.321) and Dasheen mosaic virus (-0.317). In this study, factor 1 did not account for most of the variation in the traits. Thus, the factors were rotated to further explore the variables.
Generally, all the traits measured were useful in determining variation in the cocoyam accessions. The six factors considered distinguished the characters into groups. The highest two weightings were given to petiole/lamina length ratio (-0.473) and plant span (-0.436) by factors 5 and 3, respectively. These traits were weakly positively related (r = 0.112ns) (Table 5), indicating that plant span increases as petiole/lamina length ratio increases. Other traits with high weightings in the same factor were highly positively correlated (Tables 4 and 5). Results of the rotated factors generally implied that variation in all traits was largely influenced by specificity compared to communality. For instance, the variation in bud colour (BC) was explained by 8.62% contribution from communality of which factor 1 (7.93%) contributed most compared with factors 2 (0.00%), 3 (0.14%), 4 (0.05%) 5 (0.14%) and 6 (0.23%). The specificity accounted for 91.51% and so on.


Cluster analysis
The dendrogram of the hierarchical cluster analysis separated the 27 genotypes into different clusters with Euclidean distance dissimilarities ranging between 0.5 and 1.0 (Figure 2). At the dissimilarity distance of 0.55, the dendrogram separated the accessions into two main clusters, which correspond to the two leaf base shapes including sagittate (cluster I) and peltate (cluster II) leaf base shapes. Sagittate leaf base shaped accessions clustered in main cluster I while the peltate leaf base shaped ones clustered in cluster II. At the dissimilarity distance of 0.70, the dendrogram identified four main clusters. Cluster A exhibited genotype MOSLCOY027-13, which belong to A. macrorhizza with horizontal leaves and over 10% of plants flowering.
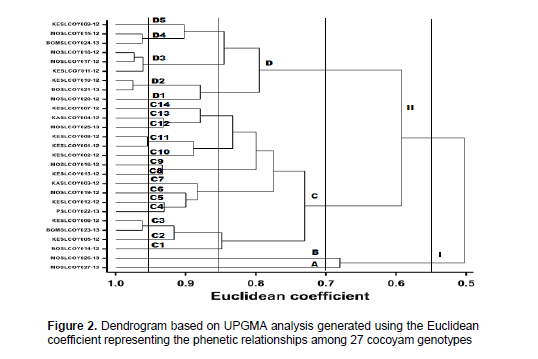
Cluster B consisted of genotype MOSLCOY026-13, which belong to C. esculenta with unique drooping leaves and arrow cormels. Genotypes of cluster C were characterized by saggitate leaves with mostly erect-apex down predominant position of leaf lamina surface, yellow-green to green leaf blade colour, light-green to petiole colour of top of top third, four genotypes with wide and the remaining medium plant span, white to yellow-green cormel buds and white cormel flesh.
Genotypes of cluster Dwere characterized by saggitate leaves with cup shaped predominant position of leaf lamina surface, purple leaf blade colour, yellow leaf main vein, stripe variegation, purple-green petiole colour, purple petiole colour of top, medium and bottom thirds, pink to purple cormel buds, pink to purple-yellow corm cortex and corm flesh colour of central part. At the dissimilarity distance of 0.85, the dendrogram identified 14 sub-clusters in main cluster C and five sub-clusters in main cluster D. Genotypes grouped in four sub-clusters C3, D2, D3 and D4 each, exhibited similar qualitative and quantitative traits.
The genetic distances generated using the two- dimensional plot of the MST revealed similar variations as the HCA. The MST indicated wide dispersion of genotypes along three quadrants I, II and IV (Figure 3 and Table 1). Genotypes belonging to X. sagittifolium were found in quadrants I and IV. Members of quadrants I and IV exhibited group properties comparable to those in the cluster analysis. Quadrant II had two genotypes, of which one belongs to C. esculenta (MOSLCOY026-13) and the other to A. macrorhizza (MOSLCOY027-13). The genetic distance between the genotype of C. esculenta and A. macrorhizza was shorter compared to the distances between C. esculenta and X. sagittifolium; and between A. macrorhizza and X. sagittifolium.
The polymorphism showed for 29 above ground and 13 below ground traits confirm that the selected descriptors are appropriate for appraising cocoyam diversity and similarity (IPGRI, 1999). Findings of the correlation analysis revealed a strong positive correlation between plant height and weight of cormels; between plant height and plant span; and between plant span and weight of cormels indicating that increasing plant height and span increased weight of cormels. Tall growing genotypes with wide plant span need wide spatial arrangement to perform well. These traits are important determining the maturity period of cocoyam plants.
Prana (2000) noted a strong positive correlation between plant height and corm maturity. Moreover, tall genotypes were observed to mature late (9 to 12 months), whereas medium genotypes matured in 6 to 9 months, and the dwarf ones in <6 months. In the present study, the genotypes exhibited dwarf and medium heights and as such, matured within 8 months growing period. Stolons, suckers, corms and cormels are important sources of cocoyam planting materials. Genotypes that produce optimum number of suckers are good for multiplication purposes (Mwenye, 2009).
However, farmers tend to select against this trait where profuse stolon growth reduces corm production thereby increasing production costs. Lebot et al. (2004) propounded that the presence of long stolons are peculiar to wild genotypes, which is often associated with small elongated corms, continuous growth and high concentration of calcium oxalate that causes acridity. There was a strong positive correlation between bud colour and flesh colour of cormels; and between corm cortex colour and corm flesh fiber colour of central part. Genotypes with pink to purple buds mostly expressed pink to lighter blotches darker cormel flesh pigmentation.
Similarly, genotypes with coloured cortex corms had different colours of corm flesh fiber of central part ranging from light-yellow to purple compared to the white corm cortex types. The factor analysis indicated significant contributions in the factor loadings of the 42 traits, which indicates their significance in determining the diversity among the 27 accessions. Six factors which had eigen-values greater than 2.3 were retained (Biabani and Pakniyat, 2008; Norman et al., 2014). These factors accounted for 77.5% of the total genetic variability. Traits with high weightings in the same factor were highly positively correlated (Tables 4 and 5). Factor 6 had the highest negative associations (24 traits) whereas factor 1 had the least (10 traits). The sign on the loadings indicates the direction of relationship between the factor and the trait measured (Biabani and Pakniyat, 2008). Two traits with high weighting in the same factor are expected to be highly correlated. This principle suggests that these traits could be probably influenced by similar gene(s) and may be used to identify variation among accessions (Biabani and Pakniyat, 2008). Other factors (7, 8, 9 and 10) explained 12.56% of the genetic variation, and were considered to be less important in characterizing cocoyam.
Factor 1 had moderate, positive loading for leaf base colour, leaf base colour variegation, bud colour, flesh colour of cormels, colour of variegation and type of variegation on one hand; and moderate (predominant position of leaf lamina surface) negative influence on characterizing the genotypes. It, therefore, measured the importance of colour of gross morphological traits against predominant position of leaf lamina surface trait in distinguishing the genotypes. Factor 2 had a moderate, positive loading for petiole junction colour, petiole junction pattern, sap colour of leaf blade tip and vein pattern. It measured the distinct petiole, sap colour of leaf blade tip and venation traits typical of C. esculenta compared to X. sagittifolium and A. macrorhizza. Factor 3 had a moderate, negative loading for above ground traits (plant height, plant span), leaf spot or shot hole spot and underground traits (corm weight, weight of cormels and corm length). It measured growth, biotic stress and underground traits. Factor 4 had moderate positive loading for leaf base shape and dry matter content of cormels, on one hand, and a moderate to high negative loading for scientific name and flower formation. It measured the contrast between food quality and leaf base shape traits on one hand, and flowering behavior of the various species studied. Of the 27 genotypes studied, only genotype MOSLCOY027-13 of A. macrorhizza produced flower, which concurred with Onwueme (1978) that flowering seldom occurs in cocoyam. Factor 5 had moderate positive loadings for leaf lamina length/width ratio, leaf main vein colour, leaf waxiness and corm flesh fiber colour of central part, on one hand, and a moderate to high negative loading for petiole/lamina length ratio and number of cormels. It measured the contrast between leaf and corm flesh traits on one hand, and petiole/lamina length ratio and number of cormel traits on the other. Factor 6 had moderate positive loading for corm cortex colour and corm flesh colour of central part, and a moderate negative loading to leaf sheath edge colour, taro leaf blight, dasheen mosaic virus and corm shape. It measured the contrast between corm colour quality traits on one hand, and gross morphology and biotic stress traits on the other. Generally, all the traits measured loaded more than 75% as specificity compared to communality. This is indicative of how significant each trait contributed to the genetic variation observed in the accessions.
The variation among genotypes of sub-clusters C3, D2, D3 and D4 based on genetic distances was narrow indicating the possibility of overlap in the graphical principal components. Overlap among species for morphological traits generally increase taxonomic complexity and make characterization difficult (MacLean et al., 1993). This suggests the use of molecular techniques to augment morphological classification to resolve issues of overlap and confirm morphological associations. However, the overlap among the sub-groups was within the same species rather than different species. The high inter-mix of genotypes and the presence of overlap in the minimum spanning tree (Figure 3) also suggest the possibility of duplicate genotypes. This may have occurred by introduction of similar genotypes into different regions either by exchange of germplasm between farmers and/or release of new genotypes. On the other hand, the variation in agro-morphological traits among species and genotypes is possibly due to sexual recombination and/or mutation. High genotypic diversity provides traits to improve yield, quality, pests and diseases resistance and adaptation to erratic environmental conditions that ensures adequate food supply. Based on the phenetic distance analysis, the following groups of genotypes including: KESLCOY010-12 and BOSLCOY021-13; MOSLCOY018-12, MOSLCOY017-12 and KESLCOY011-12; KESLCOY001-12 and KESLCOY008-12; and KESLCOY006-12 and BOMSLCOY023-13 are possible duplicates since they exhibited shortest genetic distances with up to 95% similarity among sets. This implies that the different vernacular names of genotypes in different localities do not necessarily mean their genetic variability.
The 27 genotypes screened and characterized exhibited peculiar traits per genus as revealed by the multivariate tools used. This implies that there are gaps in character representation of cocoyam genotypes collected in Sierra Leone. Subsequent collection of the crop should focus more on the peculiar traits. Traits that discriminated the most between the genotypes were: above ground, biotic stress, underground storage organ and quality traits. Molecular investigation to confirm present agro-phenotypic variation forms part of future studies for the effective use of germplasm. This information contributes to effective conservation and utilization of the cocoyam genetic resources for its genetic improvement.