ABSTRACT
Avian diversity is among the key components of the earth’s biodiversity. This study was conducted in Choke Mountains from January to April, 2018 to identify the diversity, relative abundance and distribution of avian fauna. Data were collected in three different habitats (natural forest, grazing and protected areas). The sampling areas were selected using stratified random sampling technique. Point count (for forest site) and line transect methods (for grazing and protected habitats) were employed to collect data. Shannon-Weaver diversity index (H`), Encounter Rate, Richness index (RI), Evenness Index (E) and Simpson’s similarity index (SI) were used for data analysis. A total of 55 bird species belonging to 11 orders and 27 families were identified during the study period. Wattled Ibis (Bostrychia carunculata), Slender billed starling (Onychognathus tenuirostris), Alpine chat (Pinarochroa sordida), Waller’s starling (Onychognathus walleri) and White collared pigeon (Columba albitorques) were the most abundant species in the study area. Relatively higher diversity of bird species was observed in the natural forest habitat (H’ = 2.93) and the lower species diversity was observed in the protected area (H’ = 2.56). The evenness diversity index (E) indicated the highest evenness distribution was registered in the protected area (E = 0.89) and relatively, the lowest evenness was in grazing area (E = 0.87). The highest species richness was registered in natural forest habitat (4.40) followed by Grazing (3.36) and protected habitats (2.57). Grazing and protected areas have higher similarity index (0.40) and the lower similarity index was observed between natural forest and grazing areas (0.20). Agricultural expansion, overgrazing of livestock contributed to the deterioration in the diversity and abundance of birds of the study area. Thus, serious action is needed to conserve the biological diversity in Choke Mountains.
Key words: Abundance, birds, Choke Mountains, distribution.
An informed geological history, diverse climate types and physical and topographic features are responsible for the occurrence of varied biological resources in Ethiopia (Brenan, 1978). The country has diverse ecosystems ranging from humid forest and extensive wetlands in the west and southwest to the Afar Depression of the Great
Rift Valley in the northeast. The fauna and flora of the country are scattered from the highest mountain peaks over 4000 m.a.s.l. to the lowest and hottest place in the Dallol Depression, 116 m.b.s.l. (Ethiopian Mapping Authority, 1988). The fifth largest rank of floristic composition in tropical Africa occurs in Ethiopia, with a high level of endemism (Brenan, 1978). This range of habitats support a rich variety of species, which contributes to the overall biological diversity of the country (Sekercioglu, 2007). Among 1,850 species of birds found in Africa, 926 (with 16 endemic species) are found in Ethiopia (Redman et al., 2009). Including the endemics, 665 species are residents, 30 are migratory and 69 are mainly African (south of the Sahara desert) or tropical species which also occur in the Palaearctic region. According to Yalden et al. (1996), there are 199 Palaearctic winter visitors in Ethiopia, including 21 passage migrants. Of these, 169 are only visitors with no resident forms.
Currently, 669 Biosphere reserves are registered in 120 countries including 16 transboundary sites all over the world (Azeria et al., 2007). Seventy of these are located in 28 African countries. Sub-Saharan Africa is a home for 64 biosphere reserves in 28 countries. Of which, 5 are found in Ethiopia. Namely: Kafa, Sheka, Yayu, Lake Tana and Majang that have been successfully included between 2010 and 2017 in the global Biosphere reserves list. According to Ethiopian wildlife and natural history society investigations, bird fauna in Ethiopia are negligible compared to other near-African countries like Kenya, Uganda, and Tanzania. Diversity of birds is assumed to be different across varied ecological zones of the biosphere reserve (Azeria et al., 2007).
Choke Mountains are the subject of the present study where data on bird diversity and population is still not known. The vegetation cover and animals in this area have been declining due to the development of human and livestock populations, expansion of agriculture, settlement, and pollution in the surrounding towns. Habitat losses due to anthropogenic factors are likely to strictly affect the avifauna and other wild animals living in and around the Mountain ranges. However, the degree of damage on the avifauna is not known. Therefore, the objective of the study was to identify Species Composition, Relative Abundance and Distribution of Bird Species in the study area.
Study area
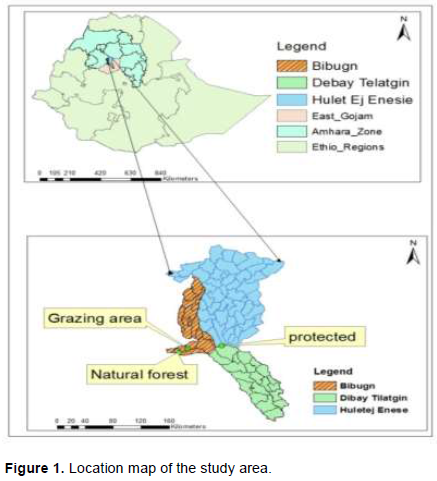
The study was conducted in Choke Mountain regions by selecting three sampling sites (Figure 1). Choke Mountain regions are one of Ethiopian highlands located in Amhara National Regional State, East Gojjam Zone, northwest of Debre Markos town. It is about 330 km north of the national capital, Addis Ababa, by road. These highlands lie at latitude of 10° 41'-10° 44'N and longitude 37° 50'-37° 53'E. Especially, the central peak is located at 10° 42'N and 37° 50'E. Elevation of the mountain chains ranges from 2,800 to 4,070 m a.s.l., and they occupy a total area of 1,7443 km2 (Teferi et al., 2010).
Methods of data collection
Three study sites were selected using a stratified random sampling technique in order to apply a line transect (for common grazing and protected areas) and the point count method (for natural forest habitat). In each point count station, a minimum distance of 150-200 m was maintained using GPS to avoid double counting. To minimize disturbance during the count, a waiting period of 3 to 5 min prior to counting was applied (Hosteler, 2006). Where point count technique in the natural forest area was employed, the radial distance from which birds occurred was estimated and the type and group number of the species were observed. Bird species were identified by using their feather shape and colors, beak, eye colors, legs and body size (Wenny et al., 2011). The numbers, types and locations of birds were recorded during a fixed amount of time at each point. Stations for the point count method were selected depending on the activity and position of birds. The start of point was selected randomly (Bibby et al., 2000).
The survey was carried out in the absence of rain or heavy fog from 6:30-10:00 AM in the morning and from 4:30 to 6:00 PM in the afternoon. According to Bibby et al. (2000) this census period is appropriate because the bird’s activities tend to be high. The perpendicular distance from which the bird occurred to the point count was estimated and then the type and the group number of species were recorded using direct observation. Photographs and videos were taken to justify the species type for those species which were difficult to identify.
Data analysis
The collected data were analyzed using different techniques. The diversity of bird species was calculated by using Shannon- Weaver diversity index (H`) where

The mean and proportion were used to know the composition and abundance of recorded bird species. Relative abundance was determined using encounter rates that give crude ordinal scales of abundance (abundant, common, frequent, uncommon and rare) (Bibby et al., 2000). Encounter rate for each species was calculated by dividing the number of birds recorded to the number of hours spent searching, giving a figure of birds for each species. The abundance categories (the number of individuals per 100 field hours) were: < 0.1, 0.1-2.0, 2.1-10.0, 10.1-40.0 and > 40. For each category, the following abundance score is given: 1 (rare), 2 (uncommon), 3 (frequent), 4 (common) and 5 (abundant), respectively. To understand birds’ community similarity among sites, Sorensen’s coeffcient was applied and calculated as follows: . Where S = Sorenson’s Coeffcient, c is the number of species that the three communities have in common, A is the total number of species found in community A, B is the total number of species found in community B, and C is the total number of species found in community C (Araya et al., 2013). Species evenness was evaluated using an Evenness Index (E) as follows: E = H’/ Hmax, where E = Evenness Index, H’ = Shannon-Wiener diversity Index and Hmax = ln S (that is, natural logarithm of the total number of species) (Tramer, 1969). Species richness index (RI) in different sites was calculated by the formula RI = S-1/ln N, where S = number of species in each habitat, N = number of individuals in each species of each habitat and ln = natural logarithm.
Species composition
In this study, a total of 55 species of birds belonging to 11 orders and 27 families were recorded (Table 1). Among them, Abyssinian Long claw (Macronyx flavicollis) and Black-winged Lovebird (Agapornis taranta) are endemic to Ethiopia. Wattled Ibis (Bostrychia carunculata), Thick-billed Raven (Corvus crassirostris) and White-collared pigeon (Columba albitorques) are endemic to Ethiopia and Eritrea.
In the study area, the natural forest contains relatively more number of species (28), than in the grazing areas (22 species), and protected areas (18 species).
Distribution and abundance
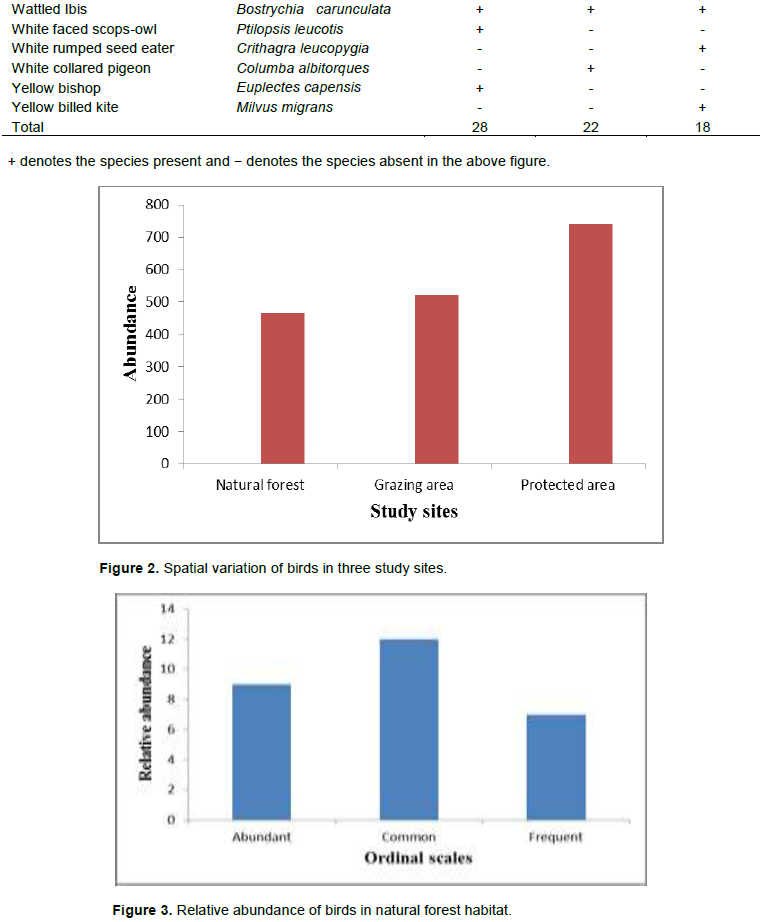
From 55 identified bird species in three sites of the study area, Augur Buzzard (Buteo augur), Alpine chat (Pinarochroa sordida), Slender billed starling (Onychognathus tenuirostris), Wattled Ibis (Bostrychia carunculata) and Black kite (Milvus migrans) were found in three sites (Table 2). A total of 1727 individuals of birds, 465 in natural forest, 521 in grazing area and 741 in protected area were recorded (Figure 2).
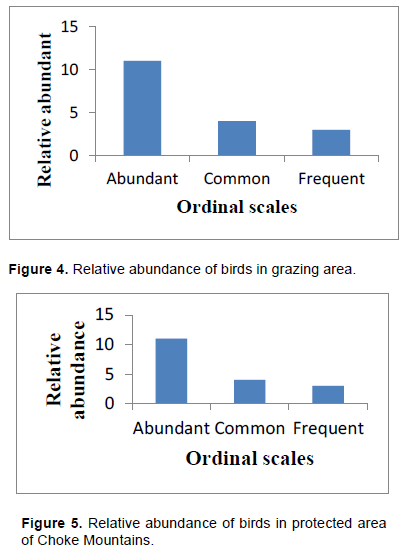
Among the recorded birds, the most abundant in the study area were: Wattled Ibis (B. carunculata). Slender billed starling (O. tenuirostris), Alpine chat (P. sordida), Waller’s starling (Onychognathus walleri), and White collared pigeon (Columba albitorques). But, Plate flycatcher (Agricola pallidus), Rüppell's robin-chat (Lamprotornis purpuropterus), Yellow billed kite (M. migrans), and White faced scops-owl (Ptilopsis leucotis) were species with low individuals in the study area. Relative abundance of birds in the study area showed that 50.9% species of birds were abundant, 45.45% common, and 20% frequent. Relative abundance of birds in the natural forest habitat showed that 42.86/% (12/28) of bird species are common, 32.14% (9/28) abundant, and 25% (7/28) frequent (Figure 3). Relative abundance of birds in the grazing habitat showed that 45.45% (10/22) of birds were abundant, 40.9% (9/22) common and 18.18% (4/22) frequent (Figure 4). Relative abundance of birds in the protected habitat showed that 61.1% (11/18) of birds are abundant, 22.2% (4/18) common and 16.7% (3/18) are frequent (Figure 5).


Species diversity
Diversity index (H’) and evenness (E) of bird species varied between the three habitats. The highest diversity was observed in the natural forest habitat (H’= 2.93) and relatively, the lowest diversity index was observed in the
protected area (H’= 2.56) (Table 3).
Species richness
The distribution of birds within the three habitat types differs among each other at family and order level. The highest richness was registered in natural forest habitat (4.396). Grazing and protected habitats have richness index of 3.357 and 2.573, respectively (
Species similarity
Simpson similarity index (SI) of the three study sites in Choke Mountain bird species showed that grazing and protected areas have a higher similarity index (0.4) compared to a lower similarity index that was observed between natural forest and grazing areas (0.2 and 0.26, respectively) (Table 5).
Assessment of bird species available in different micro habitats of Choke Mountains was conducted to show the spatial variations in distribution, abundance and species diversity of birds. According to Mehra et al. (2017), bird species richness, distribution and abundances are directly or indirectly affected by special variations and rate of anthropogenic activities. Anthropogenic activities such as over grazing and deforestation, which are the main causes of habitat loss, fragmentation, degradation, and climate change can ultimately cause migration and extinction of bird species that are present in that habitat (Gibbs et al., 2010).
In the present study, a total of 55 bird species were recorded in 11 orders and 27 families in three micro-habitats (natural forest, grazing and protected areas) of the Choke Mountains. The natural forest accounts for 28 species; whereas, 22 and 18 species were recorded in grazing and protected areas, respectively. The intensity of predation pressure, available food, disturbance, and the particular habitat selection nature of birds might be the responsible factors for differences in species number among micro-habitats (Esayas and Bekele, 2011; Girma et al., 2017). Habitat size and quality, foraging modes of birds and floristic composition also may have great influence in the distribution of the avian species in the above variations (Aynalem and Bekele, 2008; Girma et al., 2017). In addition, energy supply and productivity and temperature of the area have been alternatively considered as key factors in determination of animals (Aynalem and Bekele, 2008).
The number of species recorded in the present study is less than reported by previous studies conducted in different parts of Ethiopia. These previous studies include: Esayas and Bekele (2011) in Entoto National park, Desalgn and Subramanian (2015) in Angereb Forest and adjacent farm land, Girma et al. (2017) in and around Wondo Genet Forest, Genet and Ejigu (2017) in Apini and Dikuma forest patches, Awi Administrative Zone, Moges et al. (2018) in Gonde Teklehimanot and Aresema monasteries in North Gondar. This difference might be associated with geographical variations as the present study area ranges up to 4,070 m. a.s.l., and include extreme climatic factors such as very cold temperatures.
Moreover, anthropogenic activities such as over grazing and deforestation which are the main causes of habitat loss, fragmentation, degradation, and climate change in the study area may take the lion share for this variation. Conspicuousness of birds, the skill of the researcher for identification and the technique employed during the survey can also be considered as factors for this variations (Poulsen, 2002). Five endemic bird species are recorded in the present study. It is obvious that as altitude increases, the biodiversity decrease but endemicty of species increases (Poulsen, 2002; Esayas and Bekele, 2011).
The highest diversity of species in the natural forest of the study area may be due to favorite breeding sites, availability of food in microhabitats which favored certain varieties of bird species, cover from predators, and less disturbance compared to other areas (Sethy et al., 2015). Floristic composition and vegetation structure are repeatedly stated as variables that determine the number of species of a given area (Campbell and John, 2012; Moges et al., 2018). The present study is in line with previous findings conducted by Aynalem and Bekele (2009), Esayas and Bekele (2011), Tadele et al. (2014), Desalgn and Subramanian (2015) and Girma et al. (2017). The second highest number of species was recorded in the grazing habitat. This may be associated with adaptability of birds to live in human modified habitats, where food is available. The openness of the grazing site, compared to protected habitat might have also contributed for easy identification of birds (Esayas and Bekele, 2011). According to Hailu (2008), open areas are easily accessible for counting and locating bird species.
Relatively, the lowest number of species was observed in protected areas. This might be possibly associated with altitudinal effect on avian diversity as the protected areas are located above 3,500 m a.s.l. (Poulsen, 2002; Waterhouse et al., 2002; Esayas and Bekele, 2011). Mengesha et al. (2011), and Asefa (2013) also found higher number of species in the disturbed habitat than in the undisturbed ones. The difference of bird species preference is influenced by the individual species specific requirement to each specified habitat. Some species require habitats with short grasses and little cover while others require the reverse (Tadele et al., 2014).
Abundance scores of species were varied among habitats. These might be due to the variations in resources/food availability among the three habitats. Moges et al. (2018) reported that the variation in abundance of bird species between habitats is determined by food availability and breeding sites. Baker et al. (2010) also reported that variation in abundance of bird species was observed between different habitats than between seasons. The higher evenness distribution in protected areas might be due to fewer disturbances of human and other animals, since this area is free of direct contact of human and animals (Nabaneeta and Gupta, 2010; Esayas and Bekele, 2011). The highest abundant of birds might be due to favorable weather conditions of the area during the study period and suitability of the area to count birds (dry season). According to Sagarin and Gaines (2002) weather had an impact on bird habitats by generating food and cover, which improve their ability to reproduce and survive hence increasing their abundance. The variation in the abundance of birds species observed in different microhabitats could be triggered by the temporal and spatial movements of bird species following specific species requirement, such as nesting sites and breeding site for survival and reproduction (Esayas and Bekele, 2011; Girma et al., 2017). The highest species similarity between the two habitats, which are spatially closer, is expected since these habitats share some bird species (Sethy et al., 2015). Tubelis and Cavaicanti (2001) noted that similarity of avian species composition between habitats indicates a tendency for similar habitats to have similar species composition. This concept agreed with the present result as the two nearby habitats (grazing and protected) have higher similarity index. As the researcher clearly observed during data collection, agricultural expansion, excessive grazing of cattle and sheep, deforestation and climate change, all of which can ultimately cause migration and extinction of bird species, present in that habitat are the major threats of birds in the study area.
Relative abundance of birds in the study area showed that most of the species were abundant. Diversity index and evenness of bird species varied between the three habitats. The highest diversity of bird species was observed in the natural forest and relatively, the lowest diversity index was observed in the protected area. The highest even distribution was registered in the protected area and relatively, the lowest evenness was in the grazing area. The highest richness was registered in the natural forest habitat. Simpson similarity index (SI) showed that grazing and protected areas have higher similarity index; whereas, the lower similarity index was observed between natural forest and grazing areas. Agricultural expansion, excessive grazing of cattle and sheep and deforestation cause migration and extinction of bird species present in that habitat; and these are the major threats of birds in the study area.
(i) Choke Mountains need immediate protection from overgrazing and agricultural expansion to save the biodiversity
(ii) Further ornithological surveys should be conducted in detail including wet season.
(iii) Cooperation among different stakeholders (that is, ecologists, environmentalists, local communities and bird watcher groups) is required to ensure the sustainability of the area.
(iv) Surrounding governmental offices should be integrated for habitat management in wild fauna and flora
(v) The fauna and flora of Choke Mountain should be assessed and monitored regularly.
The authors have not declared any conflict of interests.
REFERENCES
|
Araya H, Yonas M, Haileselasie TH (2013). Community composition and abundance of residential birds in selected church forests, Tigray Region, Northern Ethiopia. Scientifc Research and Essays 8:1038-1047.
|
|
|
|
Aynalem S, Bekele A (2008). Species composition, relative abundance and distribution of bird fauna of riverine and wetland habitats of Infranz and Yiganda at southern tip of Lake Tana, Ethiopia. Tropical Ecology 49:199-209.
|
|
|
|
|
Azeria ET, Sanmartı I, Stefan A, Burgess A (2007). Biogeographic patterns of the East African coastal forest vertebrate fauna. Biodiversity Conservation 16:883-912.
Crossref
|
|
|
|
|
Baker PJ, Thomas RL, Newson SE, Thompson V, Paling NRD (2010). Habitat associations and breeding bird community composition within the city of Bristol, UK. Bird Study 57:183-196.
Crossref
|
|
|
|
|
Bibby CJ, Burgess ND, Hill DA, Mustoe SH (2000). Bird census techniques, 2nd ed. Academic Press, London.
|
|
|
|
|
Brenan JPM (1978). Some aspects of the phytogeography of tropical Africa. Annals of Missouri Botanical Garden 65:437-478.
Crossref
|
|
|
|
|
Campbell M, John M (2012). Habitat Fragmentation and Birds available at: faculty.
View
|
|
|
|
|
Desalgn A, Subramanian C (2015). Studies on avian diversity in Angereb forest and adjacent farm land with reference to rainy and post rainy seasons, Northwestern Ethiopia. International Journal of Pure and Applied Zoology 3:219-225.
|
|
|
|
|
Esayas K, Bekele A (2011). Species composition, relative abundance and distribution of the avian fauna of Entoto Natural Park and Escarpment. Ethiopian Journal of Science 34:113-122.
|
|
|
|
|
Ethiopian Mapping Authority (EPA) (1988). National Atlas of Ethiopia. Berhanena Selam Printing Press, Addis Ababa.
|
|
|
|
|
Genet Y, Ejigu D (2017). Community composition, relative abundance and habitat association of avian species in Apini and Dikuma forest patches, Awi Administrative Zone, Ethiopia 10:33-50.
|
|
|
|
|
Gibbs HK, Ruesch A, Achard F, Clayton M, Holmgren P, Ramankutty N, Foley J (2010). Tropical forests were the primary sources of new agricultural land in the 1980s and 1990s. Proceedings of the National Academy of Sciences 107:167-173.
Crossref
|
|
|
|
|
Girma Z, Mengesha G, Asfaw T (2017). Diversity, relative abundance and distribution of avian fauna in and around Wondo Genet forest, South–central Ethiopia. Research Journal of Forestry 11:1-12.
Crossref
|
|
|
|
|
Hailu S (2008). Species composition, distribution, relative abundance and habitat association of Avifauna of Wof Washa National Forestry Priority Area, Ethiopia. M.Sc Thesis Addis Ababa University, Addis Ababa pp. 1-76.
|
|
|
|
|
Hostler ME, Martin MB (2006). Florida Monitoring Program: Transect Method for Surveying Birds. University of Florida press, Florida, 137 p.
|
|
|
|
|
Mehra SP, Mehra S, Uddin M, Verma V, Sharma H (2017). Waste as a resource for avifauna: Review and Survey of the Avifaunal Composition in and around Waste Dumping Sites and Sewage Water Collection Sites (India). International Journal of Waste Resources 7:1-8.
|
|
|
|
|
Mengesha G, Mamo Y, Bekele A (2011). A comparison of terrestrial bird community structure in the undisturbed and disturbed areas of the Abijata Shalla Lakes National Park, Ethiopia. International Journal of Biodiversity Conservation 3:389-404.
|
|
|
|
|
Moges E, Masersha G, Chanie T, Wgeorgis C (2018). Species diversity, habitat association and abundance of avifauna and large mammals in Gonde Teklehimanot and Aresema monasteries in North Gondar, Ethiopia. International Journal of Biodiversity Conservation 10:185-191.
Crossref
|
|
|
|
|
Nabaneeta A, Gupta A (2010). Avian Community Analysis in Fragmented Landscapes of Cachar District. Journal of Science of Technology 5:75-84.
|
|
|
|
|
Poulsen BO (2002). A comparison of bird richness, abundance and trophic organization in forests of Ecuador and Denmark. Journal of Tropical ecology 18:615-636.
Crossref
|
|
|
|
|
Redman N, Stevenson T, Fanashawe J (2009). Birds of the Horn of Africa. Princeton University Press, Princeton and Oxford 496 p.
|
|
|
|
|
Sagarin RD, Gaines SD (2002). The abundant center distribution: to what extent is it a bio geographical rule? Ecology 5:137-147.
|
|
|
|
|
Sekercioglu C (2007). Bird functional diversity and ecosystem services in tropical forests, agroforests and agricultural areas. Journal of Ornithology 153:153-161.
Crossref
|
|
|
|
|
Sethy J, Samal D, Sethi1S, Baral B, Jena S (2015). Species diversity and abundance of birds in North Orissa University. International Journal of Innovative Research, Engineering and Technology 4:303-318.
|
|
|
|
|
Shannon CE, Weaver W (1949). The Mathematical Theory of Communication. Urbana, IL: The University of Illinois Press pp. 1-117.
|
|
|
|
|
Tadele H, Bekele A, Asefa A (2014). Comparison of avifaunal assemblage and their association with plant cover in protected and unprotected montane grassland ecosystems in bale mountains national park, Ethiopia. Ethiopian Journal of Science 37:105-112. Teferi E, Uhlenbrook S, Bewket W, Wenninger J (2010). The use of remote sensing to quantify wetland loss in Choke Mountain range, upper Blue Nile basin, Ethiopia.
|
|
|
|
|
Tramer EJ (1969). Bird species diversity: components of Shannon's formula. Ecology 50:929-931.
Crossref
|
|
|
|
|
Tubelis DP, Cavaicanti RB (2001). Community similarity and abundance of bird species in open habitats of a central Brazilian cettado. Ornitologia Neotropical 12:57-73.
|
|
|
|
|
Waterhouse FL, Monica H, Mather MH, Seip D (2002). Distribution and abundance of birds relative to elevation and biogeoclimatic zones in coastal old-growth forests in southern British, Columbia. B.C. Journal of Ecosystems and Management 2:1-13.
|
|
|
|
|
Wenny DG, DeVault TL, Johnson MD, Kelly D, Sekercioglu CH, Tomback DF, Whelan CJ (2011). The need to quantify ecosystem services provided by birds. Auk 128:1-14.
Crossref
|
|
|
|
|
Yalden DW, Largen MJ, Kock D, Hillman JC (1996). Catalogue of the mammals of Ethiopia and Eritrea: Revised checklists, Zoogeography and Conservation. Tropical Zoology 9:73-160.
Crossref
|
|