ABSTRACT
The comprehensive analysis of five identified and two unknown termite species with their binary scores of three markers viz., morphological, ISSR scoring and 28s rDNA sequence has been made to reveal in unweighted pair group method with arithmetic mean (UPGMA) cluster that Trinervitermes biformis (Wasmann) is out grouped with 35.7% of dissimilarity with other species; Odontotermes obesus (Rambur) and Odontotermes redemanni (Wasmann) share same cluster with 32.7% of dissimilarity; similarly Odontotermes ceylonicus (Wasmann) and Odontotermes horni (Wasmann) share a maximum of 32.5% of dissimilarity. The UNKNOWN01 had more similarity with O. obesus (Rambur) and O. obesus (Rambur) in turn showed high similarity with that of O. redemanni (Wasmann). UNKNOWN02 was found along with O. ceylonicus (Wasmann) and O. horni (Wasmann). The study imparts cumulative or comprehensive analysis using different markers such as morphological, ISSR and nuclear genes like 28s rDNA that depict accurate measures of genetic diversity among different species of termites.
Key words: Termite diversity, Odontotermes, Trinervitermes, inter simple sequence repeat (ISSR), 28s rDNA, unweighted pair group method with arithmetic mean (UPGMA), multiple sequence analysis.
Termites are a well-known eusocial group of hemimetabolous insects classified under the taxonomic rank of infraorder Isoptera. In recent years, approximately 4000 living and many fossil, termite species are recognized and classified into 12 families. Termitidae being the largest family contains 14 subfamilies, 280 genera and over 2600 species (Kambhampati and Eggleton, 2000; Eggleton, 2001; Ohkuma et al., 2004; Krishna et al., 2013). Termites mostly feed on dead plant material for its cellulose content, generally in the form of wood, leaf litter on soil and animal dung. It is important to note that only about 10% of the estimated 4,000 species are considered as pests (Krishna et al., 2013; Bechly, 2007; Eggleton, 2010). Molecular markers are biological molecules of an organism, which can be an effective tool to measure genetic diversity, similarity within and among species, to identify and categorize species according to systematic classification, selectable trait for breeding programs, assess population dynamics and natural forces acting on specific alleles (Chauhan and Rajiv, 2010).
Inter species analyses using a variety of markers, such as: Inter-Retrotransposon Amplified Polymorphism (IRAP), Retrotransposon-Microsatellite Amplified Polymorphism (REMAP), Sequence-Specific Amplification Polymorphism (S-SAP), Amplified Fragment Length Polymorphism (AFLP), Inter Simple Sequence Repeat (ISSR) and Simple Sequence Repeats (SSR), have determined that high resolution melting (HRM) analysis to detect SNPs served best to detect accurate genetic diversity (Sorkheh et al., 2017). ISSR markers are helpful in identifying closely related species instantly and are very useful in studying genetic diversity among closely related species which are generally difficult to identify by other means (Salhi-Hannachi et al., 2005; Okpul et al., 2005). ISSR is a multilocus marker similar to Randomly Amplified Polymorphic DNA (RAPD). They produce non-homologous similar sized fragments of DNA and pose difficulty in reproducibility (Sanchez, 1996). Although up to 99% of reproducibility has been reported by Fang and Roose (1997) in certain crop plants, which might be due to repeated inbreeding.
These limitations can be overcomed if the markers are mapped on to the genome (Semagn, 2006). ISSR markers are also used to distinguish maternal and non-maternal aphids easily compared to single nucleotide polymorphism (SNPs) (Abott, 2001). Termite genetic diversity can be analysed efficiently using ISSR markers, which can be confirmed by using nuclear genes or mitochondrial gene analyses (Long et al., 2009). Termites undergo moderate inbreeding, resulting in a wide range of genetic similarities studied by using ISSR markers (Husseneder and Grace, 2001). ISSR markers have been used in only a few animal models (Dusinsky et al., 2006); and when used, ISSR markers have efficiently discriminated both between and within species (Wang et al., 2009). Mitochondrial DNA (mtDNA) can be used to ascertain the genetic relatedness among termites that are isolated geographically (Austin et al., 2002). The sympatric association between different species of Reticulitermes was analysed using mtDNA, 16s rDNA, NADH dehydrogenase and gas chromatography markers.
The results pointed out certain clinical variations which do not support natural hybridization among the collected samples (Marini and Mantovani, 2002). Ribosomal molecular markers like 16s rDNA and hybridization based markers like RFLP, can be used for identification of termites, which lack distinguishable morphological characters among different species (Wang et al., 2009). Similarly, the 28s rDNA D2 region of the Culex mosquito revealed complex genotypic diversity (Shanmugavel et al., 2014). In view of the aforementioned information, an attempt has been made to record the molecular diversity of termites belonging to Termitidae family based on ISSR markers and 28s rDNA sequences in order to delineate the extant of divergence among the collected termite samples belonging to the Termitidae family at Jnanabharathi campus, Bangalore University, Bengaluru which is an unexplored site with reference to Termite diversity.
Study area
The present study is intended to yield new insights in understanding the genetic diversity of termite species in Bangalore. Jnanabharathi campus was selected for sample collection as the campus hosts a wide range of flora and fauna along with a variety of habitats viz-a-viz intensity of human environmental interference (Pranesh and Harini, 2015). Samples were collected during November, December and January in 2010, 2011 and 2012 to maintain uniformity in season.
Method of sample collection and its storage
Heavy-headed hammer, pickaxe, shovel and digging bar were used as appropriate to open termite nests and splitting wood to expose specimens. Based on habit and habitat, mount-building termites were collected by using a rubber-pump manual aspirator. Termites, which construct galleries on trees, and those which dwell underground, were collected by hand picking using feather-light forceps or a vacuum pump aspirator (Pranesh and Harini, 2014). The collected samples were stored in 70% ethanol at room temperature in air-tight vials for further analysis.
Identification of collected termite samples
The collected termite samples were preserved in 70% alcohol, categorized (based on casts) and counted. The samples were identified based on the morphological description given by Roonwal and Chhotani (1989) and Chhotani (1997). Morphological analyses were done with the aid of a Motic microscope with an attached 3MP camera. The measurements were made using the calibrated Motic Images obtained with Plus 2.0 Ver. software.
ISSR marker analysis
Isolation of DNA and quantification
The samples were removed from 70% ethanol and kept in double distilled sterile water for 2 min. Legs were separated from the worker termites of each species and collected in different micro centrifuge tubes (1.5 ml capacity). The collected voucher samples were homogenized, DNA was isolated and column purified using kit procured from Aristogene biosciences Pvt. Ltd., according to manufacturer’s protocol. The DNA was quantified using UV spectroscopy (Sambrook and Russell, 2001) and it was made sure that the purity of the DNA with absorbance at 260/280 ratio ranges from 1.8 to 2.0.
Amplification of DNA using ISSR markers
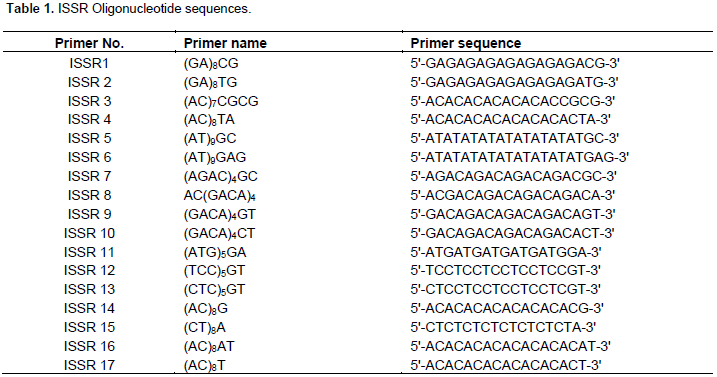
The amplification of DNA was done according to Al-Otaibi (2008). The amplification was done using 17 ISSR primers (Table 1). PCR reaction was done using a PCR master mix provided by Aristogene biosciences Pvt. Ltd. The final total volume of PCR reaction was 40 µl, containing 0.5 Units of Taq DNA polymerase, 2 mM MgCl2, 200 µM of each dNTPs, 50 ng of DNA and 1000 pmol of primer, added to the reaction. Initially for standardization purposes, 2 µl of O. horni DNA were added for every 37 µl of master mix; 17 different aliquots of 39 µl of the master mix with DNA were divided in separate portions, and each portion kept in labeled PCR vials; to each vial, 1 µl of different ISSR primers were added and suitable PCR reaction temperature was set for 40 cycles according to Al-Otaibi (2008).
Electrophoresis of PCR products
The PCR products with tracking dye were loaded onto 2% agarose gel, mounted in an electrophoretic unit according to Sambrook and Russell (2001). The agarose gel used for standardization of primers is as shown in Figure 1. Among the total of 17 primers, 8 oligonucleiotides were successfully amplified. Further, among them, 6 ISSR primers (2, 4, 6, 10, 11 and 12) were used which gave visible scorable bands. ISSR primers 7 and 8 were not considered, because a similar banding pattern was obtained while standardizing the primers. Thus, the present genetic diversity study included 5 different known species and two unknown species of termites with 6 ISSR primers, which were amplified with the standardized conditions as stated earlier (Figure 2A to F).
Scoring and statistical calculations
The ISSR banding patterns obtained by electrophoresis were scored (1 for presence of a visible band and 0 for absence of a particular band), and analysed using an online statistical tool (http://genomes.urv.cat/UPGMA/index.php) for the calculation of the Similarity Matrix based on Jaccard’s coefficient, UPGMA phenogram rooted tree and Cophenetic Correlation coefficient. The scoring was also used to calculate heterozygosity (Torre et al., 2012) using MS-excel with the Hardy-Weinberg formula as specified in the following: In the Hardy-Weinberg equation p + q = 1, implies (p + q)2 = 1 (since the organism under investigation is diploid). Therefore,
p2 + 2pq + q2 =1.
where p2 is the frequency of individuals with homozygotic dominant alleles, q2 is the frequency of individuals with homozygotic recessive alleles and 2pq represents frequency of individuals with heterozygotic alleles.
But q2 is also

(to study banding patterns according to Torre et al., 2012). Which implies that with the value of q, we can find the value of p; that is, p = 1 – q. Therefore, heterozygosity = 2pq (According to Hardy-Weinberg law).
Nuclear DNA analysis using 28s rDNA primers
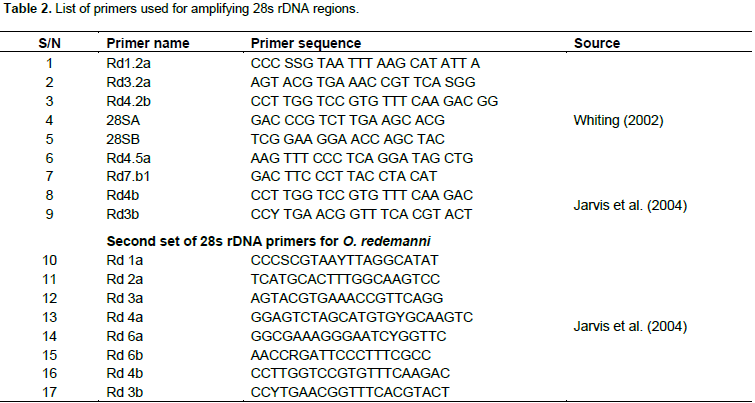
DNA isolated for the ISSR procedure was used in 28s rDNA amplification and the primers applied are shown in Table 2. The procedures employed to amplify the 28s rDNA regions, including the reaction mixture and its volume, were as specified by Whiting (2002) and Jarvis et al. (2004). Further, the amplified product was sequenced and the obtained sequence was submitted to secondary structure prediction software, according to Reuter and Mathews (2010). A similarity matrix, multiple sequence alignment, diversity indices and Neighbor joining tree were constructed using MEGA (ver. 7.0.14) program.
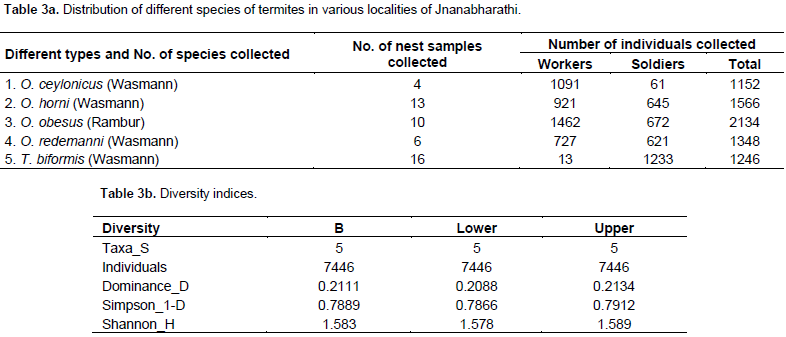
A total of five taxa were analysed using PAST software, with a total termite sample as follows: 4214 workers and 3232 soldiers, obtained from the Jnanabharathi campus. The mean Dominance value was 0.2111 with a range of 0.2088 (lower limit) and 0.2134 (higher limit). This result alone cannot be useful to predict species richness in a given area. Thus, Simpson’s index is calculated, which is 1-D. A mean value of 0.7889 was obtained, with 0.7866 at its lower limit and 0.7912 as its upper limit (Table 3a and b). The five species in the sample, identified based on morphological traits, were Trinervitermes biformis (Wasmann), Odontotermes horni (Wasmann), Odontotermes obesus (Rambur), Odontotermes ceylonicus (Wasmann) and Odontotermes redemanni (Wasmann). But T. biformis (Wasmann) soldier termites are bimorphic, based on the size and shape of the head. The soldiers of T. biformis (Wasmann) are divided into soldier-major and soldier-minor groups. The head is ovoid and a rostrum protrudes at the anterior.

At the posterior, the head is bulged. Whereas, the soldiers of O. obesus (Rambur) and O. redemanni (Wasmann) show a high level of morphological similarity, except in the mandibular index. Both have a convexly-curved head, or an oval-shaped head capsule, with weak convergence at the anterior. O. horni (Wasmann) is a larger species with total body length ranging from 7.37 to 10.05 mm. These are the most prevalent species found on tree galleries. They have a sub rectangular head with a thick, strong mandible. Similarly, O. ceylonicus (Wasmann) has a strong rectangular head with a strong mandible, but the body size is much smaller than O. horni (Wasmann) and slightly bigger than the other three species.
ISSR marker analysis
All five species and two unknown samples were subjected to ISSR marker analysis. A total of 244 visible and scorable bands were obtained. All the visible bands were scored into one (‘1’ for presence of a particular band with a specific band size) and zero (‘0’ for absence of a band at a particular band size corresponding to the other samples). There was only one monomorphic band obtained from the amplification. Thus a total of 98.72% polymorphism was observed from the ISSR profile. The scoring was recorded according to the band size based on the one kb ladder, which was loaded along with each amplification product in a separate well. The scoring was also analysed to calculate heterozygosity (Table 4a to c), Jaccard’s coefficient (Table 4d) and to construct a UPGMA tree (Figure 3). The amplification result reveals very little polymorphism between species. But with high resolution it is possible to differentiate even a 10 bp difference between the banding patterns. This led to observation of bands with more than 98% polymorphism. To get a clear idea of polymorphism, the gel was scored and tabulated (Table 4a).


According to the scoring, a consolidated data (Table 4b) was generated to study the banding pattern of the ISSR markers. There is only one monomorphic band in the ISSR11 marker at 380 bp. Among seven species, a maximum of six species shows monomorphic bands for the three markers, that is, ISSR02, ISSR04 and ISSR10 at 370, 430 and 520 bp, respectively. There were five lanes of bands at 350, 320 and 440 bp length products amplified using ISSR02, ISSR04 and ISSR10, respectively. The other two lanes were produced with the primer ISSR12 alone at 330 and 300 bp length with monomorphic bands for a maximum of five species (Figure 2A to F). There were about 14 lanes with a maximum of four species with monomorphic bands, whereas the other two did not match. Similarly, 42.86% of monomorphism (that is, a maximum of three species with monomorphic bands) were obtained at 16 different lanes; and two species with monomorphic bands were observed at 26 different lanes. This indicates that the level of monomorphism between the collected specimens is very low for the primers used in the amplification.
A total of 38 different positions show single bands with varying sizes. The single bands of maximum size were obtained for the primer ISSR12. Heterozygosity value plays a major role in finding the markers’ ability to detect polymorphism. Generally, for ISSR markers, the heterozygosity values range from 0.2 to 0.4. In the present study, heterozygosity values range from 0.2444 to 0.3366, where the highest value was scored by ISSR10 and the lowest value was obtained using the ISSR12 marker (Table 4c). The UPGMA tree was constructed based on the Jaccard’s coefficient values (Figure 3). Analysis of the tree indicates that O. redemanni (Wasmann) and O. obesus (Rambur) share 25% dissimilarity betweenthem. It is also observed that T. biformis (Wasmann) is in a separate cluster with a maximum of 44.8% dissimilarity among all of the identified and unidentified species (Table 4d).
Nuclear DNA analysis using 28s rDNA primers
Multiple sequence alignment
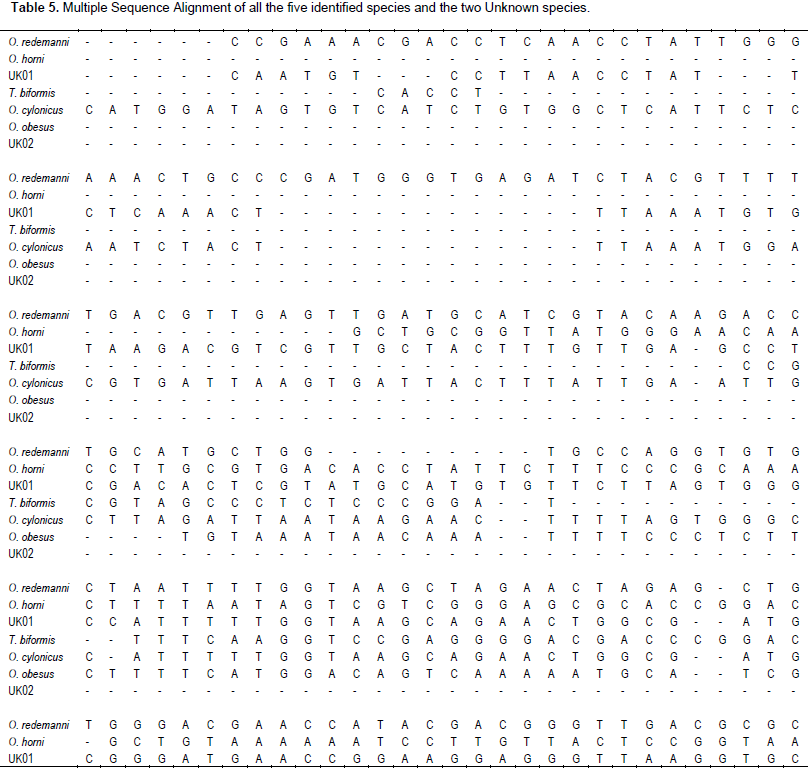
The forward and reverse sequences were combined to make single contig sequence for each species using the DNA Baser program. The number of nucleotides, Multiple Sequence Alignment (MSA), and nucleotide analysis was done by using MEGA software. O. ceylonicus (Wasmann), O. redemanni (Wasmann), O. horni (Wasmann), O. obesus (Rambur), T. biformis (Wasmann), UNKNOWN01 and UNKNOWN02 are the samples sequenced for both forward and reverse nucleotide sequences to create a single contig sequence. The final length of 849, 890, 753, 643, 728, 861 and 531 bp were obtained, respectively. These sequences were subjected to MSA using MEGA software, which revealed 1124 sites with a total of 74 conserved regions and a sum of 2618 regions of gaps among all the seven samples of termites. The results of MSA is tabulated in Table 5 where homology is marked with an asterisk (*) and the gaps are mentioned with a dash (-).


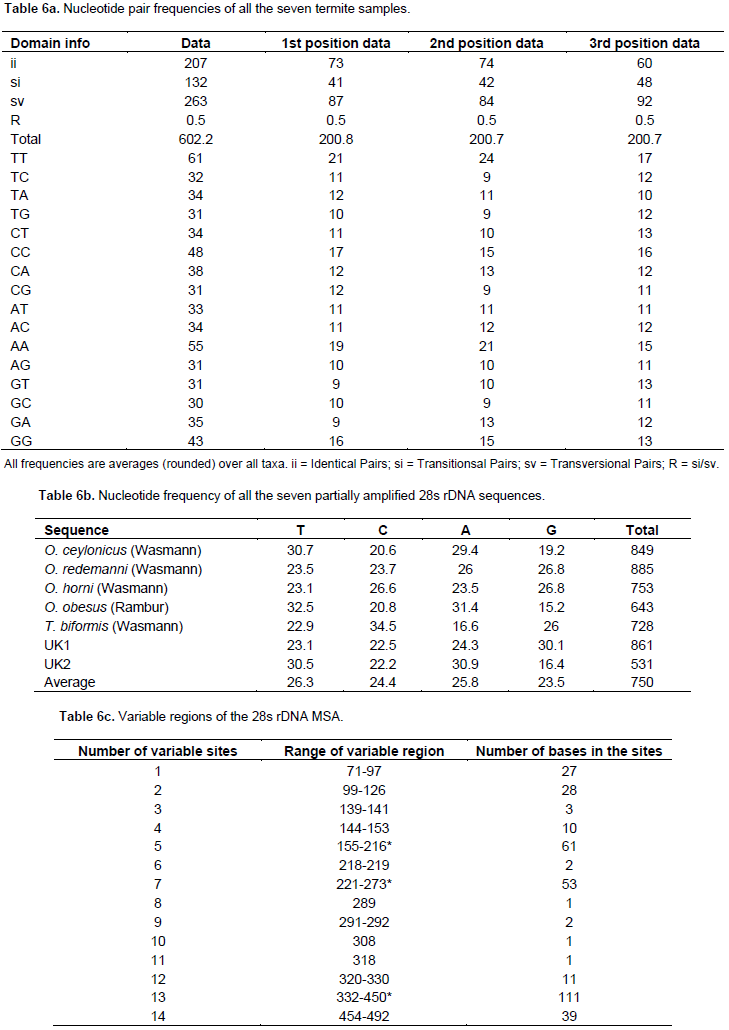
The nucleotide analysis (Table 6a) revealed that the average frequency of GC rich regions is 30 and those with AT is 33. The R value for the fraction of transitional (132) and transvertional (263) pairs were found to be 0.5, which is a moderate value. The identical pair number was found to be 207, which is the sum of MSA analysis of identical pair numbers at the first position (73); second position (74) and at third position (60). The highest sum value of 61 was obtained for the TT sequence frequency, followed by AA of about 55; CC of about 48, and GG of about 43. These ranges of frequencies are clearly represented in a pi-chart for detailed speculation in Figure 4. Nucleotide frequency of all the seven partially amplified 28s rDNA sequences discloses how much a perticular nucleotide appears in every species for a perticular gene.


It is clear that A+T is always higher than G+C in all the partially amplified 28s rDNA sequences, exccept in O. horni (Wasmann) and T. biformis (Wasmann) with a higher amount of G+C residues than A+T residues (Table 6b). The MSA of the entire seven termite samples also revealed 74 conserved regions (with only single nucleotide sites and few base stretches with many gaps) and 39 regions of variable sites. The variable sites are used to analyze the variable secondary structures of 28s rDNA. The bases beyond 50 nucleotides were considered for studying 28s rDNA structural variations and are highlighted in green colour (Table 6c). A maximum of 111 nucleotide variations and a minimum of single base variations were recorded. There were up to six variable sites beyond 50 bases and nine single nucleotide variations.
28s rDNA nucleotide sequence structure and its analysis
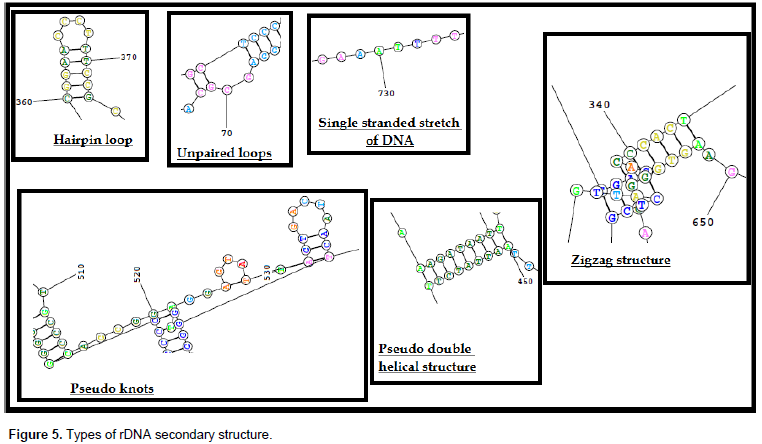
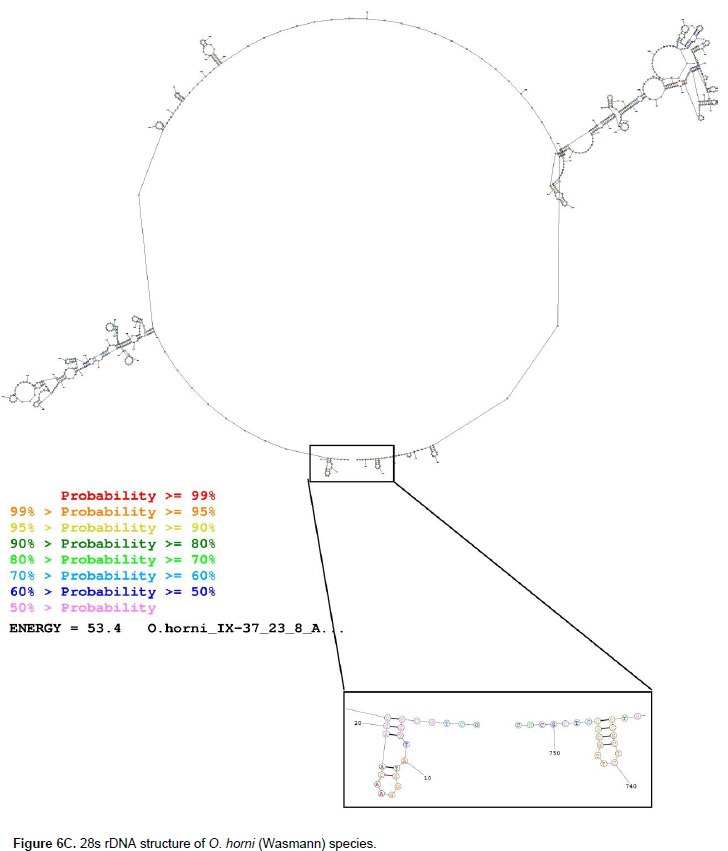
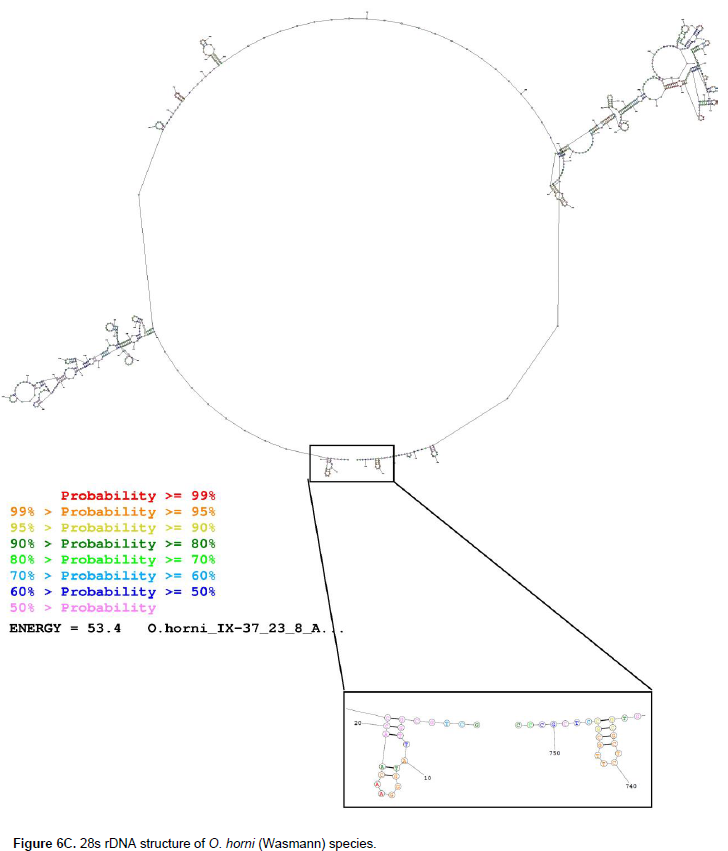
The nucleotide sequence of the 28s rDNA sequence was submitted to the Mathew online lab portal and the secondary structure of the partially amplified sequence of 28s rDNA gene was constructed. There are six different types of rDNA structure identified in the study (Figure 5). Primary structure consists of single stranded nucleotide bases; a hairpin loop is the most common type of secondary structure with pseudo double stranded forms with unpaired loops; zigzag conformers are tertiary structures with three dimensional orientation of the molecule; and lastly pseudo knots are similar to that of pseudo double-stranded structure, but the bonding is between the far located bases oriented spatially in a three dimensional way. The number of variable sites according to MSA, their relevant divergent regions on the amplified 28s rDNA sequence and the observed secondary structure are summarized in Table 7. O. ceylonicus (Wasmann) possesses nine hairpin loops, 10 single-stranded loops and eight pseudo knots (Figure 6A). Among the 39 variable sites, five variable sites were selected which were beyond 50 bases long. VS1 spans 71st base to 132nd base in O. ceylonicus (Wasmann) which had one single-stranded loop, one hairpin loop, two pseudo knot and pseudo double helical structure that was formed from the 97th base to 132nd base with 836th base to 811th base.


The marked VS2 ranged from 137th base to 189th base, which formed a pseudo double-stranded structure along with the 803rd base to 751st base. Similarly, the VS3 stretches from the 248th base to 363rd base with two hairpin loops and two pseudo knots; VS4 spans from 406th base to 483rd base where it is clear that there is a complex tertiary structure in this position with overlapping hairpin loops, unpaired strands and unpaired loops; VS5 started from the 562nd base to 646th base with a complex of a hairpin loop, single-stranded primary structure, pseudo double strand and unpaired loops; the last, VS6, which spans from the 679th base to 747th base as already mentioned formed a pseudo double-stranded structure with 258th base to 194th base. The 28s rDNA sequence secondary structure (Figure 6B) of O. redemanni (Wasmann) also showed divergence in the marked variable sites (according to MSA). At position VS1 from 74th base to 135th base there are two pseudo knots at the terminal position and two hairpin loops along with a long unpaired strand; position VS2, ranging from 140th base to 192nd base, where the initial length formed a part of pseudo knot along with position one.

There are three hairpin loops and a majority of the bases form single-stranded primary structure; VS3 starts from 206th base and ends at 324th base with five hairpin loops, two unpaired loops, one pseudo knot and a wide range of primary structure spanning between the loops; VS4 stretches from 369th nucleotide base to 450th base of the sequence, which starts as a part of a hairpin loop, two unpaired loops, four pseudo double-stranded structures, three stretches of primary structures in between them and ends by forming a part of a hairpin loop. Similarly, VS5 initiates with 526th base and ends with 616th base, which starts with a pseudo double-stranded structure with three dimensional orientation at 531st base with 539th base; it possesses three hairpin loops and two unpaired loops along with a pseudo double-stranded structure; and lastly the VS6 position extends from 684th base to 753rd base, which starts with a pseudo double-stranded structure for only a 2 base pair length, the sequence possesses three hairpin loops, and one more pseudo double-stranded structure interrupted by single stranded nucleotide sequences.
The secondary structure of O. horni (Wasmann) partially amplified 28s rDNA (Figure 6C) study shows variable structure at marked variable sites where the VS1 polymorphic site ranges from the 155th nucleotide base to 216th base with a single base pair structure with seven unpaired loops, two pseudo knots at 176th base and 193rd base; at VS2 stretching from 221st base to 273rd base of the structure with an unpaired base in a loop followed by a hairpin loop and a pseudo knot at the 220 to 240 range, along with single stranded stretch with two hairpin loops. At VS3 spanning from 274th base to 345th base with two base pair span of pseudo double stranded structure followed by a stretch of unpaired length of DNA with two hairpin loop stacked one above the other, the single stranded structure extended until 333 bases, and this is followed by a zigzag of tertiary structure, which extended beyond the 354th base.Similarly, the VS4, which stretches from 399th base to 474th base, is initiated with a two-base pair pseudo double helical structure followed by an unpaired loop until the 318th base, this is followed by two hairpin loops with unpaired loop within and single stranded span of DNA until the 471st base.
The VS5 extends from the 517th base to 595th base in O. horni (Wasmann), and has three pseudo knots, five pseudo double-stranded structures, three unpaired loops and two hairpin loops. At the end, the VS6 site starting from the 628th position to 690th base has six pseudo double-stranded structures, a zigzag structure along with variable position three, four unpaired loops and a very short stretch of single stranded DNA. O. obesus (Rambur) genomic 28s rDNA structure (Figure 6D) reveals that the VS1, whose length is from 37th base to 96th base, possesses two hairpin loops and stretches of unpaired nucleotides; VS2 from 101st base to 153rd base possesses one hairpin loop and one unpaired loop along with single-stranded stretches; VS3 starts with 164th base and ends with 267th base possesses a pseudo double-stranded structure, which starts at the 175th base through 179th base, and is complimented by base sequences from 211 to 214th, the sequence in between is folded into two hairpin loops and an unpaired loop.

This structure is followed by single-stranded stretches and two hairpin loops. Position VS4 starts from the 310th base to 390th base, and there is a hairpin loop followed by a single-stranded structure; in the stretch between the 326th base to 388th base, one can see two hairpin loops, two unpaired loops and one pseudo double-stranded structure. Position VS5 starts from the 433rd base to 511th base, where the first base is a part of a hairpin loop. This is brought about by the unpaired loop and a pseudo double-stranded structure starting from the 450th base to 459th base, which is followed by a single-stranded structure and a hairpin loop. The VS6 site starting from 564th base to 633rd base possesses a complex pseudo knot, along with two hairpin loop double-stranded structures and an unpaired loop; this is brought about by one more pseudo double-stranded structure.
The secondary structure of T. biformis (Wasmann) partially amplified 28s rDNA (Figure 6E) is similar to that of the other species. The VS1 spans from the 55th base to 114th base, which is part of a hairpin loop in a complex of five hairpin loops, three unpaired loops entangled with a few double-stranded structures oriented three dimensionally. The VS2, with a length stretching from the 119th base to 171th base, is also a part of a variable site one complex structure. VS3 spans from the 179th base to 297th nucleotide base, which shows a very complex spatial orientation with six unpaired loops, six hairpin loops, five pseudo double-stranded positions, and a few single stranded stretches in between the structures. Similarly the VS4, spanning from 348th base to 429th base, is part of a complex structure with simpler forms, it possesses two unpaired loops, two hairpin loops, four pseudo double-stranded structures and scattered single-stranded structures. VS5 stretching between the 520th base to 586th base possesses four hairpin loops, three64th base to 123rd base is part of an unpaired loop, followed by two pseudo double-stranded structures, two hairpin loops and one unpaired loop.


VS2 ranges from the 128th base to 180th base, where the 129th base binds with the 21st base. This is followed by a hair pin loop, a pseudo knot, pseudo double-stranded structure, single-stranded stretches and a complex three dimensional orientation of a pseudo double-stranded structure, two unpaired loops and a pseudo double-stranded structure. VS3 ranges from the 239th base to 357th base, which starts with a pseudo double-stranded structure, an unpaired loop and a hairpin loop; this is followed by wide stretches of single-stranded DNA, ten unpaired loops (few short and few long), three hairpin loops and three dimensionally oriented structures. The VS4 of UNKNOWN1 28s rDNA extending from base 403 to base 483 possesses an extremely complex three-dimensional structure with three hairpin loops, six unpaired loops, five pseudo double-stranded structures and a few pseudo knots. VS5 extends from the 526th base to 607th base, which starts from a hairpin loop followed by five pseudo knots, four hairpin loops, two unpaired loops, three pseudo double-stranded structures, and wide stretches of single stranded lengths oriented three dimensionally.
Similarly, VS6, which begins from the 642nd base to 711th base, starts from a hairpin loop, followed by three more hairpin loops, five unpaired loops and some three-dimensionally oriented single-stranded structures with pseudo double-stranded structures. The partially amplified 28s rDNA secondary structure of UNKNOWN02 (Figure 6G) was comparatively simpler as there was no three dimensional folding. The VS1 divergent site was not observed in this species. However, the VS2 divergent site started from base one to nucleotide base 30, which has a linear primary structure until the 30th base. The 30th base complementarily binds with the 149th base. The divergent site VS3 extends from base 31 to base 84; and it is clear that there are two hairpin loops, one unpaired loop and a long stretch of DNA in its primary structure.

The divergent site VS4, extending from base 127 to base 189, possesses three unpaired loops, complementary pairing with the 149th base to 30th base, and two pseudo double-stranded structures. The divergent site VS5, extending from base 307 to base 391, possesses one long and one short hairpin loop, along with a single-stranded and a double-stranded structure. The VS6 site, extending from the 426th base to 486th base, possesses seven unpaired loops, two hairpin loops, some spatially oriented, single-stranded structures, and pseudo double-stranded structures. It is to be noted that the description of the two dimensional structure of rDNA does not coincide with tabulated results, because the number of pseudo double helical structures and hairpin loops can mislead the count. Similarly, the region of single-stranded loops to that of primary structure can be misinterpreted. Thus, in Table 7, certain characters are represented as only present or absent, and not by numbers as described in the text.
Phylogenetic analysis based on 28s rDNA sequence
The 28s rDNA sequences of all the collected termite species were submitted to MEGA software analyses for constructing a Neighbor-Joining tree according to Saitou and Nei (1987). The optimal tree with a sum of branch length = 3.74020557 is shown (Figure 7). The tree is drawn to scale, with branch lengths (next to the branches) in the same units as those of the evolutionary distances used to infer the phylogenetic tree. The evolutionary distances were computed using the Maximum Composite Likelihood method (Tamura et al., 2004) and are in the units of the number of base substitutions per site. The analysis involved 7 nucleotide sequences. Codon positions included were 1st + 2nd + 3rd + Noncoding. All positions containing gaps and missing data were eliminated. There were a total of 336 positions in the final dataset. Evolutionary analyses were conducted using MEGA7 (Kumar et al., 2016). According to the cluster results (Figure 7) there are two main clusters: (1) O. redemanni (Wasmann), O. horni (Wasmann) and UNKNOWN01 forming one cluster; and (2) the rest, that is, T. biformis (Wasmann), UNKNOWN02, O. obesus (Rambur) and O. ceylonicus (Wasmann) in another group, accounting for 90% of evolutionary divergence.

There is a maximum of 10% divergence between UNKNOWN02 and cluster one, which includes O. obesus (Rambur) and O. ceylonicus (Wasmann). The divergence between O. obesus (Rambur) and O. ceylonicus (Wasmann) is about 50%. The divergence between O. redemanni (Wasmann) and cluster two, which includes UNKNOWN01 and O. horni (Wasmann) is about 80%. Similarly, the divergence between the O. horni (Wasmann) and UNKNOWN01 is 60%. Estimation of average evolutionary divergence of overall sequence pairs yielded a value of 1.293, and the number of base substitutions per site from estimation of coefficient of evolutionary differentiation is 1.73291 × 10⁸. The probability of rejecting the null hypothesis that sequences have evolved with the same pattern of substitution, was judged from the extent of differences in base composition biases between sequences according to the Disparity Index test (Kumar and Gadagkar, 2001). A Monte Carlo test (500 replicates) was used to estimate the P-values, which are shown below the diagonal (Table 8). P-values which are smaller than 0.05 are considered significant (marked with yellow highlights). The estimates of the disparity index per site are shown for each sequence pair above the diagonal.

Cumulative phylogenetic analysis
In the present study, three markers viz. morphological, ISSR banding pattern and 28s rDNA sequences are used for analyzing the genetic divergence between the identified and unidentified termite samples. As there were no soldiers among the unidentified termite samples, they were not identified morphologically and there is no morphological data for the same. Furthermore, the investigation of these samples was carried out in an integrated approach. All of the three marker data were combined by converting the data into zeros and ones. The morphological data was converted into binary codes by using Tukey Kramer test results, ISSR banding pattern was scored in binary fashion and the sequences of all the species (both identified and unidentified) were coded into binary digits by using an algorithmic logic. Here A (Adenine) bases were coded as 10, G residues (Guanine) as 11, C bases (Cytosine) as 00 and lastly T (Thymine) was coded as 01. Latter from this generalized data the common similarity matrix using Jaccard coefficient followed by construction of UPGMA dendrogram using Jaccard similarity matrix along with bootstrap values and Cophenetic Correlation Coefficient values were calculated using online statistical software (http://genomes.urv.cat/UPGMA/index.php).
The online package generated 100 bootstrap replicates from 1205 variable in each of five rows and among them the best dendrogram was selected with highest Cophenetic Correlation Coefficient value. The obtained dendrogram was strikingly similar to that of the morphological analysis, which involved binary scoring using a Tukey-Kramer test. The termite species T. biformis (Wasmann) formed the first cluster with 35.7% of dissimilarity between the other species. O. obesus (Rambur) and O. redemanni (Wasmann) shared 1.3% dissimilarity and O. horni (Wasmann) shared 1.5% dissimilarity with O. ceylonicus (Wasmann). These two groups shared 1.7% of dissimilarity. The Cophenetic Correlation Coefficient value was 0.85, which is the highest among the 100 bootstrap replicates generated by the online program.
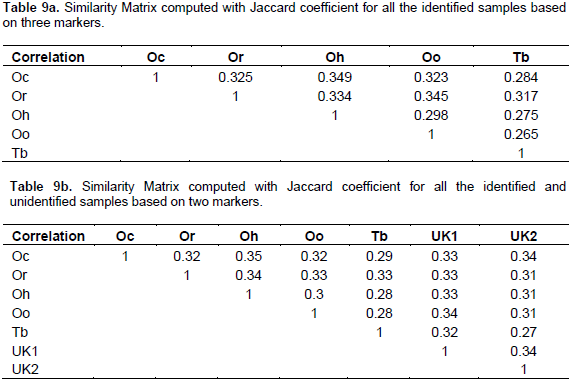
The Jaccard similarity matrix (Table 9a) specifies a highest similarity value of 0.349 between O. horni (Wasmann) and O. ceylonicus (Wasmann).
Similarly, the lowest value was recorded between T. biformis (Wasmann) and O. obesus (Rambur) with 0.265. Thus T. biformis (Wasmann) is an out group in the cluster and O. redemanni (Wasmann) shows maximum similarity with O. obesus (Rambur) with about 0.345. The same online package was utilized to generate the similarity matrix using a Jaccard coefficient analysis. The dataset of 7 rows with 1165 variables in each row was analysed, which included only the binary codes of sequence and the binary scoring of ISSR markers. The similarity matrix (Table 9b) suggests a maximum of 33% similarity between T. biformis (Wasmann) and O. redemanni (Wasmann). O. obesus (Rambur) shows 33% similarity between O. redemanni (Wasmann) and 34% similarity between UNKNOWN01. O. redemanni (Wasmann) shows a maximum of 34% similarity with O. horni (Wasmann). A maximum similarity value was recorded between O. horni (Wasmann) and O. ceylonicus (Wasmann); and the least value was recorded by UNKNOWN02 with T. biformis (Wasmann), with about 27% similarity.

The similarity matrix calculated, based on Jaccard’s coefficients, was used to construct a UPGMA tree (Figure 9) with the highest Cophenetic Correlation Coefficient value of about 0.72 among 100 bootstrap replicates. The guided-tree construction reveals that there are three clusters, among which T. biformis (Wasmann) forms the first out group with a maximum of about 35.3% similarity with the rest of the species. The next group includes O. redemanni (Wasmann), O. obesus (Rambur) and UNKNOWN01. O. redemanni (Wasmann) shows about 33.4% of similarity with O. obesus (Rambur) and UNKNOWN01 together. And lastly, O. obesus (Rambur) shows 32.8% of similarity with UNKNOWN01. Similarly, the third group which includes UNKNOWN02, O. horni (Wasmann) and O. ceylonicus (Wasmann) shows 34% of similarity with the second group (Figure 8). UNKNOWN02 recorded 33.6% of similarity with O. horni (Wasmann) and O. ceylonicus (Wasmann); and O. horni (Wasmann) shows a maximum of 32.6% of similarity with O. ceylonicus (Wasmann).

The diversity index values reveal that termite species richness is quite high, or extending to about average;
whereas, Shannon-H index with a mean value of 1.583 (1.578 lower limit and 1.589 upper limit) indicated an average species richness in the given locality. Shannon-H indices are weaker as it is difficult to compare communities which differ greatly in richness (Magurran, 2010). Thus, accordingly, the use of Simpson’s 1-D value is critical in this study making it more accurate for the present data (Table 3a and b). Among the 57 termite nests where samples were collected, five genotypes each of different species along with two unidentified samples were considered for the DNA fingerprinting study. The study includes 17 ISSR primers among which only six primers were considered since they produced visible scorable bands. The six primers produced 103 bands, which were 99.03% polymorphic. Morphologically, O. obesus (Rambur) and O. redemanni (Wasmann) share more than 50% of similarity. Generally, they pose difficulty in differentiating them morphologically (Pranesh and Harini, 2014). Similar results were obtained when these two species were subjected to DNA fingerprinting using ISSR markers.
The ISSR analysis has many advantages over other markers such as: it targets microsatellite DNA sequences that are abundant throughout the eukaryotic genome that evolve rapidly, and it also includes amplification of specific repeatable fragments (Godwin et al., 1997; Sheppard and Smith, 2000). Similar results were obtained in this study between unknown samples and known species. The amplification using ISSR markers revealed a total of 103 visible bands among which 102 were polymorphic. The basic analysis of the banding pattern (Table 4a to d) revealed that of 103 amplified loci, ISSR11 produced one monomorphic band of size 380 bp, apart from which, all of the amplified loci were polymorphic between the species. This implies that ISSR is an excellent marker for studying genetic variations between and among the species. The banding pattern shows 12 monomorphic bands between UNKNOWN01, UNKNOWN02 and O. cylonicus (Wasmann) and 35 commonly missing bands, which are reported to be present in other species of the present study.
This suggests that there is a high similarity between the three samples and also that they might be the same species; but because the nests are located far apart, there is some inbreeding, which shows polymorphism between the three samples. This theory has to be supported further by sequence similarity or by bar coding. A similar kind of banding pattern was observed between same species of honey bees that showed different levels of tolerance to mites (Al-Otaibi, 2008). Each polymorphic fragment was scored as a locus with two allelic classes (either as absence or presence of a band or dominant allele); therefore, the maximum heterozygosity value of an ISSR locus was 0.5. The average heterozygosity recorded is 0.2788. The heterozygosity ranges from 0.244 to 0.3366. The low heterozygosity value indicates that there is likely high inbreeding within the population, and also the species observed in this study are relatively diverse for the markers used in this study. Similar results were observed in honey bees, which are also inbreeding species like that of termites (Al-Otaibi, 2008).
The obtained DNA profile indicates that the ISSR technique is a useful method for detecting genetic diversity among the termite species. The wide distribution of microsatellite DNA across the genome, combined with the easiness of detecting polymorphic loci using ISSR markers, gave the system great potential in studying termite genetic diversity. The genotyping of 6 shortlisted ISSR markers was used to discriminate among the colonies for the above purpose. Since five samples were collected from each species for the study, it is difficult to identify species specific bands; but from the result it can be observed that the two unknown samples share a common banding pattern to that of O. ceylonicus (Wasmann). The ISSR primer ISSR02 produced bands of size 550, 510, and 370 bp. ISSR04 produced bands of size 430 and 320 bp. ISSR06 produced 480 and 380 bp products. ISSR10 produced 600 and 580 bp products. And ISSR11 produced 470, 420 and 380 bp products, which showed 100% monomorphism between the two unknown samples and O. ceylonicus (Wasmann). ISSR12 recorded zero monomorphic bands with these three samples.
ISSR12 shows maximum dissimilarity between these three samples and also with other species observed in this study. Similar results were obtained in many plant cultivars and other species, which are used for breeding purposes as reported in the next paragraph with details. ISSRs serve as potential markers for identifying both inter species variance and intra species variance. Genetic polymorphism has been reported in a broad range of taxa including: Corchorus spp. (Javan et al., 2012), Silva genus (Garriga et al., 2013), for indexing blueberry cultivars (Berezovskaia et al., 2003), Ipomoea species (Moulin et al., 2012), Bombinae species (Liu and Wendel, 2001), Apis mellifera species and their breeding colonies (Al-Otaibi, 2008), Cotton cultivars (Bornet, 2002), and Brassica oleracea species (Korman, 1991). These, and many other species whose inter- and intra-specific banding pattern can be easily examined using ISSR markers, can be effectively used for research on breeding, diversity study, detecting polymorphism and identifying similarities between and within the species.
The similarity matrix in Table 9a and b was computed with Jaccard’s coefficients, using the scored data obtained from the ISSR marker banding pattern. The average similarity coefficient value is 0.235; the lowest similarity value of 0.043 was recorded between UNKNOWN02 and T. biformis (Wasmann). Highest similarity coefficient value (0.404) was recorded between UNKNOWN02 and O. ceylonicus (Wasmann). These values specify that genetic similarity between the samples is very low and also the diversity is very high with respect to the repetitive sequences in the genome. A UPGMA rooted phenogram (Figure 8) also was constructed using Jaccard’s similarity coefficients based on scored data obtained from six ISSR primers for seven genotypes. The cophenetic correlation value was 0.90, which makes the UPGMA cluster highly reliable (Carr, 1999; Lander and Botstein, 1989). The first two groups in the dendrogram share 44.8% of similarity with T. biformis (Wasmann). This specifies that T. biformis (Wasmann) belongs to a separate genus and supports the morphological identification methodology.
The cluster group one composed of O. redemanni (Wasmann), O. obesus (Rambur) and O. horni (Wasmann) species, shares 39% of similarity with cluster group two, which includes O. ceylonicus (Wasmann), UNKNOWN02 and UNKNOWN01. In group one, O. redemanni (Wasmann) and O. obesus (Rambur) share 32.9% of similarity with O. horni (Wasmann), Moreover, for O. redemanni (Wasmann) and O. obesus (Rambur) there is 25% of similarity. For the similarly in group two, O. ceylonicus (Wasmann) and UNKNOWN02 share 35.6% of similarity with UNKNOWN01; and for O. ceylonicus (Wasmann) and UNKNOWN02 there is 29.8% similarity. In this study, very high percentage of polymorphic bands was obtained (99.03%), suggesting that there is a high diversity in Inter Sample Sequence Repeats among the termite species. The repetitive DNA sequences can be used to produce species specific markers, which aids in robust detection of termite species. The percentage of polymorphism indicates that the marker is efficient enough to detect polymorphism; but due to its average reproducibility, the marker has less application in molecular biology compared to other molecular markers. The study suggests that these polymorphic bands are not only useful to study the genetic relatedness between the termite samples but also serves as useful tools for genetic marker analysis.
Nucleotide analysis of partially amplified 28s rDNA sequence of seven termite samples
Generally mtDNA serves as a very good tool for studying population genetics, due to variability in intraspecificity (Hassouna et al., 1984). But, 28s rRNA sequences can also be used to analyse the same since they have a wide range of structural polymorphism (Yeap et al., 2010). Various researchers around the world used both mitochondrial and nuclear markers to confirm phylogenetic relationships between termite species, which are likely to be synonymous. In this study, O. obesus (Rambur) and O. redemanni (Wasmann) show strikingly similar morphological features, but they are not synonymous species, such as the known synonyms: Reticulitermes flavipes and Reticulitermes santonensis. Thus, we need a strong basis to prove this statement. In this regard, there are 3 markers viz., morphological, ISSR and 28s rDNA sequences that may prove to be useful. Apart from this, the study also provides an initiative to understand nuclear genes in finding out variations between known and unknown species.
Even though it is well understood that the mitochondrial COI gene is useful to identify insect species, the 28s rDNA is used in this study to determine the genetic difference between species based on nuclear gene polymorphism and not just to identify possible species differences based on DNA Bar coding. The nucleotide pair analysis (Table 6a) revealed that the average frequency of GC rich regions is 30, and that of AT is 33. The R value for the fraction of transitional (132) and transvertional (263) pairs was found to be 0.5, which is a moderate value. The identical pair number was found to be 207, which is the sum of MSA analysis of identical pair numbers at first position (73); second position (74) and position three (60). The highest sum value of 61 was obtained for the TT sequence frequency followed by AA of about 55; CC of about 48 and GG of about 43. These ranges of frequencies are clearly represented in a pi-chart for detailed inspection (Figure 4). In Table 6b, nucleotide frequencies of all seven sequences are tabulated.
The average nucleotide frequency of all the 7 samples yielded A+T of about 52.1% and G+C of about 47.9%, which specifies that A+T content is more than that of G+C. Similar results were obtained between three genera, viz., Microcerotermes, Microtermes and Odontotermes by Singla et al. (2013) using 12s rRNA and mtDNA genes. Likewise, A+T contents were found to be higher than G+C content (Austin et al., 2005a). In the present study, MSA led to the identification of 39 variable sites, among which 6 sites were beyond 50 bases long and 9 single nucleotide variable regions were identified. The results are in accordance with Austin et al. (2005b) and Pei et al. (2010), where mtDNA for 47 haplotypes were observed, which belonged to Reticulitermes flavipes (Kollar) of North America. They also noted an ITS2 region, which was helpful to resolve phyletic relationships between 10 Reticulitermes haplotypes that were not fully resolved by using nuclear markers.
Secondary structural analysis of partially amplified 28s rDNA sequences of all seven termite samples
The 28s rDNA is a nuclear gene of eukaryotes, which can be used to study the genetic makeup and relatedness between and within species. The intra and inter species variation can be documented with a much better accuracy when comparisons of secondary structure models are taken into account than by sole sequence alignment. The sequence regions within interrupted sequence alignments, a number of conserved secondary structure features can however be identified in all species which improves the mapping of the size-variable segments (Yeap et al., 2010). In the present study, MSA of the entire seven termite sample analysis revealed 74 conservative regions (with only single nucleotide sites and a few base stretches with many gaps) and 39 regions of variable sites. These 39 variable sites were considered for the identification of the 28s rDNA secondary structure variations. The scenario is completely different in the Pei et al. (2010) study related to secondary structure of 16s rRNA gene in prokaryotes of both Archaea and Eubacteria.
The study reported here identified 6.7% of conserved regions among the species and these conserved regions were considered to construct secondary structure of the ribosomal subunit 16s. By studying the conserved regions one can identify the species but by considering the variable regions genetic diversity can be acknowledged (Chakravorty et al., 2007; Yu et al., 2013). Termite 28s rDNA structural variation studies have not taken place until now, because the tool has wider applications in microorganisms and fungi identification than in insects. Thus, although one can find literature for 28s rDNA sequences on termites, it is very rare to find literature on its structure. The present study focuses on the sequence variation and its structural diversity among termites. Yu et al. (2013) have used length variable regions (LVRs) for comparing the secondary structural variations among Eurydema maracandica species for both 18s and 28s rRNA. The LVRs based on the domain amplicons of both 18s and 28s rRNA sequences of the specific monophyletic species served as a good tool for studying morpho-molecular structures (Ouvrard et al., 2000; Scharf et al., 2005).
Similarly, in this study as the domain markers are used for amplification of the variable sites, MSA suffices as a good tool for identifying morpho-molecular structures between the species. From a total of 39 variable sites among all the seven samples, six variable sites were considered as the lengths were more than 50 bases, while six types of secondary structures were observed. These structures are present in variable number at variable positions across six variable sites. For example, O. redemanni (Wasmann) is morphologically very much similar to that of O. obesus (Rambur); the secondary structure of these two species at VS1 shows 3-D structures and Pknot structures in the former, but absent in the latter. Also, one can observe in both species that single-stranded loops and pseudo double-stranded structures are absent, and hairpin loops are two in number though the length varies at the VS1 position.
Similarly, in species O. ceylonicus (Wasmann) and O. horni (Wasmann) (which are morphologically similar), the first three components vary and last four components are similar between each other at VS1. The pattern of structural similarity between T. biformis (Wasmann) and the rest of the species is strikingly different, justifying that T. biformis (Wasmann) is an out group. Interestingly, the two unknown species are also different from one another in the pattern of secondary structures. UNKNOWN01 is more similar to that of O. ceylonicus (Wasmann) and UNKNOWN02 is more similar to that of O. obesus (Rambur), though with variable sequence length.
Phylogenetics and evolutionary divergence
The evolutionary relatedness between/within termite species based on mitochondrial genes (16s, 18s, COI, etc.) is a well-studied area (Kambhampati and Eggleton, 2000). But evolutionary relatedness using ribosomal nuclear markers is less, because these markers are not used for identification of insects or studied for their expression sites (Jenkins, 2001). But in the present study, aiming at genetic diversity between termite species, nuclear sequence comparison plays a vital role, and the 28s rDNA sequence was easily available for this purpose. The obtained sequence was analysed using MEGA7 software to construct a Neighbor-Joining tree based on the Maximum Composite Likelihood Method (Tamura et al., 2004). The cluster (Figure 7) shows T. biformis (Wasmann) with some similarity with O. ceyloncus (Wasmann) and O. obesus (Rambur). Similarly, O. redemanni (Wasmann) shows similarity with O. horni (Wasmann) by forming a group.
The result, however, is not in accordance with either ISSR marker analysis or Morphological analysis. The probability of rejecting the null hypothesis that sequences have evolved with the same pattern of substitution, as judged from the extent of differences in base composition biases between sequences, was established according to a Disparity Index test (Kumar and Gadagkar, 2001). A Monte Carlo test (500 replicates) was used to estimate the P-values. P-values, which are smaller than 0.05 are considered significant (marked with yellow highlights) (Table 8). The estimates of the disparity index per site are shown for each sequence pair above the diagonal. This analysis allows us to check the significance between a pair of sequences and compare the phylogenetic result obtained from Maximum Likelihood Method (Aanen et al., 2002; Inward et al., 2007).
Cumulative phylogenetic analysis of the five identified termite species
Cumulative or comprehensive analysis is the most effective tool to identify genetic divergence. This comprehensive analysis generally includes morphological, anatomical, biochemical and nucleic acid variations to generate comparatively a more accurate consolidated phylogenetic tree than cladistic trees generated by individual markers (Inward et al., 2007). The present cumulative analysis includes binary morphological scorings, ISSR scorings and nucleotide sequences in binary codes. These three markers can be applied to only the five identified termite species as the two unknown species was devoid of any soldier termites during sampling. The binary codes of morphological, ISSR and 28s rDNA sequences of five identified species were subjected to online phylogenetic analysis. The online package generated 100 bootstrap replicates and the best phylogenetic tree was selected based on the maximum Cophenetic Correlation Coefficient value (Carr et al., 1999; Lander and Botstein, 1989).
The phylogenetic tree, generated by using a Jaccard similarity matrix (Table 9a), is in accordance with morphological analysis using a Tukey-Kramer test. T. biformis (Wasmann) forms an out group with 35.7% of dissimilarity compared to the other species. O. obesus (Rambur) and O. redemanni (Wasmann) share the same cluster with 32.7% of dissimilarity; similarly, O. ceylonicus (Wasmann) and O. horni (Wasmann) share a maximum of 32.5% of dissimilarity (Figure 9). In Inward et al. (2007), the largest taxa Termitidae of Isoptera was clearly segregated phyletically with wide acceptance by studying its comprehensive characteristics like termite worker gut morphology, mandible morphology and COII gene sequence analysis. Similar work by Jarvis et al. (2004) on earwigs indicates that the epizoic Hemimerus is not sister to the remaining Dermaptera, but rather nested as sister to Forficulidae and Chelisochilisochidae. The study included large subunit ribosomal (28S), small subunit ribosomal (18S), histone-3 (H3) nuclear DNA sequences, and forty-three morphological characters.

Cumulative phylogenetic analysis of the five identified and two unidentified termite species
During the genetic diversity study, there were two unidentified termite samples due to non-availability of soldiers in the samples. These two samples were also considered for generating cumulative/comprehensive analysis while excluding morphological data (because the morphological data was generated based on the soldiers external morphology). Similarity matrix was generated according to Jaccard coefficients to generate 100 bootstrap replicates and the one with maximum Cophenetic Correlation Coefficient value was selected to construct a UPGMA tree. The guided tree was very much similar to the results obtained by ISSR marker analysis, secondary structural pattern of 28s rDNA and its sequence analysis. T. biformis (Wasmann) was noted as an out group in the guided tree, UNKNOWN01 had more similarity with O. obesus (Rambur) and O. obesus (Rambur) in turn showed high similarity with that of O. redemanni (Wasmann). UNKNOWN02 was found to cluster along with O. ceylonicus (Wasmann) and O. horni (Wasmann). Similarly, Forschler and Jenkins (1999) resolved inconsistencies and published a taxonomic revision of subterranean termites and along with its complicated taxonomic keys by using a multidisciplinary approach based on behavioral, ecological, chemo-taxonomical and genetic data.
This study included 54 termite nest samples with five identified species and two unknown species. The study at Jnanabharathi campus gives insight into the termite distribution pattern. The genetic diversity, using 6 ISSR markers on five morphologically identified species and two unidentified species, revealed a total of 103 visible bands among which 102 were polymorphic. The banding pattern shows 12 monomorphic bands between UNKNOWN01, UNKNOWN02 and O. cylonicus. The heterozygosity values ranged from 0.244 to 0.3366. The average similarity coefficient value was 0.235. The similarity coefficient and heterozygosity values specify that genetic similarity between the samples is very low and also the diversity is very high with respect to the repetitive sequences in the genome. The cophenetic correlation value was found out to be 0.90 for the constructed UPGMA cluster. The highlights of the UPGMA tree are 25% of similarity between O. redimanii and O. obesus. Likewise, the similarity between O. cylonicus and UNKNOWN02 is 35.6%. The similarity between UNKNOWN01 and O. cylonicus along with UNKNOWN02 is 29.8%. The study reveals a very high percentile (99.03%) of the polymorphic bands and suggests that there is a high diversity in inter simple sequence repeats among the termites.
These repetitive DNA sequences can be used to produce species-specific DNA markers, which aids in robust detection of termite species. The nucleotide analysis of five known and two unknown species for the 28s rDNA gene revealed comparatively more A+T content than that of G+C. except in O. horni and T. biformis. A total of 39 variable sites, 74 conservative sites and a sum of 2618 gap regions among 1124 sequence length were obtained after MSA. The sequence was analysed to generate secondary structure with least energy, which generated a total of six types of secondary structures that varied for each species. The variable sites of MSA were used to analyse the pattern of secondary structures. The pattern of secondary structure was similar between O. obesusi and O. redemanni; as well as between O. ceylonicus and O. horni. Likewise, the two unknown species UNKNOWN01 and UNKNOWN02 showed similarity towards O. obesus and O. ceylonicus, respectively; whereas, T. biformis exhibited very little structural similarity between the species at variable sites.
The sequence was also analysed to generate a phylogenetic tree, which was not in accordance with morphological or ISSR marker analysis. The cluster analysis (Figure 7) shows T. biformis (Wasmann) with some similarity with O. ceyloncus (Wasmann) and O. obesus (Rambur). Similarly, O. redemanni (Wasmann) shows similarity with O. horni (Wasmann) by forming a group. All the data obtained were analysed for genetic diversity by pooling the coded binary digits. This data was submitted to generate two guided trees one with all the three markers, viz., morphological, ISSR and nucleotide sequence, and the other without morphological data, as two unknown species should also be considered for analyzing its genetic divergence and similarity between the other identified samples. In the first guided tree, T. biformis (Wasmann) is out grouped with 35.7% of dissimilarity with other species; O. obesus (Rambur) and O. redemanni (Wasmann) share the same cluster with 32.7% of dissimilarity.
Similarly, O. ceylonicus (Wasmann) and O. horni (Wasmann) share a maximum of 32.5% of dissimilarity. Similarly, in the second guided tree T. biformis (Wasmann) was noticed as an out group in the guided tree; UNKNOWN01 had more similarity with O. obesus (Rambur), and O. obesus (Rambur) in turn showed high similarity with that of O. redemanni (Wasmann). UNKNOWN02 was found to cluster along with O. ceylonicus (Wasmann) and O. horni (Wasmann). These results were in accordance with morphological, ISSR and secondary structural patterns found between the identified and unidentified species. Thus, the cumulative or comprehensive analysis using different markers, like morphological, ISSR and nuclear genes like 28s rDNA, depicts an accurate measure of genetic diversity between different species of termites. The results of this research also suggest to use different markers for the analysis of different species, and the impact of change in environment on the genetic diversity or even genetic structure of the species, because termites as used in this study are an excellent bio indicator.
The authors have not declared any conflict of interests.
The authors are thankful to the Department of Zoology and also Centre for Applied Genetics, Bangalore University, Bengaluru for providing the laboratory facilities to carry out this research.
REFERENCES
|
Aanen DK, Eggleton P, Lefèvre CR, Frøslev TG, Rosendahl S, Boomsma JJ (2002). The evolution of fungus-growing termites and their mutualistic fungal symbionts. Proceed. Nat. Acad. Sci. 99(23):14887-14892.
Crossref
|
|
|
|
Al-Otaibi SA (2008). Genetic variability in mite-resistant honey bee using ISSR molecular markers. Arab J. Biotechnol. 11(2):241-252.
|
|
|
|
|
Austin JW, Szalanski AL, Scheffrahn RH, Messenger MT (2005a). Genetic variation of Reticulitermes flavipes (Isoptera: Rhinotermitidae) in North America using the mitochondrial rRNA 16S gene. Ann. Entomol. Soc. Am. 98(6):980-988.
Crossref
|
|
|
|
|
Austin JW, Szalanski AL, Scheffrahn RH, Messenger MT, Dronnet S, Bagne`Res AG (2005b). Genetic Evidence for the Synonymy of Two Reticulitermes Species: Reticulitermes flavipes and Reticulitermes santonensis. Ann. Entomol. Soc. Am. 98(3):395-401.
Crossref
|
|
|
|
|
Bechly G (2007). Isoptera: termites. In (D.M. Martill, G. Bechly, and R.F. Loveridge editors), The Crato fossil beds of Brazil:window into an ancient world. New York: Cambridge University PRESS, 16:249-262.
|
|
|
|
|
Berezovskaia OP, OIu M, Sidorenko AP (2002). Intra- and interspecies differences in the ISSR-PCR patterns of bumble bee (Hymenoptera: Bombinae). Tsitol Genet. 36(3):28-35.
|
|
|
|
|
Bornet B, Muller C, Paulus F, Branchard M (2002). Highly informative nature of inter simple sequence repeat (ISSR) sequences amplified using tri- and tetra-nucleotide primers from DNA of cauliflower (Brassica oleracea var. botrytis L.). Genome 45:890-896.
Crossref
|
|
|
|
|
Carr DB, Young CJ, Aster RC, Zhang X (1999). Cluster analysis for CTBT Seismic Event Monitoring. Retrieved from
View.
|
|
|
|
|
Chakravorty S, Helb D, Burday M, Connell N, Alland DA (2007). Detailed analysis of 16S ribosomal RNA gene segments for the diagnosis of pathogenic bacteria. J. Microbiol. Methods 69(2):330-339.
Crossref
|
|
|
|
|
Chauhan T, Rajiv K (2010). Molecular markers and their applications in fisheries and aquaculture. Adv. Biosci. Biotechnol. 1:281-291.
Crossref
|
|
|
|
|
Chhotani OB (1997). The Fauna of India and Adjacent Countries: Isoptera (Termites) (Volume-II Family Termopsidae). Zoological Survey of India.
|
|
|
|
|
Dusinsky R, Kúdela M, Stloukalova V, Jedlicka L (2006). Use of inter-simple sequence repeat (ISSR) markers for discrimination between and within species of blackflies (Diptera:Simuliidae). Biologia, Bratislav 61(3):299-304.
Crossref
|
|
|
|
|
Eggleton P (2001). Termites and trees:a review of recent advances in termite phylogenetics. Insect Soc., Springer 42:187-193.
|
|
|
|
|
Eggleton P (2010). An Introduction to Termites: Biology, Taxonomy and Functional Morphology. (Biology of Termites: A Modern Synthesis 1st ed. Editors Bignell D. E., Roisin Y. and Lo N.). Dordrecht:Springer., pp. 1-26.
Crossref
|
|
|
|
|
Fang DQ, Roose ML (19970. Identification of closely related citrus cultivars with inter-simple sequence repeat markers. Theor. Appl. Genet. 95:408-417.
Crossref
|
|
|
|
|
Garriga M, Parra PA, Caligari PDS, Retamales JB, Carrasco BA, Lobos GA, Garci’a-Gonza’les R (2013). Application of inter-simple sequence repeats relative to simple sequence repeats as a molecular marker system for indexing blueberry cultivars. Can. J. Plant Sci. 93:913-921.
Crossref
|
|
|
|
|
Godwin ID, Aitken EA, Smith LW (1997). Application of inter simple sequence (ISSR) markers to plant genetics. Electrophoresis 18:1524-1528.
Crossref
|
|
|
|
|
Hassouna N, Michot B, Bachellerie JP (1984). The complete nucleotide sequence of moose 28S rRNA gene. Implications for the process of size increase of the large snbnnit rRNA in higher eukaryotes. Nucleic Acids Res. 12(8):3563-3583.
Crossref
|
|
|
|
|
Husseneder C, Grace JK (2001). Similarity is Relative: Hierarchy of Genetic Similarities in the Formosan Subterranean Termite (Isoptera: Rhinotermitidae) in Hawaii. Environ. Entomol.30(2):262-266.
Crossref
|
|
|
|
|
Inward DJG, Vogler AP, Eggleton P (2007). A comprehensive phylogenetic analysis of termites (Isoptera) illuminates key aspects of their evolutionary biology. Mol. Phylogenet. Evol. 44:953-967.
Crossref
|
|
|
|
|
Jarvis KJ, Haas F, Whiting MF (2004). A phylogeny of earwigs (Insecta:Dermaptera) based on molecular and morphological evidence reconsidering the classification of Dermaptera. Syst. Entomol. 30:1-12.
|
|
|
|
|
Javan ZS, Rahmani F, Heidari R (2012). Assessment of genetic variation of genus Salvia by RAPD and ISSR markers. Aust. J. Crop Sci. 6(6):1068-1073.
|
|
|
|
|
Jenkins TM, Dean RE, Verkerk R, Forschler BT (2001). Phylogenetic analysis of two mitochondrial genes and one nuclear intron region illuminate European subterranean termite (Isoptera: Rhinotermitidae) gene ßow, taxonomy, and introduction dynamics. Mol. Phylogenet. Evol.20:286-293.
Crossref
|
|
|
|
|
Kambhampati S, Eggleton P (2000). Phylogenetics and taxonomy, Termites: Evolution, Sociality, Symbioses, Ecology. (T Abe, D E Bignell and M Higashi eds.) Kluwer Academic Publishing Dordrecht., pp. 1-23.
|
|
|
|
|
Korman AK, Pashley DP, Haverty MI, La Fage JP (1991). Allozyme relationship among cuticular hydrocarbon phenotypes of Zootermopsis species (Isoptera: Termopsidae). Ann. Entomol. Soc. Am. 84(1):1-9.
Crossref
|
|
|
|
|
Krishna K, Grimaldi DA, Krishna V, Engel MS (2013). Treatise on the Isoptera of the world. Bull. Am. Museum Nat. Hist. 377(1-7):1-2704.
|
|
|
|
|
Kumar S, Gadagkar SR (2001). Disparity Index: A simple statistic to measure and test the homogeneity of substitution patterns between molecular sequences. Genetics 158:1321-1327.
|
|
|
|
|
Lander ES, Botstein D (1989). Mapping Mendelian Factors Underlying Quantitative Traits Using RFLP Linkage Maps. Genetics 121:185-199.
|
|
|
|
|
Liu B, Wendel JF (2001). Intersimple sequence repeat (ISSR) polymorphisms as a genetic marker system in cotton. Mol. Ecol. Notes 1:205-208.
Crossref
|
|
|
|
|
Long Y, Xiang H, Xie L, Yan X, Fan M, Wang Q (2009). Intra-and Interspecific Analysis of Genetic Diversity and Phylogeny of Termites (Isoptera) in East China Detected by ISSR and COII Markers. Sociobiology 53(2B):411-430.
|
|
|
|
|
Magurran AE (2013). Chapter one: Introduction: measurement of (biological) diversity. In Measuring Biological Diversity. Hoboken, NJ:Wiley-Blackwell. Pp. 11-14.
|
|
|
|
|
Marini M, Mantovani B (2002). Molecular relationships among european samples of Reticulitermes (Isoptera, Rhinotermitidae). Mol. Phylogenet. Evol. 22:454-459.
Crossref
|
|
|
|
|
Moulin MM, Rodrigues R, Gonçalves LS A, Sudré C P, Pereira M G (2012). A comparison of RAPD and ISSR markers reveals genetic diversity among sweet potato landraces (Ipomoea batatas (L.) Lam.). Acta Scientiarum 34(2):139-147.
Crossref
|
|
|
|
|
Ohkuma M, Yuzawa H, Amornsak W, Sornnuwat Y, Takematsu Y, Yamada A, Vongkaluang C, Sarnthoy O, Kirtibutr N, Noparatnaraporn N, Kudo T, Inoue T (2004). Molecular phylogeny of Asian termites (Isoptera) of the families Termitidae and Rhinotermitidae based on mitochondrial COII sequences. Mol. Phylogenet. 31:701-710.
Crossref
|
|
|
|
|
Okpul T, Mace ES, Godwin ID, Singh D, Wagih ME (2005). Evaluation of variability among breeding lines and cultivars of taro (Colocasia esculenta) in Papua New Guinea using ISSR fingerprinting and agro-morphological characterization. PGR Newsletter 143:8-16.
|
|
|
|
|
Ouvrard D, Campbell BC, Bourgoin T, Chan KL (2000). 18S rRNA Secondary structure and phylogenetic position of Peloridiidae (Insecta, Hemiptera). Mol. Phylogenet. Evol. 16:403-417.
Crossref
|
|
|
|
|
Pei AY, Oberdorf WE, Nossa CW, Agarwal A, Chokshi P, Gerz AE, Jin Z., Lee P, Yang L, Poles M, Brown SM, Sotero S, De Santis T, Brodie E, Nelson K, Pei Z (2010). Diversity of 16S rRNA Genes within Individual Prokaryotic Genomes. Appl. Environ. Microbiol. 76(12):3886-3897.
Crossref
|
|
|
|
|
Pranesh MK, Harini BP (2014). Comparative morphological divergence among few common Indian species of the family Termitidae:Isoptera. Int. J. Adv. Res. 2(4):523-531.
|
|
|
|
|
Reuter JS, Mathews DH (2010). RNA structure: software for RNA secondary structure prediction and analysis. BMC Bioinform. 11:129.
Crossref
|
|
|
|
|
Roonwal ML, Chhotani (1989). The Fauna of India and Adjacent Countries: Isoptera (Termites) (Volume-1 Introduction and Families of Termopsidae, Hodotermitidae. Saitou N, Nei M (1987). The neighbor-joining method: A new method for reconstructing phylogenetic trees. Mol. Biol. Evol. 4:406-425.
|
|
|
|
|
Salhi-Hannachi A, Chatti K, Mars M, Marrakchi M, Trifi M (2005). Comparative analysis of genetic diversity in two Tunisian collections of fig cultivars base on random amplified polymorphic DNA and inter simple sequence repeats fingerprints. Genet. Res. Crop Evol. 52:563-573.
Crossref
|
|
|
|
|
Salhi-Hannachi A, Trifi M, Zehdi S, Hedhfi J, Mars M, Rhouma A, Minter M (2004). Simple sequence repeat fingerprints to access genetic diversity in Tunisian fig (Ficus carica L.) germplasm. Genet. Res. Crop Evol. 51:269-275.
Crossref
|
|
|
|
|
Sambrook J, Russell DW (2001). Molecular Cloning: A laboratory manual 3rd ed. Cold Spring Harbor Laboratory Press, New York.
|
|
|
|
|
Sanchez MP, Davila JA, Loarce Y, Ferrer E (1996). Simple sequence repeat primers used in polymerase chain reaction amplifications to study genetic diversity in barley. Genome 39:112-117.
Crossref
|
|
|
|
|
Scharf ME, Wu-Scharf D, Zhou X, Pittendrigh BR, Bennett GW (2005). Gene expression profiles among immature and adult reproductive castes of the termite Reticulitermes flavipes. The Royal Entomological Society, Insect Molecular Biology 14(1):31-44.
Crossref
|
|
|
|
|
Semagn K, Bjørnstad Å, Ndjiondjop MN (2006). An overview of molecular marker methods for plants. Afr. J. Biotechnol. 5(25):2540-2568.
|
|
|
|
|
Shanmugavel S, Paulchamy R, Velayutham V, Sundaram J (2015). Genetic diversity based on 28S rDNA sequences among populations of Culex quinquefasciatus collected at different locations in Tamil Nadu, India. Trop. Biomed. 32:434-443.
|
|
|
|
|
Sheppard WS, Smith DR (2000). Identification of African-derived bees in the Americas:A survey of methods. Ann. Entomol. Soc. Am. 93:159-176.
Crossref
|
|
|
|
|
Sorkheh K, Dehkordi MK, Ercisli S, Hegedus A, Halász J (2017). Comparison of traditional and new generation DNA markers declares high genetic diversity and differentiated population structure of wild almond species. Scientific Reports 7, Article number: 5966.
Crossref
|
|
|
|
|
Tamura K, Nei M, Kumar S (2004). Prospects for inferring very large phylogenies by using the neighbor-joining method. Proceed. Natl. Acad. Sci. USA 101:11030-11035.
Crossref
|
|
|
|
|
Torre MP, García M, Heinz R, Escandón A (2012). Analysis of genetic variability by ISSR markers in Calibrachoa caesia. Electronic Journal of Biotechnology 15(5):8-8.
|
|
|
|
|
Wang C, Zhou X, Li S, Schwinghammer M, Scharf ME, Buczkowski G, Bennett GW (2009). Survey and Identification of Termites (Isoptera: Rhinotermitidae) in Indiana. Ann. Entomol. Soc. Am. 102(6):1029-1036.
Crossref
|
|
|
|
|
Whiting MF (2002). Mecoptera is paraphyletic:multiple genes and phylogeny of Mecoptera and Siphonaptera. Zool. Scr. 31:93-104.
Crossref
|
|
|
|
|
Yeap BK, Duga FM, Othman AS, Lee CY (2010). Genetic Relationship Between Coptotermes heimi and Coptotermes gestroi (Isoptera: Rhinotermitidae). Sociobiology 56(2):291-312.
|
|
|
|
|
Yu S, Wang Y, Rédei D, Xie Q, Bu W (2013). Secondary structure models of 18S and 28S rRNAs of the true bugs based on complete rDNA sequences of Eurydema maracandica Oshanin, 1871 (Heteroptera, Pentatomidae). ZooKeys 319:363-377.
Crossref
|
|


 (to study banding patterns according to Torre et al., 2012). Which implies that with the value of q, we can find the value of p; that is, p = 1 – q. Therefore, heterozygosity = 2pq (According to Hardy-Weinberg law).