ABSTRACT
This study aimed to evaluate stress among general population of Karachi, Pakistan and to categorize the relative risk of diseases through body mass index (BMI), as well as to categorize the relative risk of diabetes through questionnaire based scoring pattern. Study consisted of two phase study duration. Total 377 individuals were approached; only 269 individuals completed the study procedures. In phase-I, data was collected through standardized questionnaire of American Institute of Stress (AIS), to determine total stress scores (TSS). In phase-II, anthropometric markers (e.g., body weight, height, waist and body mass index) were measured, to evaluate the Relative Risk of Disease (RrD). With the aid of socio-demographic variables and questionnaire, the relative risk of diabetes mellitus (RrDM) was also quantified. 71% was the participation rate, in which 51.3% were male and 48.7% were female. Cronbach’s alpha (α) value was 69%. The mean scores of TSS (57.31±5.28) were moderate. Averages of body weight, height, waist and body mass index (BMI) were 164.6±13.5, 1.67±0.06, 35.75±2.5, 27.35±1.8, and RrDM (34.17±7.8), respectively. Through categorizing the RrD, 87.7% respondents were found to have increased risk, whereas, a least proportion were with high risk. Spearman R coefficient of gender variables showed indirect significant (p≤0.01) association with RrDM score. Pearson r coefficient of age variable showed direct significant (p≤0.01) association with RrDM score. Findings concluded that moderate increase of TSS with increase RrD leads to moderate existence of RrDM.
Key words: Diabetes mellitus, Karachi, body mass index, metabolic diseases, Pakistan, stress.
Social, physical and genetic consequences have added vast impacts on human body which have reported with high risk of different diseases (Repetti et al., 2002; Shonkoff et al., 2009). These risk of diseases generally may relates with accumulation of chronic stress (Salleh, 2008; Azmi et al., 2010), increase body mass index (BMI) (Megis et al., 2006), with different pathological scenarios ultimately resulting to various metabolic diseases or disorders (Mazzucato et al., 2014).
Common metabolic diseases such as hypertension and diabetes mellitus (DM) progress side by side (Konzem et al., 2002; Rydén et al., 2007), with almost similar causes and consequences (Rydén et al., 2007). DM characterized by the dysfunction in the metabolic mechanisms of carbohydrates, lipids and amino acids (Kolluru et al., 2012), whereas hypertension is characterized by persistently elevated blood pressure (Konzem et al., 2002). Worldwide, there is an increasingly high prevalence of DM from 108 million in 1980 to 422 million in 2014 (Zhou et al., 2016) and the prevalence of hypertension from the latest studies reported around 25% in Pakistan (Neupane et al., 2014).
In present era of modern global industrialization, the relationship between stress, increase weight gain, and other metabolic diseases is the subject of many diseases (Foss and Dyrstad, 2011). These studies link DM to depression, socio-economic status (Pampel et al., 2010), sedentary life style, smoking, etc. (Cameron et al., 2003; Booth et al., 2012; Tassaduqe et al., 2004). Furthermore, these studies also indicate that many of these adults are unaware (that is, undiagnosed) they have DM or associated risk factors. In adults the relation of stress with DM (type 2) is more specifically estimated in those who have previous standing with undiagnosed DM, with prominent escalation in body weights, serve as the most significant risk factors for risk of DM and metabolic diseases (Gray et al., 2015). Early detection of DM (undiagnosed) or identifying the risk of developing DM (that is, specifically type 2) is highly important to improve the quality of life, as well as reducing the burden of associated morbidities and co-morbidities, in any society (Marshall and Flyvbjerg, 2006).
In 2015, a national research survey estimating diabetic prevalence in Mongolia revealed that the majority of the population was unaware of their present health conditions, and that more than one half of the diagnosed population were not being treated (Dugee et al., 2015). In addition, categorization of stress with DM is often underestimated (Djindjic et al., 2012). In Pakistan, to date the categorization of diseases risk through anthropometric markers and questionnaire based scoring system with relation to the assessment of stress was not reported. Therefore, the present study was carried out to categorize the relative risk of disease with stress, BMI and relative risk of DM among general population of Karachi, Pakistan.
Design of the present study was cross-sectional. The study consisted of two (02) phase duration. In both phases, data were collected through questionnaire based interviews from the respondents, comprising the general population of Karachi, Pakistan. Enrollments of participant for this study were entirely independent with respect to their age, gender, marital status, qualification levels and race. Study duration was December 2014 to January 2016.
Ethics consideration
Prior to the start of the research, all participants were given a brief overview about the impact of this study as well as the necessary concerned information regarding the nature of this work. In addition to this, informed verbal consent was also obtained from all participants before handing over the survey instruments. Declaration of confidentiality of all their shared information as well as their personal identity was also provided.
Sample size
Sample size was calculated with the help of previously published study reported by Wahed and Hassan (2017). The minimum sample size for this study was equivalent to 377 respondents which was computed by adjusting the margin of error (d) at 5%, confidence of interval on 95%, considering the recommended population size (20000) with at least 50% response distribution, significance level of 0.05 and the power of the study was 80%.
Exclusion criteria
The following individuals or groups of people were excluded from participation in present study: individual under 18 years of age; unable to provide informed consent; pregnant females; individuals with known chronic diseases such as diabetes mellitus, coronary disease or coronary disease equivalent, etc.; any past record of psychiatric disease, intellectual deficiency, poor motivation; any sign pertinent to alcohol or cocaine use, or other conditions that would limit the validity of the informed consent, or confound the interpretation of the study; and any kind of association or affiliation with study investigators or investigational site.
Phase I
In this phase, workplace stress was calculated in term of Total Stress Score (TSS) through a pre-tested and standardized questionnaire on job stress, which was used as tool to collect data from all respondents. This research instrument was easily accessible through American Institute of Stress (AIS) and used in various researches to calculate the professional stress (Khan et al., 2013). Prior to the start of this study, special permission has been taken for the use of the aforementioned questionnaire from the AIS officials. Questionnaire (tool) for the assessment of stress consisted of total of ten (10) variables. Responses to all variables were equally scored on 10 points Likert scale (1 to 4 = strongly disagree, 5 to 7= Agree somewhat and 8 to 10 = strongly agree) with the statement. However, after the completion of phase I (with consent, JS tool was distributed to the participants and after completion of all information it was collected and recorded in computerized sheet), the aggregated TSS score were also classified in three distinct and even categories as, the respondents which had TSS score between 10 and 30 have handle professional stress well; the respondents which had TSS score between 40 and 60, have handle job stress moderately well and the respondents which had TSS score between 70 and 100, have encountering problems that need to be addressed and resolved.
Phase II
After the completion of phase I (approximately one week of duration), respondents were again approached for the completion of phase II of the study. In this phase, waist was measured in inches, body weight was measured in kilograms (kg) and converted to pounds (lbs) and height was measured initially in feet’ inches and converted to meters (m). BMI (kg/m2) was calculated with the help of the formula mentioned earlier by Qureshi et al. (2011). Age, gender, marital status, academic qualification, employment status with experience, economic profile and ethnic origin were investigated as socio-demographic variables from each respondent.
Thereafter, a questionnaire was designed based on the internationally pretested variables used for the categorization of the risk of diabetes (Zhang et al., 2014; Stiglic and Pajnkihar, 2015), which after modification was used as a tool for the categorization of the relative risk of diabetes mellitus (RrDM), among the general population. The questionnaire consisted of a total of 14 different variables and total aggregated score of all variables was 80. The questionnaire for the categorization of RrDM takes into account: age, BMI, waist circumference, routine of exercise habits, dietary habits (e.g., routine of vegetables intake), medication for hypertension, history of hyperglycemia, and family diabetes history (Siren et al., 2012). This tool was also administered with same manner as mentioned in phase I.
Categorization of RrD and RrDM
RrD was categorized with reference to BMI in five grades as; individual with <24.9 kg/m2 has no risk (0 point), 25 to 29.9 kg/m2 has increased risk (1 point), 30 to 34.9 kg/m2 has high risk (2 points), 35 to 39.9 kg/m2 has very high risk (3 points) and >40 kg/m2 has extremely high risk. RrDM was categorized after the successful completion of RrDM questionnaire. The total obtained score was further grade into three even categories from low risk to high risk. The total RrDM obtained score between 01 and 27 units with ‘Low Risk of Disease’ subject. The total RrDM obtained score between 28 and 54 units with ‘Intermediate Risk of Disease’ subject, while, the total RrDM obtained score between 55 and 80 units with ‘High Risk of Disease’.
Data analysis
Data were entered in Microsoft 2010 Excel Workbook and statistical analyses were performed using Statistical Package for Social Sciences (SPSS) version16.0, statistical software for Windows version 7 professional and through online GraphPad Software, Quick Calcs Online Calculator for scientist. Frequencies and percent frequencies of the respondents were computed on the basis of gender for categorical variables like age group, marital status, academic qualification, affiliation, economic status and ethnic classification. Depending on the distribution of gender as well as the total obtained scores and the measurement of the anthropometric markers, viz., TSS, RrDM, body weight, height, waist measurement, and BMI, RrD for respondents were presented as mean with standard deviation (SD), median and interquartile range (IQR), respectively. In addition to this, data were also represented in quartile series on the basis of the obtained scores and the values of the selected anthropometric markers, and to with help of independent sample t-test significance among these quartiles with aggregated scores and values was also verified. Data were correlated through Pearson's and Spearman’s method (two tailed) depending on distribution of variables in order to test the correlation between selected variables with RrDM scores. Cronbach’s Alpha was calculated for detecting the consistency among the responses of the both study instrument. Results were considered significant when P value < 0.05.
Participants’ enrollment
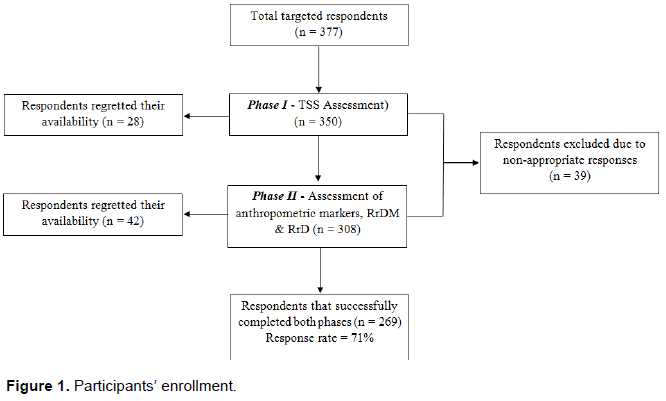
A total of 377 individuals were approached. After the completion of both aforementioned phases, only 269 respondents completed the study questionnaires through interviews. 28 individuals had regretted their availability in the phase I of the study while 42 individuals had regretted their availability in phase II. However, 39 did not report their response absolutely on the study instruments. Overall, 109 respondents were excluded from this study (Figure 1).
Demographic characteristics of participants
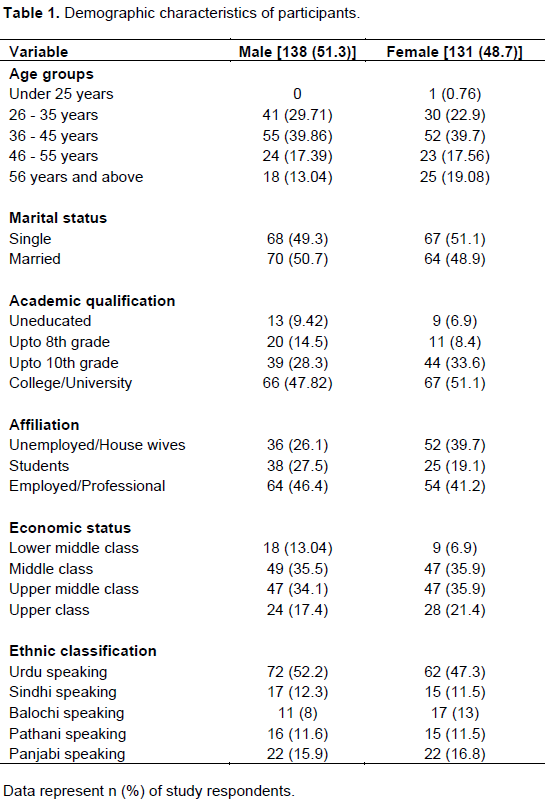
Of the total 269 study respondents, 138 (51.3%) were male and 131 (48.7%) were female. Age groups described that under 25 years of age limit, only one female was available. In age range from 26 to 35 years, 41 (29.71%) were male and 30 (22.9%) were female. Age group range from 36 to 45 years had 55 (39.86%) male and 52 (39.7%) females and age group of 46 to 55 years had 24 (17.39%) male and 23 (17.56%) female. However, in age group of 56 years and above 18 (13.04%) were male and 25 (19.08%) were female. Of 138 total male, 68 (49.3%) were single and 70 (50.7%) were married. From total 138 females, 67 (51.1%) were single and 64 (48.95) were married. 13 (9.42%) males and 9 (6.9%) females were uneducated, 20 (14.5%) males and 11 (8.4%) females were upto 8th grade. 39 (28.3%) males and 44 (33.6%) females were upto 10th grade qualified and 66 (47.82%) males and 67 (51.1%) females completed their college/university qualification. 36 (26.1%) males were unemployed and 52 (39.7%) females were housewives. 38 (27.5%) males, 25 (19.1%) were students and 64 (46.4%) males and 54 (41.2%) females were professionally employed. With reference to economic status, 18 (13.04%) males, 9 (6.9%) females belongs to lower middle class, 49 (35.5%) and 47 (35.9) females belongs to middle class. 47 (34.1%) males, 47 (35.9%) females belongs to upper middle class and 24 (17.4%) and 28 (21.4%) females belongs to upper class. Classifying the respondents with reference of ethnic origin, 72 (52.2%) males, 62 (47.3%) females were Urdu speaking, while, 17 (12.3%) males, 15 (11.5%) females were Sindhi speaking. 11 (8%) males, 17 (13%) females were Balochi speaking, 16 (11.6%) males, 15 (11.5%) females were Pathani speaking, 22 (15.9%) males and 22 (16.8%) females were Panjabi speaking (Table 1).
Comparative analysis of TSS and RrDM
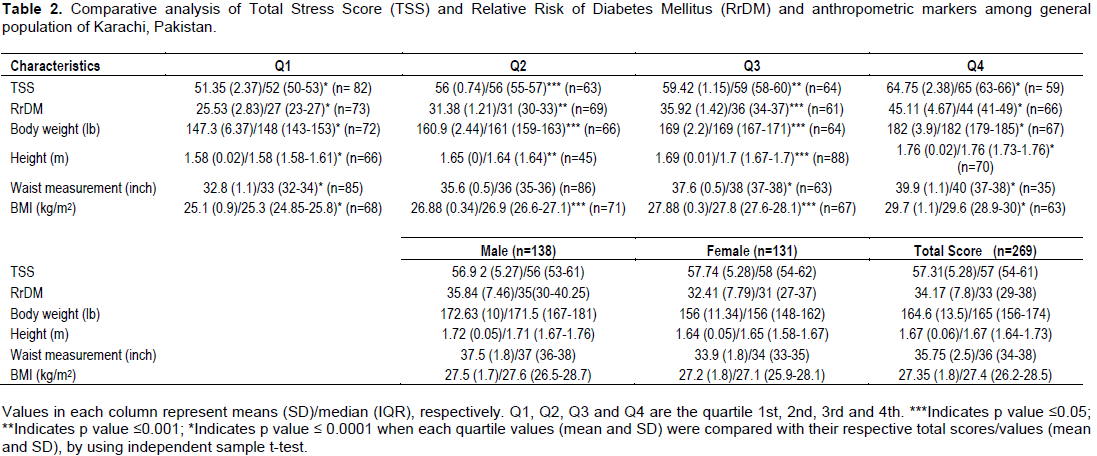
The mean total of TSS was 57.31±5.28, with median of 57 and IQR of 54-61. Comparatively male and female respondents have 56.92±5.27 and 57.74±5.28, with median and IQR of 56, 53-61, 58, and 54-62, respectively. The score units of quartiles 1st and 4th showed high (p ≤ 0.0001) significance while 2nd and 3rd quartiles showed significance (p ≤ 0.05 and p ≤ 0.001), respectively, when compared with the aggregated TSS (Table 2).
The mean total units of RrDM was 34.17±7.8, with median and IQR of 33 and 29-38, respectively. Comparatively, male and female have 35.84±7.46 and 32.41±7.79, whereas median and IQR range were 35, 30-40.25, 31, and 27-37 units, respectively. The score units of quartiles 1st and 4th showed high (p ≤ 0.0001) significance while 2nd and 3rd quartiles showed significance (p ≤ 0.001 and p ≤ 0.05), respectively, when compared with the aggregated RrDM (Table 2).
Comparative analysis of anthropometric markers
The mean total of body weight was 164.6±13.5, with median and IQR of 165 and 147.3-182, respectively. Comparatively, male and female have mean body weight of 172.63±10 and 156±11.34, whereas median and IQR range were 171.5, 167-181, 156, and 1.58-1.67, respectively. The mean weights of quartiles 1st and 4th showed high (p ≤ 0.0001) significance while 2nd and 3rd quartiles showed significance (p ≤ 0.05) respectively, when compared with the aggregated mean body weight (Table 2).
The mean total of body height was 1.67±0.06, with median and IQR of 1.67 and 1.64-1.73, respectively. Comparatively, male and female have mean body height of 1.72±0.05, 1.64±0.05, whereas median and IQR range were 1.71, 1.67-1.76, 1.65, and 1.58-1.67, respectively. The mean height of quartiles 1st and 4th showed high (p ≤ 0.0001) significance while 2nd and 3rd quartiles showed significance (p ≤ 0.001 and p ≤ 0.05), respectively, when compared with the aggregated mean body height (Table 2).
The mean total of waist measurement was 35.75±2.5, with median and IQR of 36 and 34-38, respectively. Comparatively, male and female have mean waist measurement of 37.5±1.8 and 33.9±1.8, whereas median and IQR range were 37, 36-38, 34, and 33-35, respectively. The mean waist measurement of quartiles 1st, 3rd and 4th showed highly (p ≤ 0.0001) significance, when compared with the aggregated mean waist measurement (Table 2).
The mean total of BMI was 27.35±1.8, with median and IQR of 27.4 and 26.2-28.5, respectively. Comparatively, male and female have mean BMI of 27.5±1.7 and 27.2±1.8, whereas median and IQR range were 27.6, 26.5-28.7, 27.1, and 25.9-28.1, respectively. The mean BMI of quartiles 1st and 4th showed high (p ≤ 0.0001) significance while 2nd and 3rd quartiles showed significance (p ≤ 0.05) respectively, when compared with the aggregated mean BMI (Table 2).
Categorization of RrD
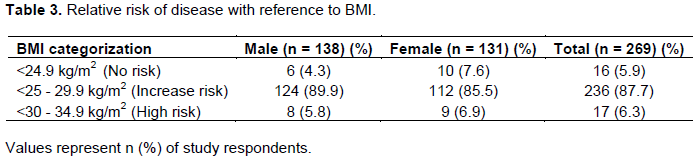
Distribution in categorizing the RrD with reference to BMI, majority of male and female respondents, that is, 89.9 and 85.5% respectively were at increased risk. The average count of total population was 87.7%, which were at increased risk. 5.8% in male and 6.9% in female were with high risk and few, that is, 4.3 and 7.6% have no risk (Table 3).
Correlation between RrDM with demographic, TSS, RrD and other variables
Spearman correlation of RrDM with demographic factors, that is, gender showed significant (p ≤ 0.01) negative correlation, however, a weak positive association was depicted with change in marital status. Almost economic profile of respondents showed zero correlation with RrDM, as the computed Spearman (R) coefficient was very least (0.002) in this case. RrD with relation of RrDM showed a significant (p ≤ 0.01) positive association, as it validates the general influence of the increasing RrDM units that have increased the relative risk of disease (Table 4).
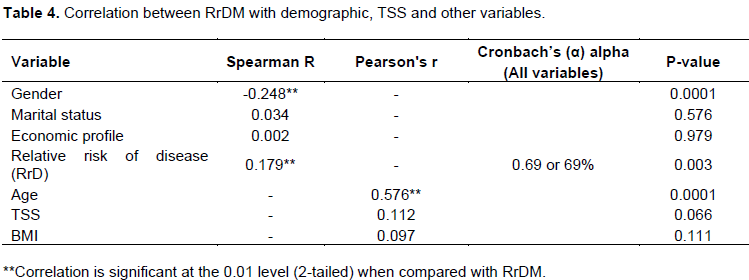
Pearson correlation of RrDM with demographic factor, that is, age showed significant (p ≤ 0.01) positive correlation, as with increasing age, the RrDM unit score was also increased in both gender respondents. Similarly, correlation between TSS and RrDM also depicted positive association, as the person (r) coefficient indicated the positive correlation (0.122) between these two variables. However, a weak positive (0.097) association was also depicted with change in BMI status with any increase in RrDM score (Table 4).
Timely screening of individual through anthro-pometric markers and questionnaire based tools set the cost-effective way to manage strategically the primary care disease screening program (Meigs et al., 2006; Qureshi et al., 2011; Stiglic and Pajnkihar, 2015). Worldwide, many questionnaire based tools exist to evaluate the risk of developing chronic metabolic disease like diabetes mellitus in their population (Stiglic and Pajnkihar, 2015). These tools can easily be available in pencil-paper based questionnaire assessment or in capacity of online risk assessment surveys to categorize RrD. The role of the authentication of biochemical screening tools like Sugar Tolerance Test (OGTT), estimation of glycated hemoglobin (HbA1c), insulin monitoring, etc., served as confirmatory analyses that rule the findings (Alqahtani et al., 2013). But as a preliminary assessment model, the importance of categorizing the relative risk of disease through pertinent scoring of available and essentially required information received from individual without any biochemical diagnostic estimation or endocrine assays establish a predictive assessment model that aid the healthcare system with very least cost specially for under-developed countries (Sacks et al., 2011; Stiglic and Pajnkihar, 2015).
As a developing country, general population of Pakistan faced many socioeconomic burden like poverty, high cost for standardized education, health and nutrition to community, more surprisingly very least population size has access to healthcare facilities which has been reported in the past (Shaikh and Hatcher, 2005; Jalal-ud-Din, 2014). Substantial researches contributed in reporting the high prevalence of stress as well as dependently or independently linked elevated glucose level with sedentary life-style more likely establishes a link to have type2DM and other associated disease risk in future life status (Warren et al., 2010; van der Berg et al., 2016).
Therefore, in countries like Pakistan public perspective regarding the adaptation of preventive strategies needs to be strengthen to become a part of national strategic processes with prime focus for cure purposes. The purpose of this study was to investigate or to categorize the risk of diabetes and other diseases through simple questionnaire based approach with relevance to stress among the individuals of Metropolitan Karachi, with substantial participation of individuals from most communities (ethnicity) were involved. The socio-economic profile of respondents stratified the maximum participation of respondents from middle class economic group and studies had documented the relation of poor socioeconomic status and the associated complications (which might contribute the cause of undiagnosed diabetes), eventually result in all of society being affected (Rabi et al., 2006). Society benefits when the basis of socioeconomic inequity become a greater focus of attention and increased efforts are made to minimize the vast breaches in socioeconomic status as well as to manage the health related hazards worldwide (Baum et al., 1999; Azmi et al., 2010).
Inequities in wealth distribution, resource distribution, and quality of life are increasing and these imbalances are steadily becoming a global concern. A comparatively new theory has surfaced that these effects are due to chronic stress that is associated with socioeconomic status; lower socioeconomic status has been consistently affiliated with various significant social and environmental conditions that add to the burden of chronic stress which if undiagnosed or non-treated is linked with diabetes and other diseases (Steyn and Damasceno, 2006). The first phase of this study estimated the TSS in all respondents which showed the presence of moderately elevated level of stress, which in general reflects the advancement in psychosocial and professional aspects of life, with more demanding daily routine. Researches interrelated the impact of socioeconomic stress with commonly standing health problems (hypertension diabetes and other dyslipidemic complications), and with health-impairing behaviors and in future the probability of the increment of this TSS may also encounter health related problems in individuals (Tamashiro et al., 2011). Another aspect to contemplate is the stress on females in society who are expected to raise their children and manage their work life simultaneously, which could be a further source of stress (Poduval and Poduval, 2009).
Probing the premise mechanism for studying the impact of stress with relevance to undiagnosed diabetes; this relates stress to triggers the hypothalamic pituitary-adrenal axis and the sympatho-adrenal-medullary axis (Smith and Vale, 2006). Sequentially, this biochemical connection results in an increased blood pressure and elevated level of blood glucose, the purpose of which is to prompt a fight-or-flight response situation (Gerra et al., 2001; Foss and Dyrstad, 2011). Moreover, prolong accumulation of stress also causes cortisol levels to remain consistently high (Kirschbaum et al., 1995); subsequently, it promotes the hypertension, accumulation of body fat, and persistent standing leads to insulin resistance and dyslipidemia (Azmi et al., 2010).
The linkage between work stress and diabetes could partly be facilitated by gain in body weight and it was previously well correlated that sedentary and unhealthy life style directly associated with increased consequences in obesity and development of secondary risk factors in individual (Steyn and Damasceno, 2006; Foss and Dyrstad, 2011). Similarly, the present effort also identified the presence of increase in body weights in male as compared to female respondents. This may be linked as nowadays, everyone has faced more demanding professional environment, that consistently generate stress by disturbing the circadian rhythms, having intake of energy (in term of high fat and carbohydrate) with least physical activeness serve as a crucial risk factor in this regards (Johnston, 2014). Beside this, an international research in 2012 claims that assessment of waist circumference is also characterized as an identifying tool for assessing the increased risk for type 2 diabetes (Siren et al., 2012). In the present work, the increase waist measurement (both in male and female) establishes the interfering impact of stress in respondents that not only relate with gain in body weights but also in waist circumference, as abdominal obesity is more specifically connected as a physical investigative anthropometric tool to characterize metabolic risk (Chan and Woo, 2010; Meigs et al., 2006).
In the present findings, the BMI results suggested that on average, the respondents (both genders) were overweight. Term ‘overweight’ in categorization of BMI was classified as the increased risk status that substantially increases lifetime risk of diagnosed diabetes (Meigs et al., 2006). Moreover, Ganz et al. (2014), strongly correlated the levels of BMI with risk of being diagnosed with T2DM, as individual with higher BMI has higher risk of T2DM as compared with a lower BMI (Ganz et al., 2014).
The existing American Diabetic Association (ADA) guidelines for type 2 diabetes screening among the asymptomatic population are based on laboratory testing (American Diabetes Association, 2013). However, there is always a trade-off between simplicity and accuracy for each screening method. Therefore, a much more cost-effective and practical process would be to use a valid, basic questionnaire as a preliminary screening method, followed by more invasive and accurate diagnostic tests in primary care and/or community settings. Globally, various diabetic risk assessment tool is a means to predict the future risk of diabetes based on certain known or self-assessed risk (physical) factors that mainly includes age, sex, ethnicity, parental history of diabetes, history of elevated blood glucose level, use of antihypertensive medications, smoking, physical inactivity, waist circumference, body weight and some others (Christian et al., 2009; Siren et al., 2012; Stiglic and Pajnkihar, 2015). Similar tool from Australia, predicts five-year risk of diabetes, and the risk of developing diabetes over a longer period would be greater (Chen et al., 2010; Adegbija et al., 2015). In a published study in 2015 with reference to Asian population, it was reported that these global tools were not directly adopted without preliminary validation and after the modification its effectiveness in term of reliable screening in undiagnosed diabetes were also reported as Mongolian population (Dugee et al., 2015). In 2012 and 2015, a diabetes risk score based study was reported that established the mechanism for identification of high risk individuals for early intervention to delay or prevent type 2 diabetes in Pakistani population (Riaz et al., 2012; Basit et al., 2015). In the present research, with the aid of modified tool and methodologies, the respondents were identified at intermediate risk, with increased risk for relative risk of disease which may also increase with certain passage of time in life.
The present findings conclude that increased RrD was linked with intermediate stress and RrDM obtained scores, among general population of Karachi. In future, this type of assessment should be more probed and extended with reference to biochemical diagnostic markers. Proper planning for health counseling and life-style based interventions needs to be establish.
The authors have not declared any conflict of interest.
REFERENCES
|
Adegbija O, Hoy W, Wang Z (2015). Predicting absolute risk of type 2 diabetes using age and waist circumference values in an aboriginal Australian community. PloS one.10(4):e0123788.
Crossref
|
|
|
|
Alqahtani N, Khan WA, Alhumaidi MH, Ahmed YA (2013). Use of glycated hemoglobin in the diagnosis of diabetes mellitus and pre-diabetes and role of fasting plasma glucose, oral glucose tolerance test. Int. J. Prev. Med. 4(9):1025-1029.
|
|
|
|
|
American Diabetes Association (2013). Standards of medical care in diabetes- 2013. Diabetes Care 36(Suppl1):S11-66.
Crossref
|
|
|
|
|
Azmi MB, Qureshi SA, Lateef T, Arshad HM (2010). Health Hazard of Work Related Stress. J. Dow Univ. Health Sci. 4 (3):115-118.
|
|
|
|
|
Basit A, Riaz M, Fawwad A (2015). Improving diabetes care in developing countries: the example of Pakistan. Diabetes Res. Clin. Pract. 107(2):224-232.
Crossref
|
|
|
|
|
Baum A, Garofalo JP, YALI AM (1999). Socioeconomic Status and Chronic Stress: Does Stress Account for SES Effects on Health? Ann. New York Acad. Sci. 896:131-144.
Crossref
|
|
|
|
|
Booth FW, Roberts CK, Laye MJ (2012). Lack of exercise is a major cause of chronic diseases. Compr. Physiol. 2(2):1143-1211.
Crossref
|
|
|
|
|
Cameron AJ, Welborn TA, Zimmet PZ, Dunstan DW, Owen N, Salmon J, Dalton M, Jolley D, Shaw JE (2003). Overweight and obesity in Australia: the 1999-2000 Australian diabetes, obesity and lifestyle study (AusDiab). Med. J. Aust. 178(9):427-32.
|
|
|
|
|
Chan RSM, Woo J (2010). Prevention of overweight and obesity: how effective is the current public health approach. Int. J. Environ. Res. Public Health 7(3):765-783.
Crossref
|
|
|
|
|
Chen L, Magliano DJ, Balkau B, Colagiuri S, Zimmet PZ, Tonkin AM, Mitchell P, Phillips PJ, Shaw JE (2010). AUSDRISK: an Australian Type 2 Diabetes Risk Assessment Tool based on demographic, lifestyle and simple anthropometric measures. Med. J. Austr. 192(4):197.
|
|
|
|
|
Christian AH, Mochari H, Mosca LJ (2009). Waist circumference, body mass index, and their association with cardiometabolic and global risk. J Cardiometab. Syndr. 4(1):12-19.
Crossref
|
|
|
|
|
Djindjic N, Jovanovic J, Djindjic B, Jovanovic M, Jovanovic JJ (2012). Associations between the occupational stress index and hypertension, type 2 diabetes mellitus, and lipid disorders in middle-aged men and women. Ann. Occup. Hyg. 56(9):1051-1062.
|
|
|
|
|
Dugee O, Janchiv O, Jousilahti P, Sakhiya A, Palam E, Nuorti JP, Peltonen M (2015). Adapting existing diabetes risk scores for an Asian population: a risk score for detecting undiagnosed diabetes in the Mongolian population. BMC Public Health 15:938.
Crossref
|
|
|
|
|
Foss B, Dyrstad SM (2011). Stress in obesity: Cause or consequence? Med. Hypotheses 77(1):7-10.
Crossref
|
|
|
|
|
Ganz ML, Wintfeld N, Li Q, Alas V, Langer J, Hammer M (2014). The association of body mass index with the risk of type 2 diabetes: a case-control study nested in an electronic health records system in the United States. Diabetol. Metab. Syndr. 6(1):50.
Crossref
|
|
|
|
|
Gerra G, Zaimovic A, Mascetti GG, Gardini S, Zambelli U, Timpano M, Raggi MA, Brambilla F (2001). Neuroendocrine responses to experimentally-induced psychological stress in healthy humans. Psychoneuroendocrinology 26(1):91-107.
Crossref
|
|
|
|
|
Gray N, Picone G, Sloan F, Yashkin A (2015). Relation between BMI and onset of diabetes mellitus and its complications. South Med. J. 108(1):29-36.
Crossref
|
|
|
|
|
Jalal-ud-Din M (2014). Poverty, Poor Health and Socio-Economic Prosperity: A case study of Pakistan. J. Manag. Sci. 8(1):141-149.
|
|
|
|
|
Johnston JD (2014). Physiological responses to food intake throughout the day. Nutr. Res. Rev. 27(01):107-118.
Crossref
|
|
|
|
|
Khan F, Azmi MB, Hussain M, Azmi SS (2013). Assessment of job stress with demographic factors in doctors working at the tertiary care hospitals of Karachi. Professional Med. J. 20(1):156-163.
|
|
|
|
|
Kirschbaum C, Prüssner JC, Stone AA, Federenko I, Gaab J, Lintz D, Schommer N, Hellhammer DH (1995). Persistent high cortisol responses to repeated psychological stress in a subpopulation of healthy men. Psychosom. Med. 57(5):468-74.
Crossref
|
|
|
|
|
Kolluru GK, Bir SC, Kevil CG (2012). Endothelial dysfunction and diabetes: effects on angiogenesis, vascular remodeling, and wound healing. Int. J. Vasc. Med. 2012:918267.
Crossref
|
|
|
|
|
Konzem SL, Devore VS, Baurer DW (2002). Controlling hypertension in patients with diabetes. Am. Fam. Physician 66:1209-1214.
|
|
|
|
|
Marshall SM, Flyvbjerg A (2006). Prevention and early detection of vascular complications of diabetes. BMJ. 333(7566):475-480.
Crossref
|
|
|
|
|
Mazzucato M, DallaPozza LV, Manea S, Minichiello C, Facchin P (2014). A population-based registry as a source of health indicators for rare diseases: the ten-year experience of the Veneto Region's rare diseases registry. Orphanet J. Rare Dis. 9(1):37.
Crossref
|
|
|
|
|
Meigs JB, Wilson PWF, Fox CS, Vasan RS, Nathan DM, Sullivan LM, D'Agostino RB (2006). Body Mass Index, Metabolic Syndrome, and Risk of Type 2 Diabetes or Cardiovascular Disease. J. Clin. Endocrinol. Metab. 91(8):2906-2912.
Crossref
|
|
|
|
|
Neupane D, McLachlan CS, Sharma R, Gyawali B, Khanal V, Mishra SR, Christensen B, Kallestrup P (2014). Prevalence of hypertension in member countries of South Asian Association for Regional Cooperation (SAARC): systematic review and meta-analysis. Medicine (Baltimore) 93(13):e74.
Crossref
|
|
|
|
|
Pampel FC, Krueger PM, Denney JT (2010). Socioeconomic disparities in health behaviors. Annu. Rev.Sociol. 36:349-370.
Crossref
|
|
|
|
|
Poduval J, Poduval M (2009). Working mothers: how much working, how much mothers, and where is the womanhood? Mens Sana Monogr. 7(1):63-79.
Crossref
|
|
|
|
|
Qureshi SA, Rehman MM, Azmi MB, Hasnat S (2011). Most prevalent diseases with relation of body mass index and waist circumference in Karachi, Pakistan. J. Dow Univ. Health Sci. 5(3):85-91.
|
|
|
|
|
Rabi DM, Edwards AL, Southern DA, Svenson LW, Sargious PM, Norton P, Larsen ET, Ghali WA (2006). Association of socio-economic status with diabetes prevalence and utilization of diabetes care services. BMC Health Serv. Res. 6:124.
Crossref
|
|
|
|
|
Repetti RL, Taylor SE, Seeman TE (2002). Risky families: Family social environments and the mental and physical health of offspring. Psychol. Bull. 128(2):330-366.
Crossref
|
|
|
|
|
Riaz M, Basit A, Hydrie MZ, Shaheen F, Hussain A, Hakeem R, Shera AS (2012). Risk assessment of Pakistani individuals for diabetes (RAPID). Prim. Care Diabetes 6(4):297-302.
Crossref
|
|
|
|
|
Ryden L, Standl E, Bartnik M, Van den Berghe G, Betteridge J, de Boer MJ, Cosentino F, Jönsson B, Laakso M, Malmberg K, Priori S (2007). Guidelines on diabetes, pre-diabetes, and cardiovascular diseases: full textThe Task Force on Diabetes and Cardiovascular Diseases of the European Society of Cardiology (ESC) and of the European Association for the Study of Diabetes (EASD). Eur. Heart J. 28(1):88-136.
|
|
|
|
|
Sacks DB, Arnold M, Bakris GL, Bruns DE, Horvath AR, Kirkman MS, Lernmark A, Metzger BE, Nathan DM (2011). Position statement executive summary: guidelines and recommendations for laboratory analysis in the diagnosis and management of diabetes mellitus. Diabetes Care 34(6):1419-1423.
Crossref
|
|
|
|
|
Salleh MR (2008). Life Event, Stress and Illness. Malays. J. Med. Sci. 15(4):9-18.
|
|
|
|
|
Shaikh BT, Hatcher J (2005). Health seeking behaviour and health service utilization in Pakistan: challenging the policy makers. J. Public Health 27(1):49-54.
Crossref
|
|
|
|
|
Shonkoff JP, Boyce WT, McEwen BS (2009). Neuroscience, Molecular Biology, and the Childhood Roots of Health Disparities Building a New Framework for Health Promotion and Disease Prevention. J. Am. Med. Assoc. 301(21):2252-2259.
Crossref
|
|
|
|
|
Siren R, Eriksson JG, Vanhanen H (2012). Waist circumference a good indicator of future risk for type 2 diabetes and cardiovascular disease. BMC Public Health 12:631.
Crossref
|
|
|
|
|
Smith SM, Vale WW (2006).The role of the hypothalamic-pituitary-adrenal axis in neuroendocrine responses to stress. Dialogues Clin. Neurosci. 8(4):383-395.
|
|
|
|
|
Steyn K, Damasceno A (2006). Lifestyle and related risk factors for chronic diseases. In: Jamison DT, Feachem RG, Makgoba MW, Bos ER, Baingana FK, Hofman KJ, Rogo KO, editors. SourceDisease and Mortality in Sub-Saharan Africa. 2nd edition. Washington (DC): World Bank; 2006. Chapter 18.
|
|
|
|
|
Stiglic G, Pajnkihar M (2015). Evaluation of Major Online Diabetes Risk Calculators and Computerized Predictive Models. PLoSONE 10(11): e0142827.
Crossref
|
|
|
|
|
Tamashiro KL, Sakai RR, Shively CA, Karatsoreos IN, Reagan LP (2011). Chronic stress, metabolism, and metabolic syndrome. Stress 14(5):468-474.
Crossref
|
|
|
|
|
Tassaduqe K, Ali M, Salam A, Latif M, Afroze N, Masood S, Umar S (2004). Hypertension in relation to obesity, smoking, stress, family history, age and marital status among human population of Multan, Pakistan. I. Med. Sci. 4(8):30-35.
|
|
|
|
|
van der Berg JD, Stehouwer CD, Bosma H, van der Velde JH, Willems PJ, Savelberg HH, Schram MT, Sep SJ, van der Kallen CJ, Henry RM, Dagnelie PC, Schaper NC, Koster A (2016). Associations of total amount and patterns of sedentary behaviour with type 2 diabetes and the metabolic syndrome: The Maastricht Study. Diabetologia 59(4):709-718.
Crossref
|
|
|
|
|
Wahed WYA, Hassan SK (2017). Prevalence and associated factors of stress, anxiety and depression among medical Fayoum University students. Alexandria J. Med. 53:77-84.
Crossref
|
|
|
|
|
Warren TY, Barry V, Hooker SP, Sui X, Church TS, Blair SN (2010). Sedentary behaviors increase risk of cardiovascular disease mortality in men. Med. Sci. Sports Exerc. 42(5):879.
Crossref
|
|
|
|
|
Zhang L, Zhang Z, Zhang Y, Hu G, Chen L (2014). Evaluation of Finnish Diabetes Risk Score in Screening Undiagnosed Diabetes and Prediabetes among U.S. Adults by Gender and Race: NHANES 1999-2010. PLoS One 9(5):e97865.
Crossref
|
|
|
|
|
Zhou B, Lu Y, Hajifathalian K, Bentham J, Di Cesare M, Danaei G, Bixby H, Cowan MJ, Ali MK, Taddei C, et al. (2016). Worldwide trends in diabetes since 1980: a pooled analysis of 751 population-based studies with 4.4 million participants. Lancet 387(10027):1513-1530
Crossref
|
|