Full Length Research Paper

ABSTRACT
2-D resistivity imaging and physicochemical analysis were used to investigate the intrusion of leachates on groundwater quality around a dumpsite in Tarauni Local Government Area of Kano State, Nigeria. Four (4) imaging traverse lines were established and Wenner configuration was adopted using an electrode spacing from 5.0, 10.0, 15.0 to 60.0 m. Data collected from the imaging were inverted using AGI EarthImager 2D software and the results obtained were used to construct the Geologic model section using Surfer 9.0 software. Fifteen (15) water samples were collected for the physicochemical analysis from in and around the study area. The results indicated the presence and the range of the following parameters: pH (6.86-8.1), electrical conductivity (E.C) (305 -1239 μS/cm), total dissolved solid (TDS) (215 – 747 mg/L), nitrite (NO2-) (0.18 - 0.59 mg/L), phosphate (PO4) (2.4 - 7.16 mg/L), cadmium (Cd) (0.003 - 0.3 mg/L), chromium (Cr) (0.020 - 0.79 mg/L), copper (Cu) (0.125 - 02.273 mg/L) and iron (Fe3+) (0.10 - 0.25 mg/L). All the parameters analysed were found to be above permissible limit in the control sample; this shows that the dumpsite was the source of the groundwater contamination. Traverse 3 and 4 were the mostly affected. In Traverse 3 the contamination reached a depth of about 17.1 m between 160 and 175 m along the profile while in Traverse 4 it reached a depth of about 26 m which extends from 5 to 85 m along the profile. Groundwater samples in the study area were found to be inadmissible for human consumption when results were compared with specification from WHO (2008) and NSDQW (2007) standard. Both results of the resistivity imaging and physicochemical analysis indicated the presence of contamination in the subsurface water.
Key words Dumpsite, resistivity imaging, leachate, groundwater contamination, physicochemical analysis.
INTRODUCTION
Water is one of the most vital natural resources necessary for the existence of life. In most urban cities around the world, including Nigeria’s urban cities, it is the duty of the government to provide potable water. Most often the responsibility is not adequately discharged, causing the inhabitants of those cities to look elsewhere to meet their water needs daily. The alternative may be unwholesome (Okoye and Adeleke, 1991). These alternatives include sourcing for groundwater via borehole or well and stream/river water.
Although, most groundwater is of high quality, at some locations, it is becoming increasingly difficult to maintain the purity of groundwater due to contaminations from a poorly managed waste and refuse disposal system at dumpsites/landfills. Studies have shown that the management of urban and rural waste has been a serious problem in Nigeria (Aminu et al., 2014). According to Adewuyi et al. (2010) one of the major sources of pollution of groundwater is seepages from underground storage tanks and septic tanks. Others include solid and liquid wastes from landfills, dumpsites and agricultural leaching. The solid waste undergoes a slow process of anaerobic decomposition which generates a substantial amount of leachate and varieties of hazardous pollutants with time from the decomposing products which may seep from the dumpsite into underground aquifers and thus polluting the groundwater (Ganiyu et al., 2015).
Leachates are liquid formed from decomposed waste and has high conductivity due to the presence of dissolved salts. It is generally associated with high ion concentrations and hence results in very low resistivity of the rock formations containing them. Consequently, the electrical resistivity of leachate is often very much lower than that of the natural groundwater (Cristina et al., 2012). This makes geoelectrical techniques most adequate for mapping the extent of leachate contamination around landfills (Bernstone and Dahlin, 1999). The purpose of geoelectrical surveys is to determine the subsurface resistivity distribution by making measurements on the ground surface. From these measurements, the true resistivity of the subsurface can be estimated. This development started with the introduction of practical electrical tomography field systems, like the geoelectrical Wenner pseudosection and was soon followed by effective processing and inversion software. It has provided an appreciable tool for delineating the degree and extent of contamination owing to the resistivity contrast between the contamination zone and the immediate subsurface vicinity (Enikanselu, 2008).
The electrical resistivity imaging technique is not only fast in its usage but also economical in delineating groundwater contamination, as well as other environmental issues. Though the technique is not used to directly detect contaminants, it is used in the imaging of the geological environment through which the contaminants move thereby allowing the detection and distribution of any possible contaminant. It is however, more effective to complement this geophysical technique with physicochemical analysis (Kayabali et al., 1998; Olayinka and Olayinwola, 2001).
This study aims at determining the contamination accumulation and its dispersion channels in the study area using both techniques. The use of resistivity imaging method and physicochemical analysis will present detailed information about the delineation of contaminated zones of groundwater around the dumpsite.
Location and geology of study area
The study area is located in Tarauni local government area along Maiduguri Road of Kano state, North-western Nigeria. It lies between latitude 11°58.274766’ to 11°58.43868’ N and longitude 08°33.576774’ to 08°34.773196’ E (Figure 1).

Tarauni has the same geology as Kano in general. According to Tukur et al. (2018) the region extends over two major geological structures. The southern and western parts of the region are underlain by the Basement Complex rocks and the north-eastern part by the sedimentary Chad Formation. The basement complex comprises gneisses, amphibolites, marbles and the older granites which underlie large part of Nigeria including 80% of the Kano Region (Wright, 1985). A high surface water discharge and retention exist in the basement complex zone which coincides to the western region and we have large accumulation of ground water in the north eastern zone which is part of the Chard Basin (Mustapha et al., 2014).
Groundwater occurrence within the basement complex areas is limited to fissures and weathered overburden. That is why we have two main types of aquifers in the region and they are the weathered zone and fractured zone aquifers (Yakudima, 2009). In the Chad formation, groundwater occurs within the sedimentary strata.
According to Kano State Hydrological Report from WRECA (1987), water in the basement complex area is higher relatively to the water table in the Chad formation. In the basement complex areas water level generally vary from 6 to 25 m and in rare cases may reach up to 50 m in some places. Within Chad formation, in contrast, water table ranges from 20 to 50 m.
There are presences of some earth ponds to the south-east of the study area with no visible outcrop of rocks in and around the location. Surface water is not available during the dry season, except in the few deep ponds and lakes, even on the basement complex structure, while ground water level falls rapidly through seepage, extraction by man and high evapotranspiration (Olofin, 1987).
METHODOLOGY
Electrical resistivity imaging
Electrical resistivity data were collected using the SuperSting R1/IP (Inc) system. The electrode configuration used for data acquisition is Wenner array. The electrode spacing used was taken from 5.0 to 60.0 m, with a total of four (4) traverse points. Traverses 1, 3 and 4 were 200 m in length while Traverse 2 is 100 m. The data collected were inverted using AGI EarthImager 2D software version 2.4.4 and the result is presented as a contoured pseudo-section. EarthImager turns the complicated resistivity data inversion into a simple two-step process, that is, reading a data file and running the inversion.
The mathematical tool used in solving forward and inverse problem by this software is the finite difference and the finite element method (AGI, 2002-2014). According to Dey and Morrison (1979) and Lowry et al. (1989), the finite-element method gives the best results when used to solve non-linear problems in comparison with mesh methods. Surfer version 9.0 was used to construct the Geologic model section for all the four (4) traverses.
Groundwater sample analysis
A total of fifteen (15) groundwater samples were collected from in and around the dumpsite. Seven (7) from hand-dug wells labelled as well water sample (WWSP), seven (7) from borehole water labelled as bore-hole water sample (BWSP) and one was taken from inside the dumpsite labelled as Control Control Sample (SP). The samples were taken for analysis at the Soil and Water Research Laboratory, Geography Department in Bayero University, Kano.
Plastic bottles used for collecting the water samples were pre-treated with dilute HNO3 and thoroughly rinsed with distilled water. All materials that came in contact with the samples and sample containers were thoroughly washed and rinsed with 1:1 nitric acid and distilled water. 5 mL concentrated HNO3 was added per litre to each samples at the time of collection as recommended by APHA (1985) in order to minimize the adsorption of metals onto the container walls. The samples were stored in the refrigerator prior to analysis. The samples were analyzed for electrical conductivity (E.C), total dissolved solid (TDS), nitrate (NO3-), phosphate (PO4), cadmium (Cd), chromium (Cr), copper (Cu), and iron (Fe3+). The parameters were determined with the aid of an Atomic Absorption Spectrophotometer AAS (BUCK SCIENTIFIC VGP 210). The results were tabulated in Table 1.
The spatial relation between the traverse points and the groundwater sampling points can be seen on the map in Figure 1.
RESULTS AND DISCUSSION
Resistivity results
Displayed in Figures 2, 4, 6 and 8 are the inverted resistivity sections. The modelled data were interpreted by creating a geologic cross section of the 2D inverted resistivity contour-section as shown in Traverses 1 to 4 (Figures 2 to 9). Geologic cross section were used to view the earth as if it were cut open and seen from the side and they are interpretative, since the relations can generally not be observed directly. Surfer 9.0 was used to construct the geologic section from the model inversion produced by the AGI EarthImaging software.


Traverse 1
Extending from (Lat. 11Ëš58.274766’N, Lon. 8Ëš33.576774’E) to (Lat. 11Ëš58.294212’N, Lon. 8Ëš33.68418’E) with 200 m length. From the 2D resistivity inversion and geologic section (Figures 2 and 3), five lithological layers with various electrical resistivities were distinguished.
The first layer which is the Topsoil (sand and clay) has a resistivity ranging between 10 and 100 Ωm, with varying depths of thickness as we move along the profile length. This is underlain by a very thin second layer which is the lateritic soil and is followed by moderately weathered rock material, partially fractured rock and then the basement complex.
The resistivity of these layers ranges between 10 and 100 Ωm, 30 and 300 Ωm, 200 and 600 Ωm, 500 and 1000 Ωm and greater than 1000 Ωm, respectively. There is an outcrop of a highly resistive rock material located between 95 and 110 m along the profile length. The same rock material could be seen spanning between 35 and 45 m along the profile with a depth from 4.3 to about 30 m dip.
Traverse 2
Extending from (Lat. 11Ëš58.290’N, Lon. 8Ëš33.634’E) to (Lat. 11Ëš58.338’N, Lon. 8Ëš33.660’E) with 100 m length. From the 2D resistivity inversion and geologic section (Figures 4 and 5), three lithological layers with various electrical resistivities were distinguished.
The first layer which is also the Topsoil (sand and clay) has a resistivity ranging between 10 and 100 Ωm, with varying depths of thickness as we move along the profile length. This is underlain by second layer which is the lateritic soil and then followed by the third layer which is weathered rock material. The resistivity of these layers ranges between 10 and 100 Ωm, 30 and 300 Ωm, 200 and to 577 Ωm, respectively.
Traverse 3
Extending from (Lat. 11Ëš58.34376’N, Lon. 8Ëš33.614394’E) to (Lat. 11Ëš58.43868’N, Lon. 8Ëš33.67794’E) with 200 m length. From the 2D resistivity inversion and geologic section (Figures 6 and 7), five lithological layers with various electrical resistivity were also distinguished.
The topsoil (sand and clay) has varying thickness over the entire profile which underlain lateritic soil. The second layer is underlain by the weathered rock material, partially fractured rock and the basement complex. The resistivity of these layers ranges between 10 and 100 Ωm, 30 and 300 Ωm, 200 and 600 Ωm, 500 and 1000 Ωm, and 1000 and 2633 Ωm, respectively.
Traverse 4
Extending from (Lat. 11Ëš58.431018’N, Lon. 8Ëš33.67953’E) to (Lat. 11Ëš58.373754’N, Lon. 8Ëš33.773196’E) with 200 m length. From the 2D resistivity inversion and geologic section (Figures 8 and 9), five lithological layers with various electrical resistivities were distinguished. The first layer which is the topsoil (sand and clay) has a resistivity ranging between 10 and 100 Ωm, with a depths 34 m as we move 20 to 70 m along the profile length and a depth of 25 m (130 to 190 m along the profile length). This is underlain by a very thin second layer which is the lateritic soil. The second layer is underlain by the third layer which is the moderately weathered rock material and then the partially fractured rock as the fourth layer. The basement complex is the fifth layer. The resistivity of these layers ranges between 10 and 100 Ωm, 30 and 300 Ωm, 200 and 600 Ωm, 500 and 1000 Ωm and 1000 and 4179 Ωm, respectively.
The resistivity of the 2D inverse models for the subsurface vary from 1 to 100000 Ωm in Traverse 1, 8.8 to 577 Ωm in Traverse 2, 1 to 2633 Ωm in Traverse 3 and in Traverse 4 it is 1 to 4179 Ωm. The result of this study revealed the presence of five layers in Traverse 1, 3 and 4. Traverse 2 has only three layers. Water bearing paths have been identified to exist between the weathered and fractured zone, this paths may also serves as transmission path for contaminants into the ground aquifer. The weathered and fractured zone in Traverse 1 extends from the beginning of the profile to about 150 m mark with a thickness ranging between 17.1 and 28 m. In Traverse 2, only the weathered basement was found to be present and has a horizontal width of about 40 m and it is located at a depth of about 8.6 m away from the surface. In Traverse 3, the narrow layers of the weathered and fractured zone overlap the basement complex with a thickness of about 8 to 15 m, which extends from 20 m to 120 m along the profile length. In Traverse 4, the weathered and fractured zone is very narrow and stretches over the basement complex. They are located between 85 and 145 m along the profile length with a thickness of about 4 to 10 m. This study revealed that Traverse 1 has the major aquifer (that is, best location for ground water exploitation) because it has a more stable basement with water bearing zone existing from the beginning of the profile point to about 150 m mark with a thickness at a depth between 17.1 and 28 m.
The 2D inversion delineated areas with very low resistivity values of about 1 to 10 Ωm, from the ground surface to varying depths of 0 to 8.6 m in Traverse 1; 0 to 4.3 m in Traverse 2; 0 to 12.9 m in Traverse 3; and 0 to 25.7 m in Traverse 4. These areas of low resistivity values are suspected to contain contamination plumes. The plumes are suspected to have percolated into the groundwater through the Transmission channels.
Physicochemical results
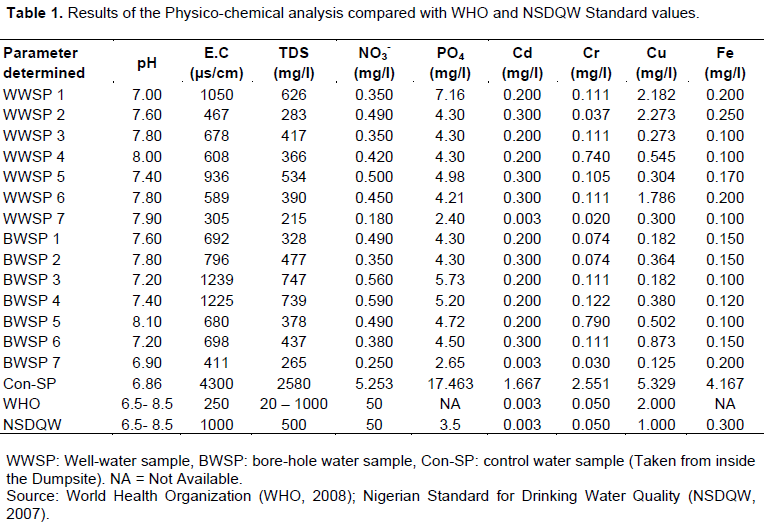
The results of the physicochemical parameters of the water samples from the study area are presented in Table 1.
DISCUSSION
pH
The mean pH for the water samples was 7.5, which was within the WHO and NSDQW standards (6.5-8.5). A pH less than 7 can impart taste to water or lead to corrosion of plumbing (Ano and Okwunodulu, 2008).
Conductivity (E.C)
The conductivity of the water samples ranged between 305 µS/cm (WWSP7 well water) and 1239 µS/cm (BWSP3 borehole water), with the control sample having a value of 4300 µS/cm. The maximum permissible limits for conductivity of drinking water are 250 mS/cm for WHO and 1000 mS/cm by NSDQW (Table 1). Values exceeding 1000 mS/cm limit is indicative of saline intrusions into the groundwater (Adewuyi et al., 2010). E.C. values in samples WWSP 1, BWSP 3 and BWSP 4 are 1050, 1239 and 1225 µS/cm, respectively which are high and above permissible limit. This may be due to the presence of some dissolved ions as suggested in study conducted by Egereonu and Odumegwu (2006).
Total dissolved solid (TDS)
The TDS values obtained for all the samples ranged from 215 mg/L (WWSP7 well water) to 747 mg/L (BWSP3 borehole water), with the control sample having a value of 2580 mg/L. Samples such as WWSP1, WWSP5, BWSP3 and BWSP4 with values 626, 534, 747 and 739 mg/L, respectively are above the 500 mg/L maximum permissible limit set by NSDQW and <600 mg/L by WHO for drinking water (Table 1).
There is a direct relationship between EC and TDS in the sense that, the higher the total dissolved solids (TDS) the higher the conductivity and the mineralization possibility of the groundwater (Onoja and Akinola, 2016). According to Pragathiswaran et al. (2008), the presence of TDS in excess quantity can make the water to have an undesirable taste, also causing gastro intestinal irritation and corrosion in metals.
Nitrates
The concentrations of nitrates ranged from 0.180 to 0.590 mg/L in the water samples and the value of control sample is 5.253 mg/L. All the samples are within the permissible limit for nitrate. The permissible standard given by WHO and NSDQW for nitrates in potable water is 50 mg/L. Low levels of naturally occurring nitrate can be normal, but excess amounts can pollute groundwater. Common sources of nitrate in groundwater are fertilizers, livestock waste, and human waste associated with septic and municipal wastewater systems (CCAMP-GAP, 2013).
Phosphate
Phosphate concentrations in the water samples ranged from 2.400 mg/L (WWSP 7) to 7.160 mg/L (WWSP 1), with 17.463 mg/L in the control sample. PO4 is above permissible limits of 3.500 mg/L set by NSDQW in all the samples except in WWSP 7 and BWSP 7 having values of 2.400 and 2.650 mg/L, respectively. Excess consumption of phosphate can lead to carcinogenic conditions of the soft and delicate tissue in the body.
Cadmium (Cd)
The WHO and NSDQW Permissible Limits for Cadmium in Potable Drinking Water is 0.003 (mg/L). The cadmium concentration in all the samples is very high above the permissible limits except in sample WWSP 7 and BWSP 7 at 0.003 mg/L and the value of the control sample is 1.667 mg/L. It is toxic to the kidney if the concentration in drinking water is above 0.003 (mg/L). Contamination of drinking-water may have occurred as a result of the presence of cadmium as an impurity in the scraps of zinc in the galvanized pipes or cadmium-containing solders in fittings, water heaters, water coolers and taps (WHO, 2008).
Chromium (Cr)
The chromium concentrations ranged from 0.020 mg/L (WWSP 7) to 0.790 mg/L (BWSP 5), with the control sample having a value of 2.551 mg/L. The maximum permissible standards for Chromium in drinking water set by WHO and NSDQW is 0.05 mg/L (Table 1). The Cr concentrations for the borehole water samples BWSP 1, BWSP 2, BWSP 3, BWSP 4, BWSP 5 and BWSP 6 were 0.074, 0.074, 0.111, 0.122, 0.79 and 0.111 mg/L, respectively. The well water samples WWSP 1, WWSP 3, WWSP 4, WWSP 5 and WWSP 6 are 0.111, 0.111, 0.74, 0.105 and 0.111 mg/L, respectively were all above the maximum permissible limit set by WHO and NSDQW (Table 1). Ingestion of water with Cr concentration above 0.05 mg/L can lead to cancer or allergic dermatitis (NSDQW, 2007). Chromium and its salts are used in the leather tanning industry, the manufacture of catalysts, pigments and paints, fungicides, the ceramic and glass industry, and in photography, and for chrome alloy and chromium metal production, chrome plating, and corrosion control (WHO, 2008).
Copper (Cu)
The permissible standard limit for copper in potable water is 2 mg/L according to WHO and 1 mg/L for NSDQW. Samples WWSP 1 (2.182 mg/L), WWSP 2 (2.273 mg/L) and WWSP 6 (1.786 mg/L) are above the permissible limit set by NSDQW. Concentrations above the permissible limits can cause gastro intestinal disorder (Afolabi et al., 2012).
Iron (Fe)
The permissible standard stated by WHO and NSDQW for iron in potable water is 0.3 mg/L. The concentrations obtained for all the water samples were lower than the maximum permissible limit.
Control sample
The control sample was taken from inside the dumpsite and it shows an excessively high level of concentration of the parameter analysed which were above permissible limits given by WHO and NSDQW. This is an indication that the groundwater quality in the area might have been contaminated by the presence of the Landfill/Dumpsite.
Higher values of the measured parameters in the water samples from the various locations indicate that the contaminations of the groundwater mainly resulted directly or indirectly from infiltrations of solid waste leachate, and this fact is also confirmed by geophysical data (Akankpo and Igboekwe, 2011).
CONCLUSIONS
This study was carried out to access the effect of leachates on groundwater quality condition around Tarauni dumpsite/landfill area in Kano, Northwestern Nigeria. The tools used in this assessment were the geo-resistivity imaging method and physicochemical analysis of sampled water, which proved to be very effective and complementary with each other. The following conclusions were drawn from the study area.
The study area consists of five layers: topsoil, lateritic soil, weathered basement rock, fractured basement rock and fresh basement complex rock. Likewise, the 2D inversion showed anomalies in the resistivity values of some zones of the subsurface of the areas studied. The zones were having extremely low resistivity values of between 1 and 10 Ωm which is an indication of leachate plume.
The water quality result (Table 1) showed the presence of heavy metals. Chromium (Cr) exceeded the permissible limits in all samples except in WWSP2, WWSP 7 and BWSP 7. Copper (Cu) exceeded the permissible limits in samples WWSP 1, WWSP 2 and WWSP 6. Iron (Fe) and compound of nitrite are within permissible limits in all samples. Both cadmium (Cd) and phosphate are above permissible limits in all the samples collected except in WWSP 7 and BWSP 7. Also, TDS and EC are both above permissible limits in samples WWSP 1, WWSP5, BWSP 3 and BWSP 4 only. From the aforementioned, the water quality in the study areas has deteriorated beyond permissible limits set for human usage. Therefore, the groundwater is inadmissible for human consumption.
Traverse 1 has the deepest and widest channel of flow followed by Traverse 3 and then 4. These flow paths are identified as water bearing zones. The flow paths can also be a transmission channels for the leachate plume.
CONFLICT OF INTERESTS
The authors have not declared any conflict of interests.
REFERENCES
|
Adewuyi GO, Oputu OU, Opasina MA (2010). Assessment of Groundwater Quality and saline intrusions in Coastal Aquifers of Lagos Metropolis, Nigeria. Journal of Water Resource and Protection 2:849-853. |
|
|
Afolabi TA, Ogbuneke CC, Ogunkunle OA, Bamiro FO (2012). Comparative Assessment of the Potable Quality of Water from Industrial, Urban and Rural Parts of Lagos, Nigeria. Ife Journal of Science 14(2):221-232. |
|
|
AGI (2002-2014). Advanced Geosciences, Inc. Instruction Manual for EarthImager 2D Version 2.4.2 Resistivity and IP Inversion Software. 2121 Geoscience Drive, Austin, Texas. |
|
|
Akankpo AO, Igboekwe MU (2011). Monitoring groundwater contamination using surface electrical resistivity and geochemical methods. Journal of Water Resource and Protection 3(318). |
|
|
Aminu MB, Ajayi OO, Adelabu OG (2014). Geochemical Analyses of Domestic Groundwater Sources in Okeagbe-Akoko, South-western Nigeria. IOSR Journal of Applied Geology and Geophysics 2(2):29-34. |
|
|
Ano AO, Okwunodulu FU (2008). Effect of population and level of industrialization on underground water quality of Abia State, Nigeria Physicochemical properties. African Journal of Biotechnology 7(4):439-443. |
|
|
American Public Health Association (APHA) (1985). Standard methods for examination of water and waste water. American Public Health Association.16th edition. Washington, D C. pp. 23-29. |
|
|
Bernstone C, Dahlin T (1999). Assessment of two automated DC resistivity data acquisition systems for landfill location surveys: Two case studies. Journal of Environmental and Engineering Geophysics 4(2):113-121. |
|
|
CCAMP-GAP (2013). Nitrate fact sheet on drinking water. |
|
|
Cristina P, Cristina D, Alicia F, Pamela B (2012). Application of Geophysical methods to waste disposal studies, municipal and Industrial waste disposal. Dr Xian-Ying Yu (Ed), In Tech, ISBN 978-953-51-0501-5. |
|
|
Dey A, Morrison HF (1979). Resistivity modeling for arbitrary shaped two-dimensional structures. Geophysical Prospecting 27:106-136. |
|
|
Egereonu UU, Odumegwu E (2006). Selected groundwater Investigation in Cross-river state of Nigeria, for encrustation and corrosion characteristics. Journal Chemical. Sociology., Nigeria 31(1&2):168-175. |
|
|
Enikanselu PA (2008). Detection and monitoring of dumpsite-induced groundwater contamination using resistivity method. The Pacific Journal of Science and Technology 9(1):254-262. |
|
|
Ganiyu SA, Badmus BS, Oladunjoye MA, Aizebeokhai AP, Olurin OT (2015). Delineation of Leachate Plume Migration Using Electrical Resistivity Imaging on Lapite Dumpsite in Ibadan, Southwestern Nigeria. Geosciences 5(2):70-80. |
|
|
Kayabali K, Yueksel FA, Yeken T (1998). Integrated use of Hydrochemistry and resistivity methods in ground water contamination caused by recently closed solid waste site. Environmental Geology 36(3/4):227-234. |
|
|
Lowry T, Allen MB, Shive PN (1989). Singularity removal: A refinement of resistivity modeling techniques. Geophysics 54(6):766-774. |
|
|
Mustapha A, Yakudima II, Alhaji M, Nabegu AB, Dakata FAG, Umar YA, Musa BU (2014). Overview of the Physical and Human setting of Kano region, Nigeria. Researchjournali's Journal of Geography 1(5):1-12. |
|
|
National Aeronautic and Space Administration (NASA) (2018). National Aeronautic and Space Administration Spot Image, 2018. Asf.alaska.edu |
|
|
Nigerian Standard for Drinking Water Quality (NSDQW) (2007). Nigerian Standard for Drinking Water Quality. Nigerian Industrial Standard NIS 554, Standard Organization of Nigeria, 5-30. |
|
|
Okoye COB, Adeleke BB (1991). Water quality in Akure, Nigeria. Environ. Manage. Health 2:13-18. |
|
|
Olayinka AI, Olayinwola MA (2001). An Integrated use of Geoelectric Imaging and Hydrochemical methods in delineating limits of polluted surface and groundwater at a landfill site in Ibadan area, Southwestern, Nigeria. Journal of Mining and Geology 37(1):53-68. |
|
|
Olofin EA (1987). Some Aspect of Physical Geography of Kano Region and Related Human Responses: Debis Press Kano. |
|
|
Onoja OS, Akinola MA (2016). 2D Resistivity Imaging and Hydrochemical Analysis of Groundwater Contamination Induced By Abattoir Wastes at Atenda, Southwestern Nigeria. New York Science Journal 9(5):61-67. |
|
|
Pragathiswaran C, Paruthiral G, Prakash P, Jeya P, Suganandam K (2008). Status of Groundwater Quality in Hosur during summer. Ecology, Environment and Conservation 14(4):605-608. |
|
|
Tukur AI, Nabegu AB, Umar DA, Olofin EA, Sulaiman WNA (2018). Groundwater Condition and Management in Kano Region, Northwestern Nigeria. Hydrology 5(16):1-21. |
|
|
WHO (2008). Guidelines for drinking-water quality [electronic resource]: incorporating 1st and 2nd addenda, Vol.1, Recommendations (3rd ed.). Geneva. |
|
|
Water Resources Engineering and Construction Agency (WRECA) (1987). Kano State Hydrological Report Vol. 4. |
|
|
Wright JB (1985). Geology and Mineral Resources of West Africa. London: Allen & Unwin, 187. |
|
|
Yakudima II 2009. Spatial Distribution and Implication of Groundwater Utilisation in Dala Local Government Area. Techno Science Africana Journal 3(1):81-87. |
|
Copyright © 2024 Author(s) retain the copyright of this article.
This article is published under the terms of the Creative Commons Attribution License 4.0


