Full Length Research Paper

ABSTRACT
The Osogbo central solid waste dumpsite in Osun State, Nigeria falls within the Ilesha Schist Belt, southwestern basement complex of Nigeria. Thirty-three (33) Vertical Electric Sounding (VES), and 2-D Electric Resistivity Tomography (ERT) data were acquired across various locations in the study area using ABEM Terrameter SAS 300, respectively. Schlumberger configuration with a maximum spread length of 100 m, for the VES was used, while four traverses of ERT were conducted, using Dipole-Dipole Array with average traverse length of 112.50 m. A smoothness-constrained least-squares inversion was then applied to the ERT data using a 2-D inversion algorithm [that is, DIPRO for Windows, version 4.01. Generally, the results defined the contaminated leachate plumes as electrically conductive, with anomalous resistivity values. Both the VES and the 2-D tomography identified zones of low resistivity values, between 24 and 67 ?m, from 10 to 20 m deep, as leachate contaminant plumes. Some of the weathered and fractured basement rocks indicated that the subsurface soil and groundwater have been contaminated by the leachates, which appears to have migrated outside landfill site. Zones within the sub-surface, with resistivity values relatively high (> 300 Ωm) and depth above 30 m might be pollutant free. Solid wastes management calls for the adoption of the best practicable environmental management approach through the governments’ enforcement of circular economic policies, using extended producer responsibility (EPR) model and construction of engineered landfills to replace unsanitary landfills. The conduct of environmental impact assessment (EIA), prior to commencement of operations and phytoremediation of closed sites is also crucial.
Key words: Tomography, leachate, pollution, contaminant plume.
INTRODUCTION
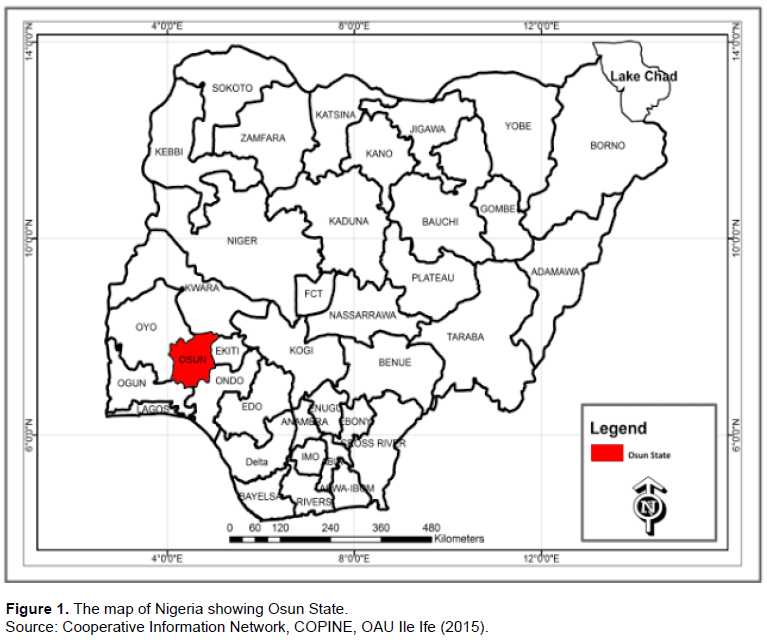
The expansive development in Osogbo, the Osun State (Figure 1) capital in Nigeria, occasioned population rise in the state capital and beyond. The increased population and urbanization had resulted in the increased production of Municipal Solid Wastes (MSW). The inability to properly manage these wastes generated poses a great concern. Waste disposal and management remain two of the major challenges in poor underdeveloped and developing cities, where improperly disposed wastes could put surface and ground water at risk of contamination. Landfills/dumpsites serve as the ultimate recipient of municipal solid wastes. It is a common waste management practice employed by many nations in many parts of the world (Jhamnani and Singh, 2009). Groundwater contamination from landfills often results from leaking "leachate”, water that has percolated through waste and accumulated various ions in solution (Bhuiyan et al., 2011). The handling of solid wastes (S.W.) calls for immediate attention and adoption of the best practicable environmental management/approach, towards preserving the environment. In achieving a sustainable solid waste management strategies (SSWMS), all effective practicable management processes in that regard must be functional, as wastes are be ingenerated. They include solid wastes characterization, collection, transportation and treatment.
Dumpsite-related geophysical surveys especially the two dimensional geoelectrical imaging have frequently been used in the subsurface pollution studies (Carpenter et al., 1990; Bernstone and Dahil, 1997; Samsudin et al., 2006; Irunkwor and Abanjo, 2022). The electrical resistivity method maps the distribution of resistivity of subsurface materials and it is also used in delineating areas affected by the leached substances (Offodile, 2002).
Due to its efficiency and effectiveness in producing images of the subsurface, the resistivity-imaging method has now become more popular in electrical exploration. The 2-D geoelectrical resistivity imaging actually measures the apparent resistivity of the subsurface, which can be inverted to develop a model of the subsurface structure and stratigraphy in terms of its electrical properties (Dahlin and Zhou, 2002; Samsudin et al., 2006; Meju, 2000).
This paper discusses the results of VES and 2-D resistivity imaging which were conducted to identify and delineate the extent of leachate plume generation at Osogbo central dumpsite. The resistivity image provides general information on subsurface geology and condition of buried waste and contaminated soil, below the lines of traverse.
Location and geology of the study area
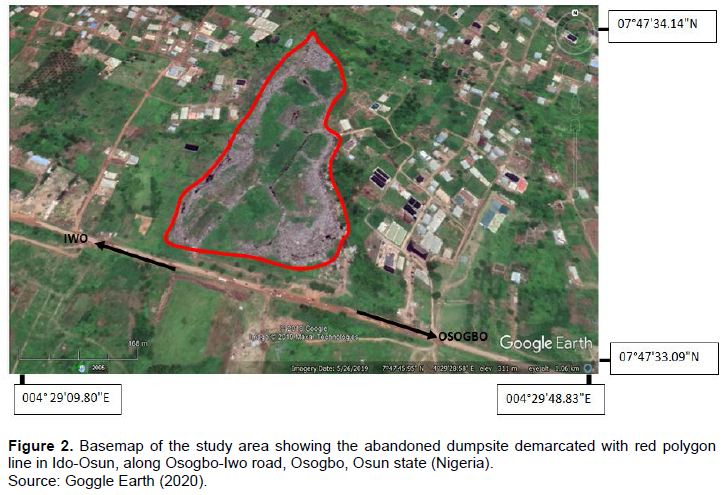
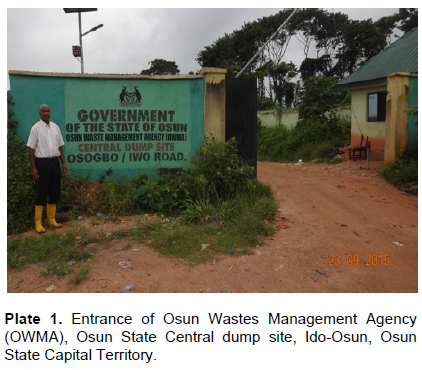
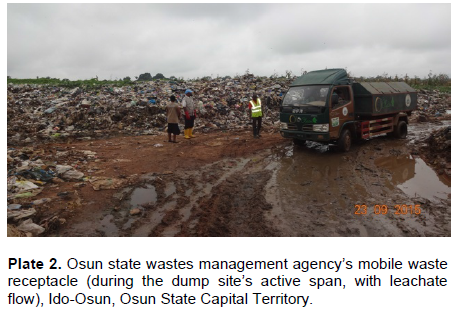
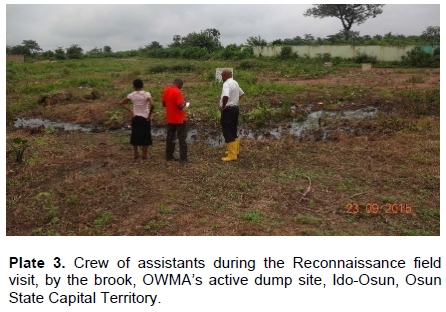
The study area is an abandoned dumpsite located in Onibu-Eja of Ido-Osun area, at the outskirt of Osogbo in Osun State (southwesten Nigeria), within Latitudes 07° 53' 33.09” North and 07° 53' 34.14” North and Longitudes 04° 29' 09.80” East and 04° 29' 48.83" East (Figure 2 and Plates 1 to 3). The project site situates along Osogbo-Iwo road. It was active until about 2018, before it was relocated. The site covers an area of 79 200 m2. The study area has an undulating topography as a result of the dumping of refuse over a period of time; hence, artificial hills were created. There are also natural uplands/hills.
The study area falls within the southwestern Basement Complex of Nigeria, which had been described in detail in various publications of the Geological Survey of Nigeria (GSN), and by various authors, such as Oyawoye (1972), Ajibade (1972), McCury (1976), Rahaman (1976), Rahaman (1998) and Oyelami et al. (2013).
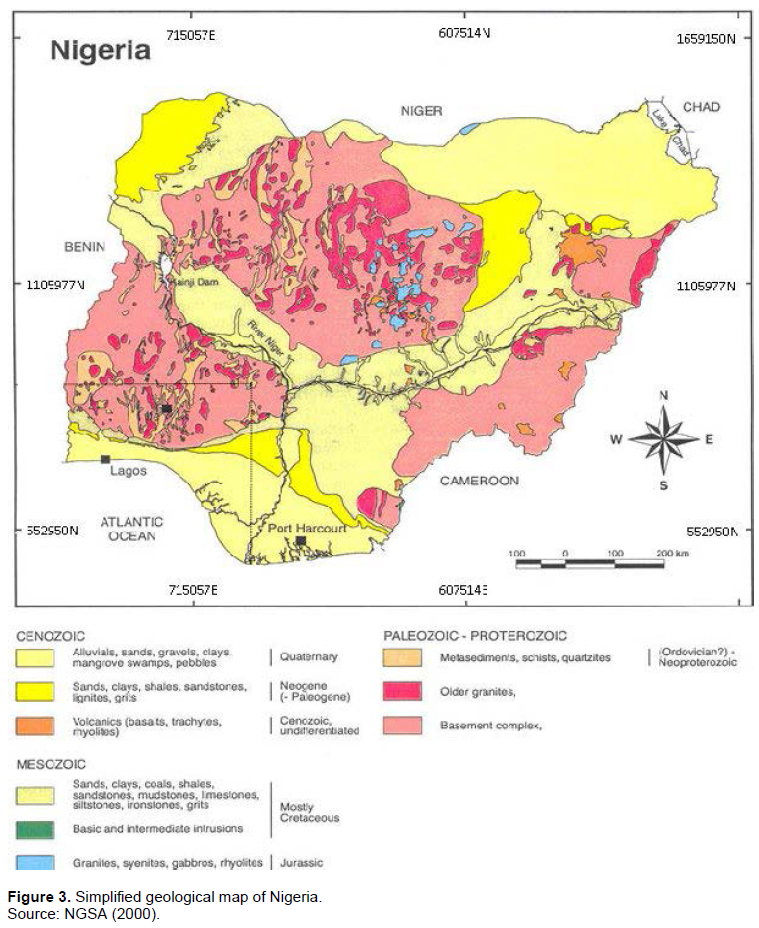
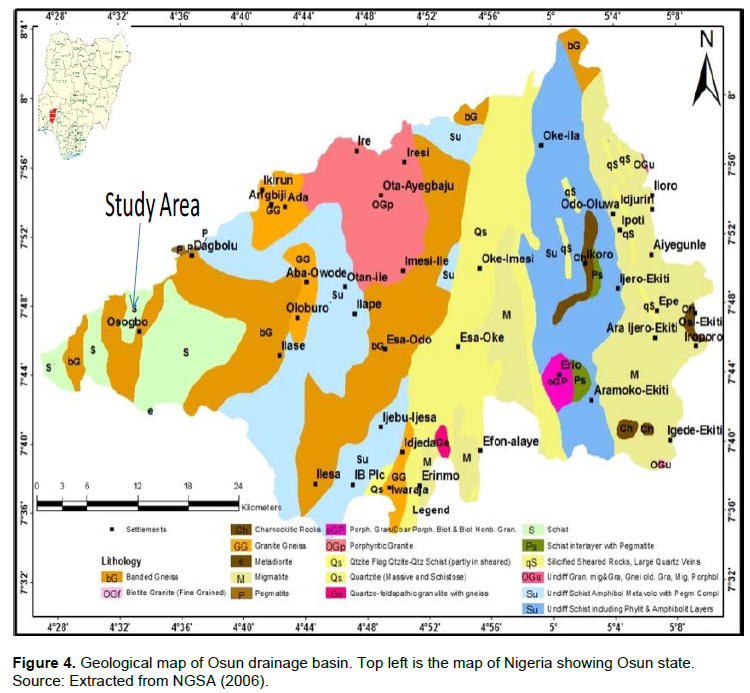
The area falls within Ilesha Schist Belt (Figures 3 and 4). The main lithotypes are represented by amphibolites, pegmatite and quartzite. Quartzites outcrop as a massive ridge, well visible in the southern part of the area, with only a few exposures occurring as boulders. Pegmatites are the most widespread.
METHODOLOGY
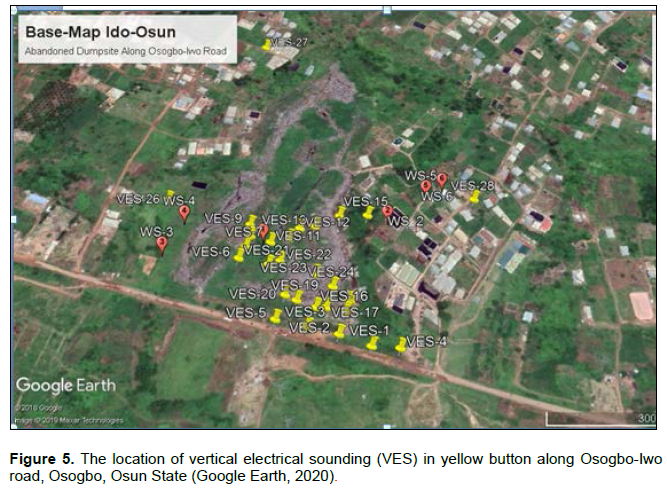
Thirty-three (33) VES were conducted across various stations in the study area (Figure 5) using ABEM Terrameter SAS 300. The measurement technique adopted was Schlumberger configuration with a maximum spread length of 100 m. The depth range of the measurement was customarily increased by an outward displacement of the current electrodes. The typical field procedure was to transmit current (I) through the electrode (C1 and C2), while the resulting ground voltage (V) was measured with the potential electrode (P1 and P2) (Figure 6). Details about the survey and interpretation method can be found in published papers by Keller and Frischknecht (1966), Griffiths et al. (1990), Griffiths and Barker (1993) and Loke and Barker (1996). The computation of the apparent resistivity (ρa) was achieved using the values of the apparent resistance (Ra) and geometric factor (Gs) for Schlumberger array:
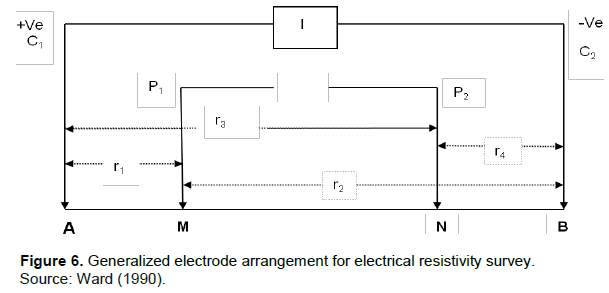

Gs is the geometric factor for Schlumberger array mainly affected by electrode arrangement and Ra is the field apparent resistance measured from the equipment.
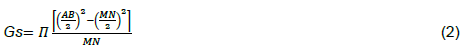
Equation (1) can also be written as:
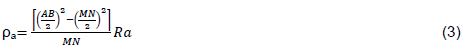
where AB is the distance separating the two current electrodes while MN is the separating distance between the potential electrodes
The vertical electric sounding (VES) was deployed, prior to ERT investigation. Four ERT traverses were conducted, using Dipole-Dipole Array (Figure 6) to investigate a total of one hundred and fifty-four (154) data points, which produced 2-Dimensional Imaging of the survey (Figures 11 to 15). The apparent resistivity (ρa) was recorded in ohm meter at each dipole separation. In Dipole-Dipole array, the values obtained were plotted on a depth section along intersecting 45°, beneath the centre of the dipoles. At the end of each session, the entire array was moved by a distance equal to one dipole separation and the process was repeated.
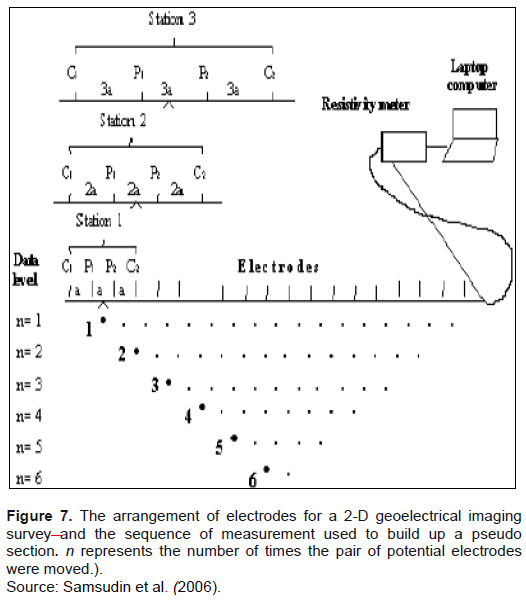
To interpret the 2-D resistivity data, a 2-D model for the subsurface consisting of a large number of rectangular blocks was used (Figure 7). The inversion software, Kigam Dipro for Windows version 4.01 (2001), was used to determine the resistivity of the block so that the calculated apparent resistivity values agree with the measured apparent resistivity values from the field survey. The apparent resistivity of dipole-dipole array is given by:
ρa = πRna(n+1)(n+2) (4)
or
ρa = πn(n+1)(n+2)a ?V/I (5)
where n= expansion factor, a = electrode spacing, R = resistance measured, I is the current, and ?V is the potential difference. The theoretical depth of investigation is approximately 0.2AB. The dipole-dipole array gives good quality information of the subsurface in both vertical and horizontal directions (Ward, 1990; Zume et al., 2006). Increase in separation between the dipoles (C1-C2 and P1- P2) (Figure 7) increases depth of investigation. The inter-electrode spacing (a) was equal to 10 m, whereas the expansion factor (n) was equal to 4 m. The total length of the transverse profile was 100 m for traverse 1 (Figures 11 and 12), traverse 3 (Figure 14) and traverse 4 (Figure 15), respectively, while traverse 2 (Figure 13) was equal to 150 m.
RESULTS AND DISCUSSION
Figure 8 provides a representation of VES lithotypes images. It shows a layer of top soil that was directly underlain by another layer of lateritic soil. Both were less than 5 m thick. The resistivity values for top soil range from 40 to 67 Ωm; 31 to 48 Ωm for lateritic soil located at the west end of the site and at an average depth of 20 m. At such low resistivity, pollution was eminent. About 15 m to the base of the fractured layer at the east end, where the resistivity value was as high as 482 Ωm, there could be very little or no contaminants. The weathered layer was aquiferous, though its integrity might be in doubt, as a result of its proximity to the overlying thin layers of top soil and laterite.
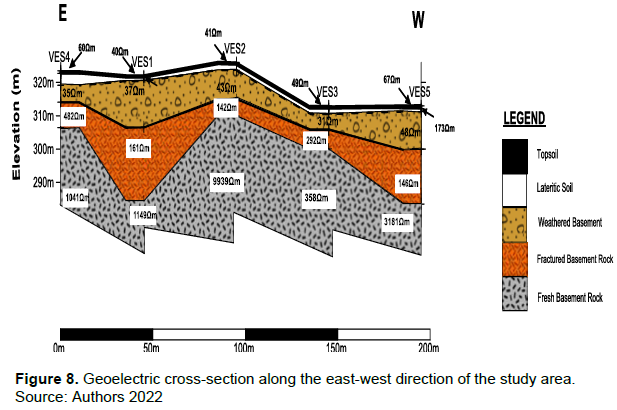
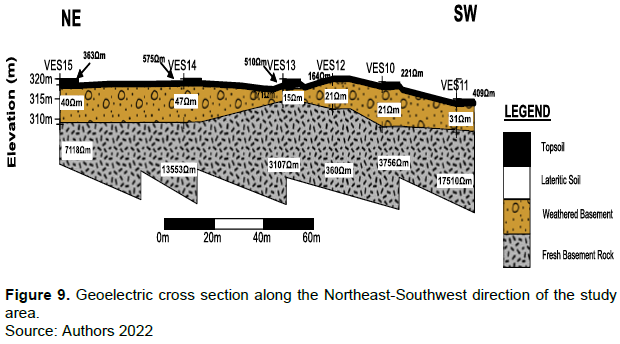
Figure 9 trends NE-SW direction with top soil overlying the weathered layer. Between the two layers, a very thin smear of lateritic soil was interposed. The aquiferous weathered layer has very low resistivity signature, between 15 and 47 Ωm, and a thickness of about 10 m, hence, prone to pollution.
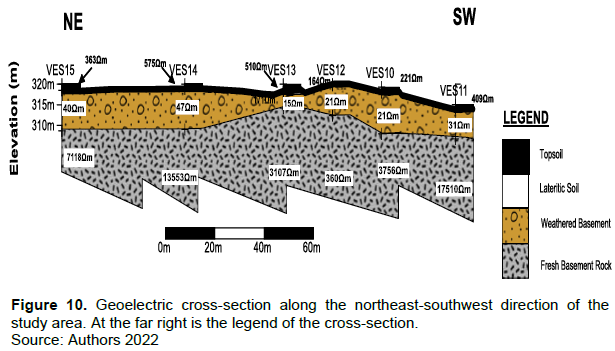
The section of Figure 10 trends NE-SW direction with top soil overlying the weathered layer. Between the two layers, a very thin smear of lateritic soil was interposed. The aquiferous weathered layer has very low resistivity signature, between 15 and 47 Ωm, and a thickness of about 10 m, hence, prone to pollution.
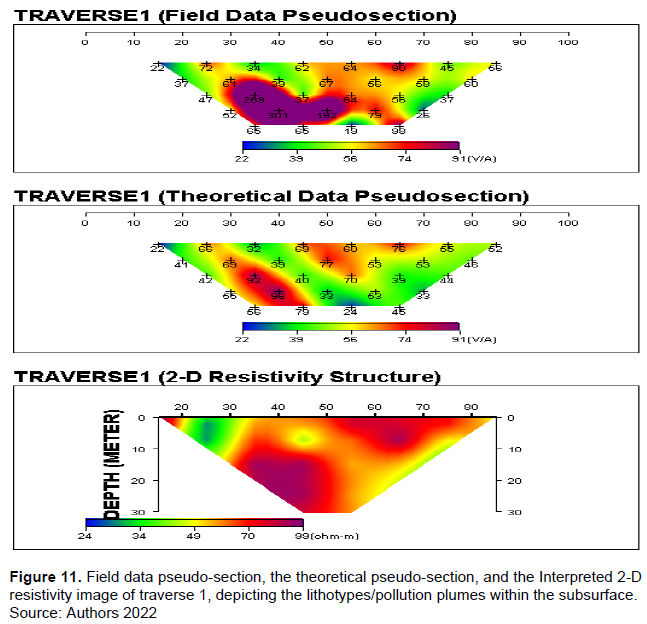
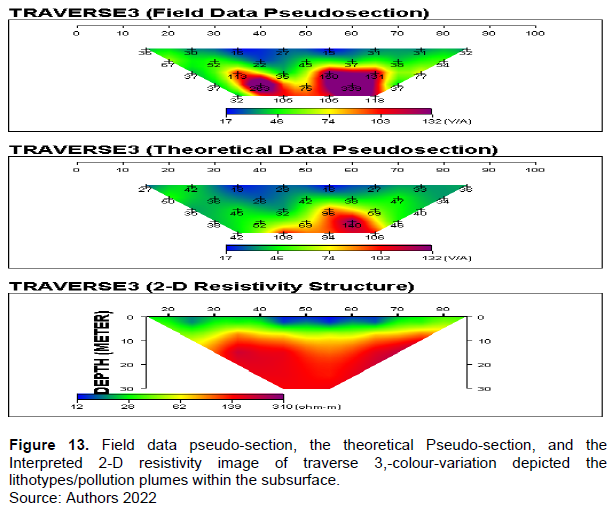
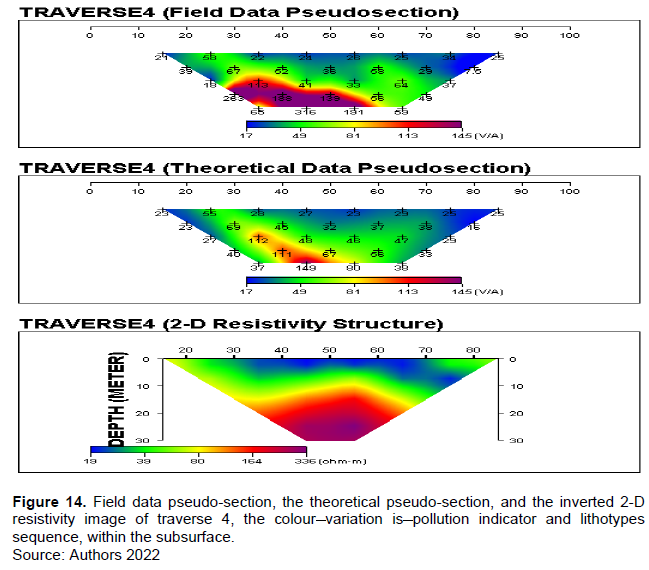
These results agreed with the 2-D results, as shown in Figures 11 to 14. In all the 2-D structures, the blue-green colour shows areas with low resistivity values, suspected contaminant plumes and weathered zone; while red to purple colour indicates the presence of areas with high resistivity values. In traverse 1 (Figure 11), the low resistivity areas recorded values ranging from 24 to 34 Ωm, which was an indication of pollution. Other areas within the sub-surface as shown in the 2-D image, which had purple colour, might be fractured basement rock that may be free of pollution. The results of the VES and the 2D imaging agree with the work of Bayowa et al. (2015).
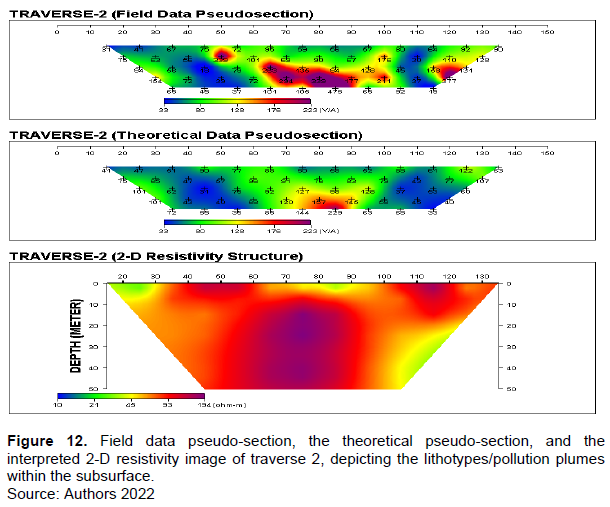
In traverse 2 (Figure 12), the resistivity values were relatively low, ranging from 10 to 21 Ωm. The yellow to red zone was a transition from low to high resistivity. Areas within the sub-surface, as shown in the 2-D image which had purple colour, were relatively areas with high resistivity values, which indicated minute or non-presence of pollutants at the fractured basement.
In the 2-D resistivity structure of traverse 3, as shown in Figure 13, the resistivity values of these areas were low, ranging from 12 to 28 Ωm. Other areas within the sub-surface, with purple colour, were zones of high resistivity (greater than 300 Ωm) and might be pollutant free. The yellow to red colour zone is suspected to be a transition area, from the very low to high resistivity section, with resistivity values of about 55 to 170 Ωm. The zone might be fractured basement rock and suspected to be free of contamination.
In the 2-D resistivity structure of traverse 4, as shown in Figure 14, blue and green coloured zone shows areas within the subsurface with relatively low resistivity values suspected to contain the contaminant plumes. The blue colour indicates the presence of areas that were suspected to be polluted. The resistivity in these areas is relatively low, with values ranging from 19 to 39 Ωm. Areas within the subsurface, which has purple colour, have relatively high resistivity, greater than 300 Ωm. These areas are suspected to be fractured basement rock.
A quick vertical glance at the ERT images (figure 11 to 14) confirms the sequence as seen in Figures 8 to 10, from the porous and permeable weathered zone to the impermeable fresh basement zone. It showed that the pollution plumes were concentrated at the near surface zones, at west of the study area.
CONCLUSION
Vertical electrical sounding (VES) and 2D imaging have been successfully used to map the contaminant plume and characterize the subsurface of the study area, in terms of distribution of resistivity values of the solid waste materials and soils beneath the site. The areas infested by the leachate could be inferred from the VES data as well as the 2D inversion sections. The weathered and fractured basement rocks, which constituted the major aquifer units in the area, were overlain by thin clayey formations, with low resistivity values at the west end, and were suspected to be contaminant plume. The 2D Inversion also delineated contamination plumes as low resistivity zones with resistivity values ranging between 24 and 67 ?m at depths of 10 to 20 m. Given these low depths of the leachate plume, it was suggested that sinking shallow water wells around the dumpsite should be avoided.
Industrial wastes contain large number of heavy metal toxicants that contaminate our diets and water. Framing appropriate laws and strict implementation by regulatory bodies, must be encouraged. Hence, it becomes obligatory for the state government to designate the site and environs as hazardous area, and adopt a sustainable environmental management system, which should include environmental impact assessment (EIA), and also ensure that the decommissioning of all unsanitary landfills must go through a sustainable integrated scientific process of remediation, reclamation and restoration, in line with national standards, (NESREA Training Manual, 2014).
CONFLICT OF INTERESTS
The authors have not declared any conflict of interests.
REFERENCES
|
Ajibade AC (1972). The Geology of the Zungeru sheet. Unpublished M.Sc. Thesis University of Ibadan. Nigeria. |
|
|
Bayowa GO, Falebita DE, Adegboyega RO (2015). Surface DC Resistivity Survey of Contamination Beneath Ido-Osun Dumpsite, Southwest, Nigeria. Geofisica Internacional 54(4):343-352. |
|
|
Bernstone C, Dahil T (1997) Electromagnetic and DC Resistivity Mapping of Waste Deposits and Industrial Sites experience from southern Sweden. European Journal of Engineering and Environmental Geophysics 2:127-136. |
|
|
Bhuiyan MA, Rakib MA, Dampare SB, Ganyaglo S, Suzuki S (2011). Surface water quality assessment in the central part of Bangladesh using multivariate analysis. KSCE Journal of Civil Engineering 15(6):995-1003. |
|
|
Carpenter PJ, Kaufmann RS, Price E (1990). Use of Resistivity Soundings to determine Landfill Structure. Ground Water 28:569-575. |
|
|
COPINE, OAU Ile Ife (2015). Cooperative Information Network Map of Nigeria showing OSUN State. OAU Ile Ife. |
|
|
Dahlin T, Zhou B (2002). Gradient and Mid-point-referred Measurements for Multi-channel 2D Resistivity Imaging. Proceedings of 8th Meeting and Engineering Geophysics, Aveiro Portugal pp. 157-160. |
|
|
Griffiths DH, Barker RD (1993). Two-dimensional resistivity imaging and modeling in areas of complex geology. Journal of Applied Geophysics 29:211-226. |
|
|
Griffiths DH, Turnbull J, Olayinka AI (1990). Two dimensional resistivity mapping with a complex controlled array. Journal of Applied Geophysics 8:121-29. |
|
|
Goggle Earth (2020). Satellite View Earth Globe Map. |
|
|
Irunkwor TC, Abanjo N (2022). 2-D Resistivity Imaging and Hydrogeochemical Analysis for Leachate Migration at Dumpsites in South-South Nigeria. International Journal of Science 5(3):57-75. |
|
|
Jhamnani B, Singh SK (2009). Groundwater contamination due to Bhalaswa Landfill Site in New Delhi. International Journal of Civil and Environmental Engineering 1:121-125 |
|
|
Keller GV, Frischknecht FC (1966). Electrical methods in geophysical prospecting. Oxford: Pergamon Press Incorporated. |
|
|
Kigam D (2001). Kigam Dipro for Windows version 4.01. Processing and interpretation software for electrical resistivity data. |
|
|
Loke MH, Barker RD (1996). Rapid least-squares inversion of apparent resistivity pseudosections by a quasi-Newton method. Geophysical Prospecting 44:131-152. |
|
|
McCury P (1976). The Geology of the Precambrian to Lower Paleozoic rocks of Northern Nigerian - a review. In: C.A. Kogbe (ed.), Geology of Nigeria. Elizabethan, Lagos pp. 15-59. |
|
|
Meju MA (2000). Environmental geophysics: tasks ahead. Journal of Applied Geophysics 44(2):63-65. |
|
|
NESREA Training Manual (2014). National Environmental Standards and Regulations Enforcement Agency, Environmental Compliance Monitoring and Enforcement. |
|
|
NGSA (2000). Nigeria Geological Survey Agency. Simplified Geological Map of Nigeria. |
|
|
NGSA (2006). Nigeria Geological Survey Agency. Geological Map of Nigeria. |
|
|
Offodile ME (2002). Groundwater study and development in Nigeria. Mecon Geology and Engineering services limited, Jos, Nigeria. Second edition 453 p. |
|
|
Oyelami AC, Aladejana JA, Agbede OO (2013). Assessment of the impact of open waste dumpsites on groundwater quality: a case study of the Onibu-Eja dumpsite, southwestern Nigeria. Procedia Earth and Planetary Science 7:648-651. |
|
|
Oyawoye MO (1972). The Basement Complex of Nigeria. In: Dessauvagie, TFJ and Whiteman AJ Eds. African Geology University of Preee, Ibadan pp. 67-69 |
|
|
Rahaman MA (1976). Review of the Basement geology of Southwestern Nigeria in Geology of Nigeria. Elizabithan Publishing Company, Nigeria pp. 41-58. |
|
|
Rahaman MA (1988). Recent advances in the study of the Basement complex of Nigeria. Precambrian Geology of Nigeria. A Publication of Geological Survey of Nigeria pp. 11-41. |
|
|
Samsudin AR, Rahi BEA, Yaacob WZW, Hamzah U (2006). Mapping of contamination plumes at municipal solid waste disposal sites using geoelectric imaging technique: Case studies in Malaysia. Journal of Spatial Hydrology 6(2):13-22. |
|
|
Ward SH (1990). Resistivity and Induced Polarisation Methods in Geotechnical and Environmental Geophysics. Society of Exploration Geophysicists, Tulsa pp. 147-189. |
|
|
Zume JT, Tarhule A, Christenson S (2006). Subsurface Imaging of an Abandoned Solid Waste Landfill Site in Norman, Oklahoma. Groundwater Monitoring and Remediation 26(2):62-69. |
|
Copyright © 2024 Author(s) retain the copyright of this article.
This article is published under the terms of the Creative Commons Attribution License 4.0


