Full Length Research Paper

ABSTRACT
Detailed field geology and laboratory studies of the Eocene Nanka Formation were carried out where they outcropped in places like Ogbunike, Umunya, Nanka, Ekwulobia and Ogbu all in Anambra State, South-eastern Nigeria to determine their mineralogical composition. Samples of clay and unconsolidated sands were collected from outcrop locations within the formation and subjected to X-ray diffraction and granulometric analyses respectively. The results of the X-Ray diffraction analysis (XRD) analysis indicated the presence of Quartz, Muscovite, Kaolinite and Hematite. Quartz ranges from 30.1 to 99.7% with an average of 53.68%, while Muscovite ranges between 62.6 and 69.6% with an average of 66.1%. Kaolinite and Hematite averages were 72.05 and 7.6%, respectively. The results of the granulometric analysis of sand samples revealed that the mean size value ranges from 2.33 to 3.295 which are indicative of fine to medium-grained to coarse-grained sandstone. Sorting ranged from 1.251 to 1.817 mm, showing that the sands were poorly to well sorted, while skewness and kurtosis range from 0.005 to 0.826 and 1.365 to 2.15, indicating symmetrical to very fine skewed and leptokurtic to very leptokurtic respectively. The sands and some clay minerals are abundant in the study area and they are good industrial minerals.
Key words: Clay, sandstone, X-ray diffraction analysis (XRD), granulometric analysis, industrial minerals.
INTRODUCTION
Nanka formation has a lot of economic minerals that when properly harnessed can increase the economy of the zone and the nation at large. The formation has minerals like Quartz (silica sand), Muscovite, Kaolinite, Hematite, consolidated sands among others. The mineralogical and geochemical properties of sand and clay deposits in formation have been studied by several authors (Alege et al., 2015; Onyekuru et al., 2018; Etimita and Beka, 2020).
Quartz (silica sand) is an invaluable raw material for a host of industrial applications including but not limited to paint making, glass manufacture, foundry sand, solar panel production, proppant in the oil and gas industry, and for horticultural and other agricultural applications (Sundararajan et al., 2009). Large amounts of quartz sand also known as silica sand are used in the manufacture of glass and ceramics and for foundry moulds in metal casting. Pure kaolin is used in the manufacture of fine porcelain; impure varieties are used in making pottery, stoneware, and bricks; as filler for pigments; and in the manufacture of paper. Kaolin is used extensively in a number of industries such as paper, plastics, adhesives, rubber, paint, refractories, cement, bricks and ceramics. Kaolin is used in the paper industry as both filler due to its lower price than pulp, and as coater due to the increasing demand for color printing which requires coated papers and shapes foundary sand, fiber glass, electrical porcelain, fertilizers, crockery and other earth wares, china and dinnerware, cement and Portland, catalyst (oil and gas refining), and animal feeds.
The majority of clay deposits are composed of a mixture of more than one clay mineral together with minerals. Such clays are generally not sold in the raw state, but are commonly used in the manufacture of cement and structural or face bricks. The bulk kaolin production is consumed in these two uses. Portland cement is manufactured by combining a mixture of raw materials that include large tonnages of clay or other argillaceous deposits, e.g., shale. They provide a source of alumina, silica, and iron oxides which, together with a calcareous raw material (such as limestone), form the calcium silicates and aluminates present in the cement clinker. The composition of the raw mix has to be adjusted within narrow limits with respect to content of oxides of calcium, silicon, aluminum and iron. Muscovite has been used for many electrical and insulating purposes due to its resistance to heat and electrical transference. Most notably, however, it was used for furnace and microwave windows before glass became readily available. Ground mica is used as a pigment extender in paint. It helps keep pigment in suspension; reduces chalking, shrinking, and shearing of the finished surface; reduces water penetration and weathering, and brightens the tone of colored pigments. In some automotive paints, tiny flakes of mica are used to produce a pearlescent luster. The aim of this study is to evaluate the economic minerals present in clay and sandstone Units of Nanka Formation, and also to determine the relative abundance of minerals in the clay samples and their uses.
Location and geology of the study area
The study area lies between latitudes 6°0’0’’ N and 6°12’0’’ N and longitudes 6°51’0’’ E and 7° 7’ 0’’ E with an area extent of approximately 657.12 km2. There are thirteen geologic locations that fall within the study area and they are highly accessible. The area is underlain by four geological formations; the Paleocene Imo Shale, the Eocene Nanka sand, Oligocene-Miocene Ogwashi Asaba, and Oligocene Benin formations (Figure 1).
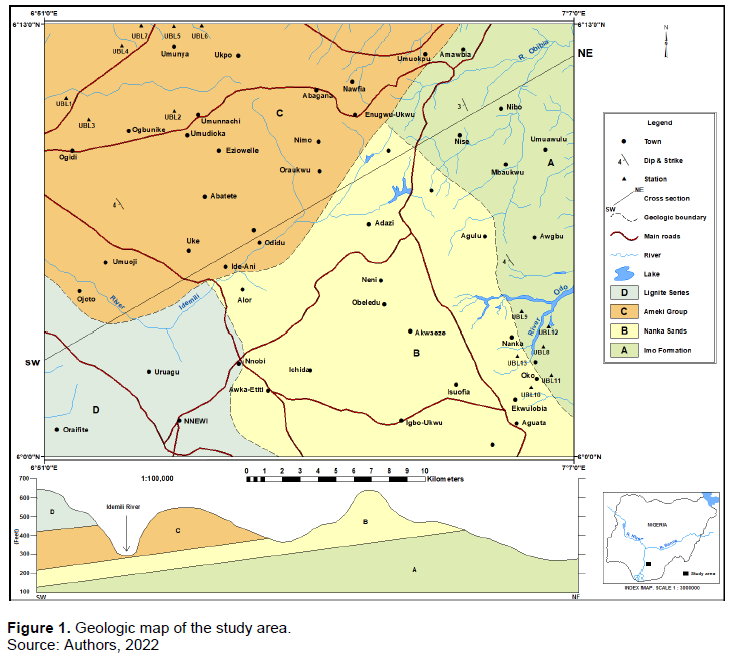
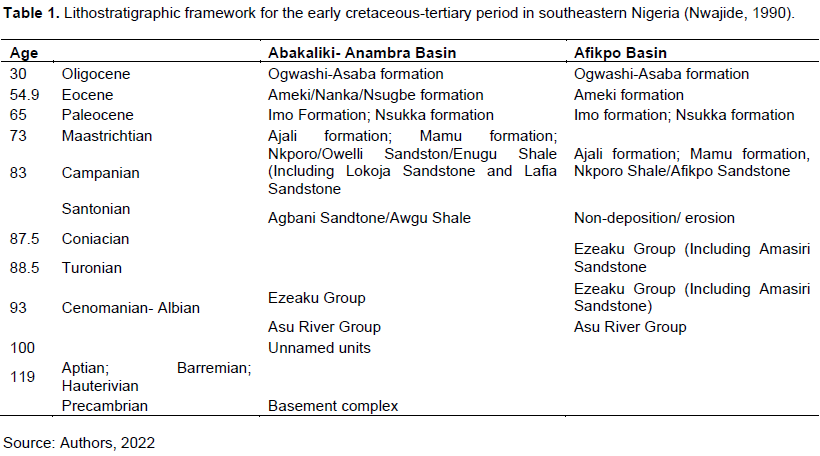
The four formations are characteristically composed of sands inter-bedded with thin layers of mudrocks, clays and ironstones (Nwajide, 2013). Studies have shown that the formations are generally extensive in southern Nigeria and inherently weak and collapsible (Agagu et al, 1985; Obiadi et al., 2014; Chikwelu and Ogbuagu, 2014; Egbueri et al., 2017). Despite their age differences, all the soils underlying the study area are predominantly composed of loose and poorly consolidated fine-grained sand materials with low clay content and little or no coarse-grained aggregates (Egbueri et al., 2017; Anyanwu et al., 2021). These units are interbedded by shale-siltstone and fine sand layers (25 cm thick) in a few of the gully sites. The angle of dip ranges from 4° to 6° in the western direction. The Nanka sand is underlain by the thick Imo Formation of Paleocene age (Table 1), and overlain by the Oligocene of Ogwashi-Asaba Formation (Reyment 1965; Adeleye and Fayose 1978).
Towards the north-west part of the study area, the Nanka sand is overlain by the Nsugbe formation of oligocene age and underlain by the Ameki formation of the eocene age towards the southeastern part of the study area (Reyment, 1965; Adeleye and Fayose, 1978).
MATERIALS AND METHODS
The desk study of the study area was carried, followed by detailed field mapping and laboratory analysis of the clays and sandstones.
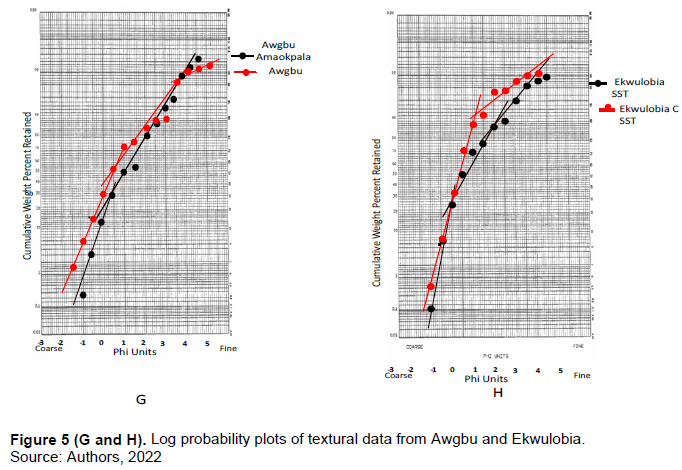
Outcrop sections well exposed like quarries, roads, and streams were mapped, logged, and sampled. Twenty five representative samples of unconsolidated sands and five clay samples were collected from outcrop locations within the formation. The unconsolidated sand samples were subjected to granulometric analyses using the standard ASTM half-phi sieve shaker to determine mean grain size distributions, sorting, skewness, and kurtosis while the clay samples were subjected to X-ray diffraction (XRD) to determine the clay minerals present and other silicate compositions while Lithologic units were determined based on attributes such as textural features (bedding type, texture, grain-size and shape, fossils, and primary sedimentary structures). Graphical plots of cumulative retained sieve weight percentage against the phi scale were made on an arithmetic-log probability sheet using the method according to univariate statistical parameters (skewness, sorting, mean size, kurtosis). Bivariate plots from the granulometric analysis were used to obtain a certain range of values which may indicate a distinct depositional environment out of a range of adjacent environments in the area.
Sieve analysis
The sandstone samples obtained from the different sections of outcrop were used to carry out sieve analysis. The samples were dried, disaggregated using a mortar and a rubber padded pestle after which 100 g of each was weighed. A set of half-phi ASTM standard sieves put on a Ro-Tap automatic sieve shaker was used for the analyses. After shaking for 20 min the retained samples at the different intervals were collected. Plots of the weights retained against the sieve pore sizes (phi scale) was drawn and used for other calculations and interpretations.
From these curves the following textural parameters were obtained:
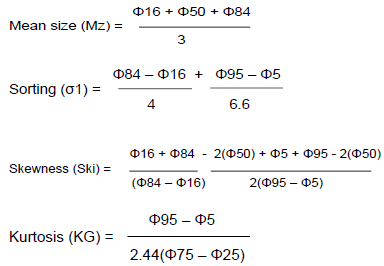
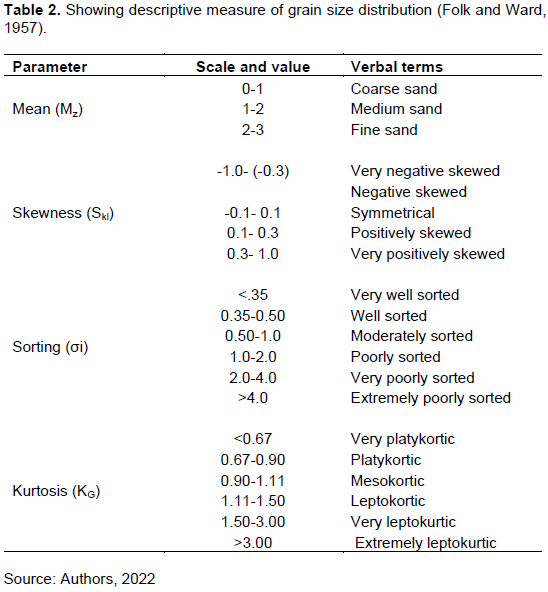
Cumulative frequency plots of the data were made on an arithmetic log probability paper following the method of Visher (1969). From the plots, the critical percentile phi values (φ5, φ16, φ25, φ50, φ75, φ84, φ95) were obtained and used to compute the univariate statistical parameters as defined by Folk and Ward (1957) namely: Mean Size (Mz), Sorting (σi), Skewness (Ski) and Kurtosis (KG) (Table 2).
Clay mineral analyses using the X-ray Mini diffractometer md-10
Fresh unbroken clay samples were oven-dried in order to remove moisture contents. About 10 g of each sample are then pulverized to powder size for primping after which 3 g was collected and put in a culvet (a hard circular plastic of about 2 cm diameter, used for placing the powdered sample in the machine). Afterwards, this set-up is transferred to the XRD machine where it is fitted to the sample holder and exposed to X-ray radiation while it rotates around its central axis. The rotation ensures adequate exposure of every grain to the radiation. Each sample (in the culvet) is exposed for 1200 s after which the software of the diffractograph generates a graph of intensity (pulses) of the radiation against 2θ° - diffractogram. Twenty degrees is the angle that a particle grain makes with the incoming x-ray radiation. The diffractogram is further modified with different software in order to generate graphs with same co-ordinates but sharper peaks displayed in different colours. Each colour corresponds to the different minerals contained in the rock sample.
Matching the generated coloured peaks with already installed minerals within its software does the mineral identification. The equipment makes use of the basic elements within the mineral framework in identifying the minerals present. Recorded mineral groups include the silicates, carbonates and a few sulphates. The exposure time and radiation are 1200/1200 s and CuKa, respectively, for all samples. The diffractometer generated a table with the following parameters: 2θ° = angle of diffraction; d = interplanar spacing; Iint = interval intensity; Imax = maximum intensity; Irel = relative intensity; Icorr = corrected intensity; FWHM = full width half measure.
RESULTS AND DISCUSSION
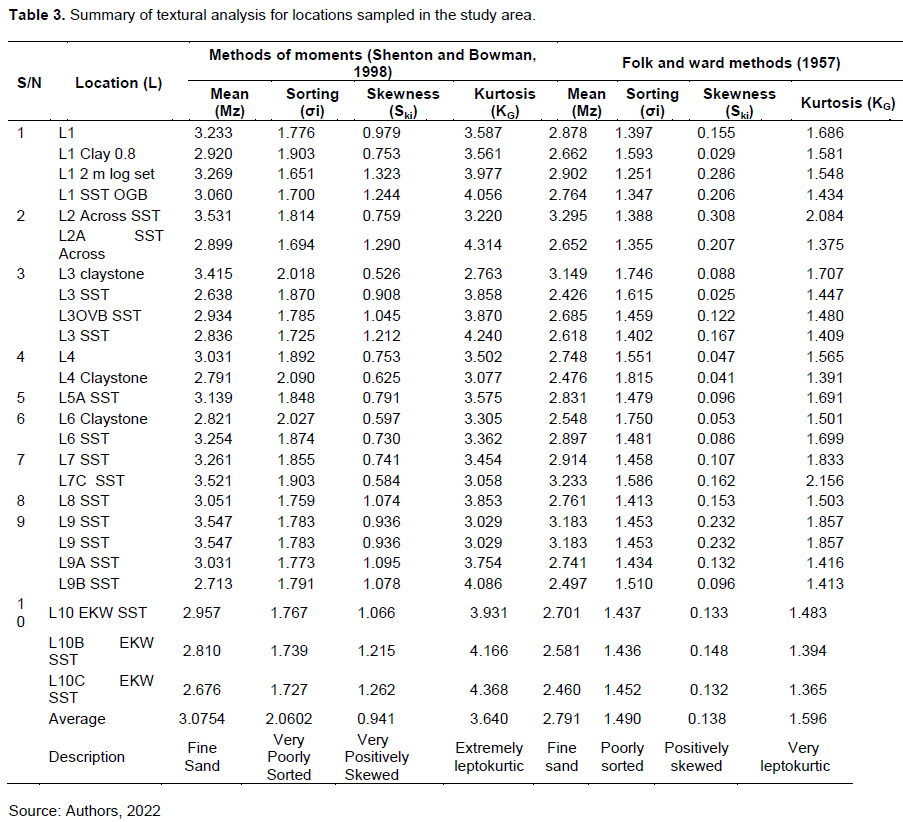
The granulometric analysis of sandstone samples reveals that the mean size value is indicative of fine to medium-grained to coarse-grained sandstone and suggestive of intermediate to high energy setting. The analysis shows that the mean of sandstone samples analyzed ranges from 2.330 to 3.295 and shows that the sand is fine- very fine grain, sorting ranges from 1.251 to 1.817 indicating that the sands are well sorted to poorly sorted, skewness ranges from 0.005 to 0.826 which shows that the sands are symmetrical to very fine skewed. Kurtosis ranges from 1.365 to 2.156 and shows it is leptokurtic to very leptokurtic. The dominant positive (fine) skewness of the sandstone indicates that the energy was low for most of the time, whereas the kurtosis indicates that the sandstone is essentially very platykurtic, relating to poor sorting. The mean size result shows that the samples are medium to coarse-grained, which suggests intermediate to high energy setting while the standard deviation indicates that the sandstones are moderately sorted to poorly sorted.
The positive to very positively skew of some samples indicate that the energy was low for most of the time. Also, the kurtosis of these samples which is very platykurtic shows that they are moderately to poorly sorted. The mean size show that the samples are medium to coarse-grained, indicative of intermediate to high energy depositional setting while the standard deviation shows that the sandstone is poorly sorted, which is a pointer to variable energy setting. Table 3 show the summary of textural analysis in the study area.
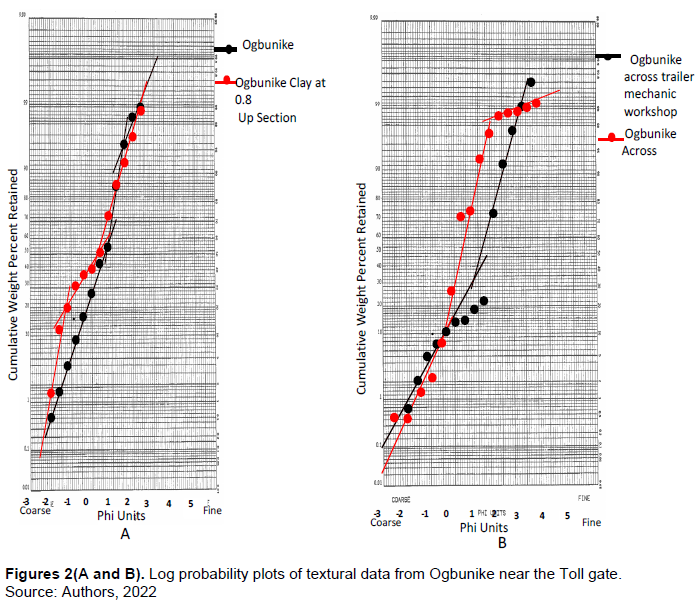
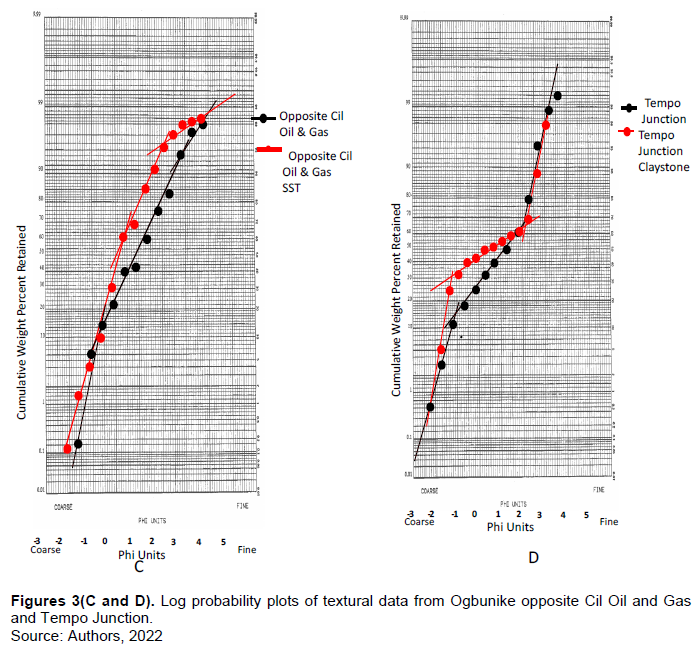
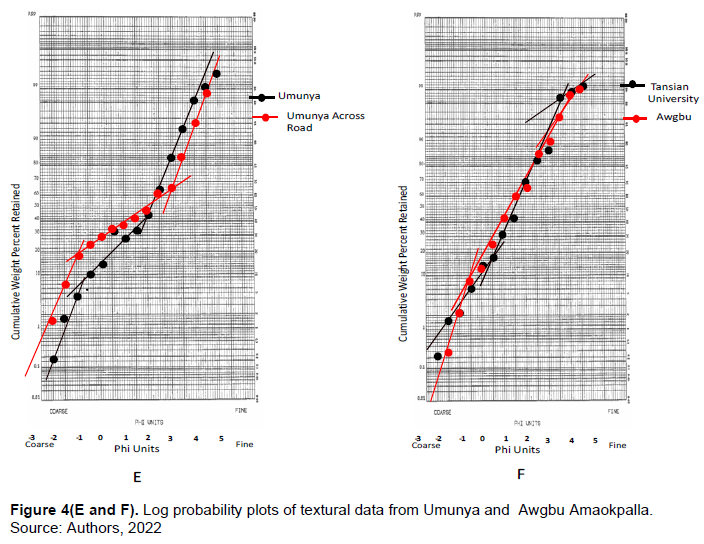
The log-probability plots of the different samples were produced as shown in Figures 2 to 5. The log-probability plots show a two-segment plot, deposited by traction, saltation, and suspension processes, which is suggestive of a shallow marine environment.
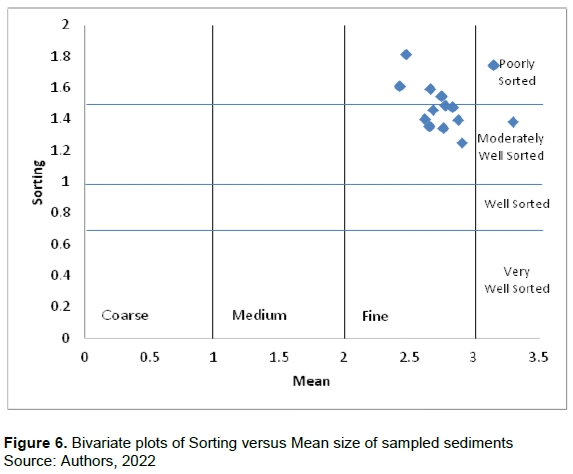
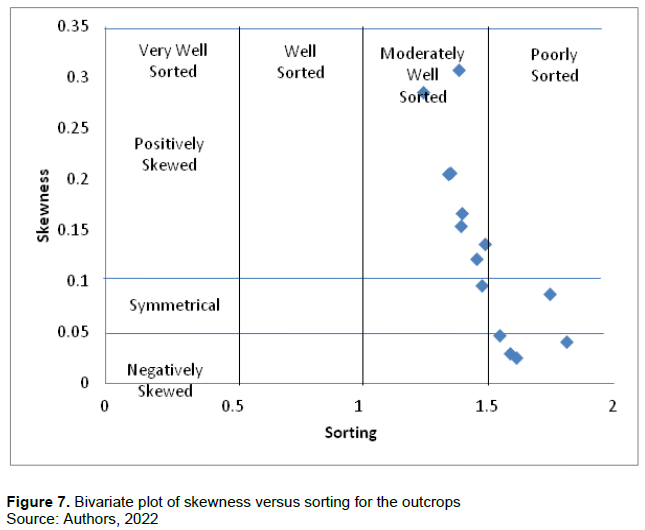
Figures 6 and 7 shows the bivariate plots of sorting vresus mean size and skewness versus sorting respectively in the sampled sediments. The figures show that the sediments are moderately to poorly sorted and the mean size is the fine sand class. Generally, most beach sediments are slightly negatively skewed due to the presence of small proportion of coarse grains (Visher, 1969). Friedman (1961) reveals that most beach sands are leptokurtic and either positively or negatively skewed or very leptokurtic deposits and have high sorting which is a reflection of the ability of the current to winnow sediment. High energy current is able to differentiate grains into their sizes, whereas, low energy is unable leading to poor sorting.
The results of the XRD analysis are shown in Table 4 and Figures 8 to 10. The table shows the relative abundance of Quartz, Muscovite, Kaolinite and Hematite in the study area. Quartz ranges from 30.1 to 99.7% with an average of 53.68%. Muscovite was observed in Ogbunike and Umunya with relative abundance of 62.6 and 69.6% respectively with an average of 66.1%. Kaolinite was observed at Ogbunike and Umunya with relative abundance of 44.5 and 99.6% with an average of 72.0% while Hematite occurred at Obgunike with relative abundance of 7.6.
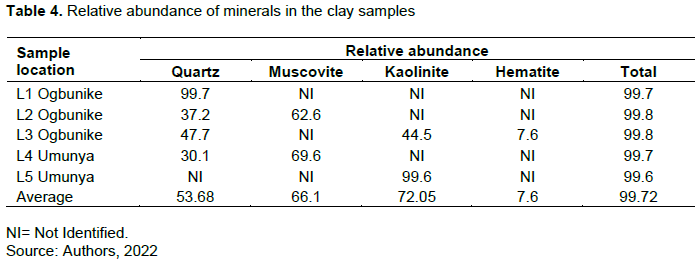
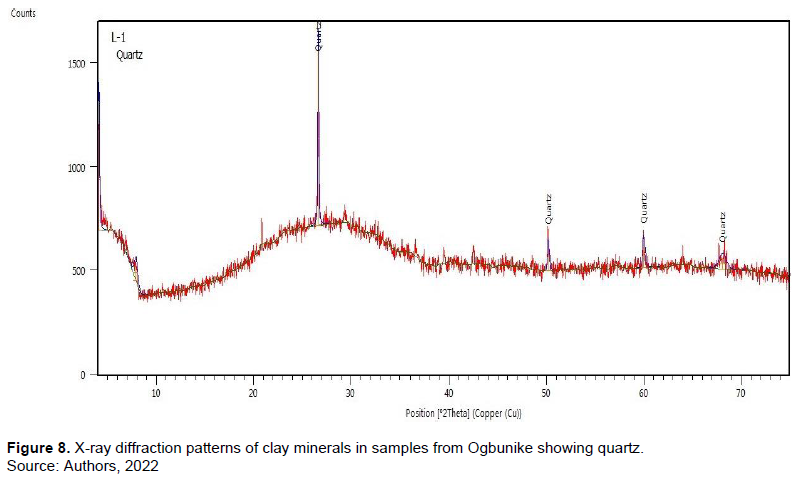
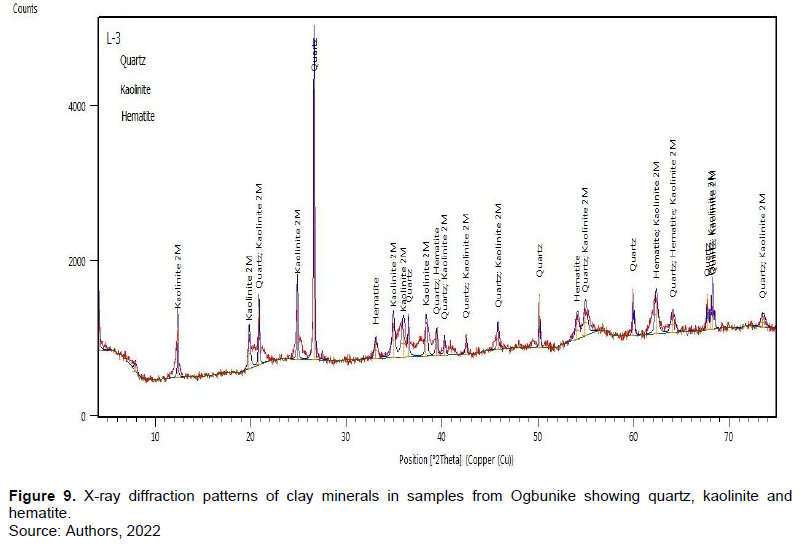
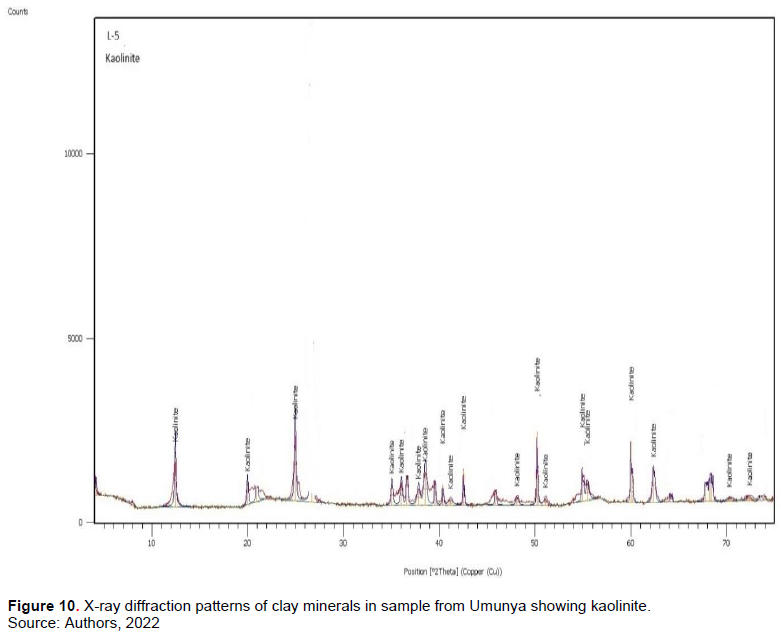
The diffraction patterns (Figures 8 to 10) also show that Quartz, Muscovite, Kaolinite and Hematite constitute the principal clay minerals. Quartz, Kaolinite and Hematite were identified in the diffractogram of the samples collected at Ogbunike (Figures 8 and 9), while Kaolinite is the major clay mineral in the sample collected at Umunya (Figure 10).
CONCLUSION
Detailed field geologic mapping of various rock Units encountered at some parts of Nanka formation and integrated with granulometric and clay XRD analyses have provided useful data on the economic minerals present in clay and the quality of sand in the study area. The X-ray diffraction (XRD) showed the clay minerals present and other silicate compositions. The XRD analysis indicated the presence of Quartz, Muscovite, Kaolinite and Hematite with different ratios of their relative abundance in the area. The granulometric analysis of sandstone samples revealed that the mean size value is indicative of fine to medium-grained to coarse-grained sandstone and suggestive of intermediate to high energy setting. The clay minerals, the Quartz, Muscovite, Hematite and Kaolinite are relatively in abundance in some locations in the study area and are good industrial minerals while the sands can be used for construction purposes since they contain less impurity.
CONFLICT OF INTERESTS
The authors have not declared any conflict of interests.
REFERENCES
|
Adeleye DR, Fayose EA (1978). Stratigaphy of the Type Section of Awi Formation Odukpani Area, Southeastern Nigeria. Nigerian Journal of Mining and Geology 15:33-37. |
|
|
Agagu OK, Fayose EA, Petters SW (1985). Stratigraphy and Sedimentation in the Senonian Anambra Basin of Eastern Nigeria. Journal of Mining and Geology 22:25-36. |
|
|
Alege EK, Alege TS, Barnabas GY, Idakwo SO (2015). Compositional Characteristics and Industrial Assessment of the Cretaceous Clay Deposits within Northern Anambra Basin, Nigeria. Journal of Environment and Earth Science 5(6):11-19 |
|
|
Anyanwu IE, Okeugo CG, Orji IK (2021). Granulometric and Pebble Morphometric Analyses of Rock Units Within the Uzuakoli-Ahaba Axis and Environs: An Outcome of Geological Mapping and Outcrop Studies. Petroleum and Coal 63(3):718-735 |
|
|
Chikwelu EE, Ogbuagu FU (2014). Geotechnical Investigation of Soil around Mbaukwu Gully Erosion Sites, South-Eastern Part of Nigeria. IOSR Journal of Applied Geology and Geophysics 2(4):6-17 |
|
|
Egbueri JC, Igwe O, Nnamani CH (2017). Assessment of the engineering properties and suitability of some tropical soils as backfill materials. International Journal of Trends in Scientific Research and Development 2(1):590-605. |
|
|
Etimita OO, Beka FT (2020). Heavy mineral analysis of Eocene sands and sandstones of Nanka Formation,Cenozoic Niger Delta petroleum province. Geology, Ecology, and Landscapes 4(4):251-256 |
|
|
Folk RL, Ward WC. (1957). A study in the significance of grain size parameters. Journal of Sedimentary Petrology 27(1):3-26. |
|
|
Friedman GM (1961). Distinction between dune, beach, and river sands from their textural characteristics. Journal of Sedimentary Research 31(4):514-529. |
|
|
Nwajide CS (1990). Cretaceous Sedimentation and Paleogeography of the Central Benue Trough: In Ofoegbu CO (Ed), The Bebue Trough: Structure and Evolution. International Monograph Series, Braunschweig pp. 19-38 |
|
|
Nwajide CS (2013). Geology of Nigeria's Sedimentary Basins. Lagos Nigeria: CSS Bookshops Limited. |
|
|
Obiadi II, Nwosu CM, Ajaegwu NE, Anakwuba EK, Onuigbo NE, Akpunonu EO, Ezim OE (2014). Gully Erosion in Anambra State, South East Nigeria: Issues and solution. International Journal of Environmental Sciences 2 (2):796-804 |
|
|
Onyekuru SO, Iwuoha PO, Iwuagwu CJ, Nwozor KK, Opara KD (2018). Mineralogical and geochemical properties of clay deposits in parts of Southeastern Nigeria. International Journal of Physical Sciences 13(14):217-229. |
|
|
Reyment RA (1965). Aspects of the Geology of Nigeria. Ibadan University Press P 133. |
|
|
Shenton LR, Bowman KO (1998). The Development of Techniques for Evaluation of Sampling Moments. International Statistical Review 43(3):317-334. |
|
|
Sundararajan M, Ramaswany S, Raghavan P (2009). Evaluation for the Beneficiability of white Silica Sand from the Overburden of Lignite Mine Situated in Rajpardi District of Gujarat, Indian. Journal of Minerals and Materials Characterization and Engineering 8:701-713. |
|
|
Visher GS (1969) Grain-Size Distribution and Depositional Processes. Journal of Sedimentary Petrology 39:1074-1106. |
|
Copyright © 2024 Author(s) retain the copyright of this article.
This article is published under the terms of the Creative Commons Attribution License 4.0


