Full Length Research Paper

ABSTRACT
Magnetic susceptibility and mechanical properties of rocks in a typical basement complex Southwestern Nigeria were correlated with the aim of establishing empirical equations relating the two parameters and evaluate the parameters as related to its competency in hosting civil structures. A total of thirty rock samples were taken across the geology of the area and subjected to mechanical properties determinations. Magnetic susceptibility measurements were carried out on in-situ fresh rock outcrops and it ranges from 2.1 × 10⁻⁴ to 9.5 × 10⁻⁴. This signifies the amount of iron content in the rocks and its level of induration. The values of uniaxial compressive strength (UCS), Young’s modulus (E), shear modulus (µ), bulk modulus (K) and Poisson’s ratio (Ñ´) ranges from 49 - 107 MPa, 1003 - 3321 MPa, 416 - 1310 MPa, 707 - 2728 MPa and 0.232 - 0.316, respectively. The cross plots of the mechanical parameters with the magnetic susceptibility exhibit a direct linear relationship. The relationship shows a good correlation with coefficient of correlation (R) ranging from 0.60 to 0.85 for uniaxial compressive strength, bulk modulus and Poisson’s ratio. The magnetic susceptibility relationship with shear and Young’s Modulus are relatively weak with coeffecient of correlation (R) of 0.44 and 0.47, respectively. This implies that, magnetic susceptibility measurement may not be reliably applicable in determination of the stiffness of rocks and the rate of resistance of rocks to prevailing shearing loads. The validation results show that, reliable mechanical properties of rocks can be estimated from magnetic susceptibility measurements using the established empirical equations.
Key words: Magnetic, susceptibility, mechanical, properties, rocks.
INTRODUCTION
The mechanical strength of the subsurface bedrocks as foundation rock for any civil engineering structure requires having adequate knowledge of the mechanical properties of the rock before any structural design can be made. Rocks normally deform in response to an applied load, changes in temperature or water content and growth of secondary minerals such as Zeolite, Chromite and Calcite filling cracks and pores. This poses negative effect on the overall strength of rock (Morrow et al., 2001). The durability and stability of civil structures depend on the mechanical strength of the underlying rock/subsoil. Building collapse incidences are common in Southwestern Nigeria; despite the development of proactive, non-destructive, time saving, low cost and effective engineering idea of applying geophysical methods in delineating subsurface condition. 52% of the building collapse recorded in Nigeria is as a result of design error (Oke, 2011). This may be due to the mechanical strength of bedrocks hosting the foundation of the building. Foundation is one of the structural members of any building and any problem arising from it, will surely affect the whole building (Fadamiro, 2002). The mechanical strength of bedrocks is a function of its thickness.
This implies that bedrock can withstand more load based on its thickness even with moderately mechanical strength. Bedrock ridges and depressions are inimical to stability of foundations of civil engineering structures (Adelusi et al., 2013). The pore size can be a microstructural parameter that has strong influence on the uniaxial compressive strength of a rock that contains equal pores (Patrick et al., 2014). Structural design and quality management which depend on the condition of the underlying bedrock are the two major factors normally considered when examining causes of building collapse (Olusola, 2002). Rock mechanics properties can be characterized using correlated laboratory test and numerical interpretations of well logs (Hao et al., 2016). Good empirical relationship has been established between geophysical property; ultra-sound velocity (Vp)) and mechanical properties for evaluation of rock brittleness (B) (Chary et al., 2006). Also, good relationships were established between velocity and porosity as physical properties and rock strength which includes unconfined compressive strength and internal friction angles of sedimentary rocks (Chandong et al., 2006).
The conventional way of determining the mechanical properties of the parent rocks which weathered into subsoil is time consuming and very costly. These challenges call for the need to establish methods which are less time consuming and cost effective (Bayode et al., 2009). This has therefore necessitated this research work. This study aims at evaluating foundation competency conditions of typical Basement rocks by comparing their magnetic susceptibility and mechanical properties with a view of establishing empirical relationships relating them. This will help to determine the mechanical suitability of basement rocks as foundation bedrock for civil engineering developments by using geophysical approach.
Study area
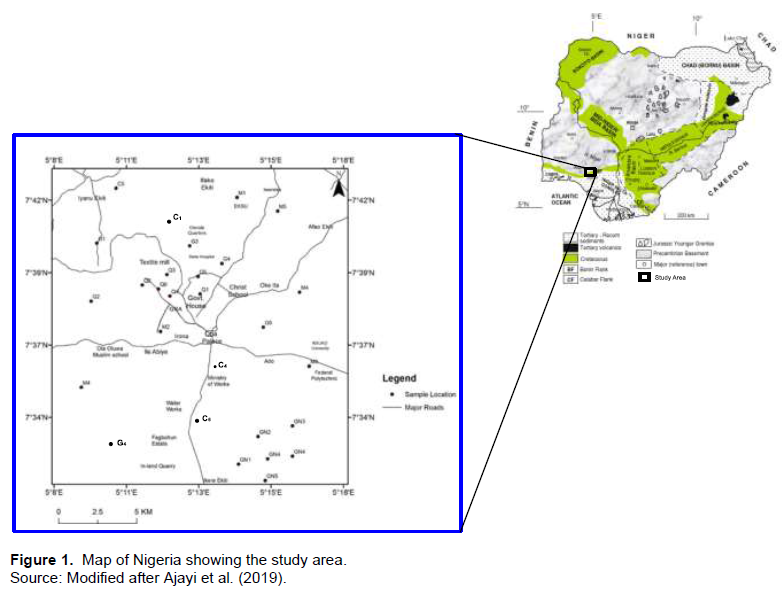
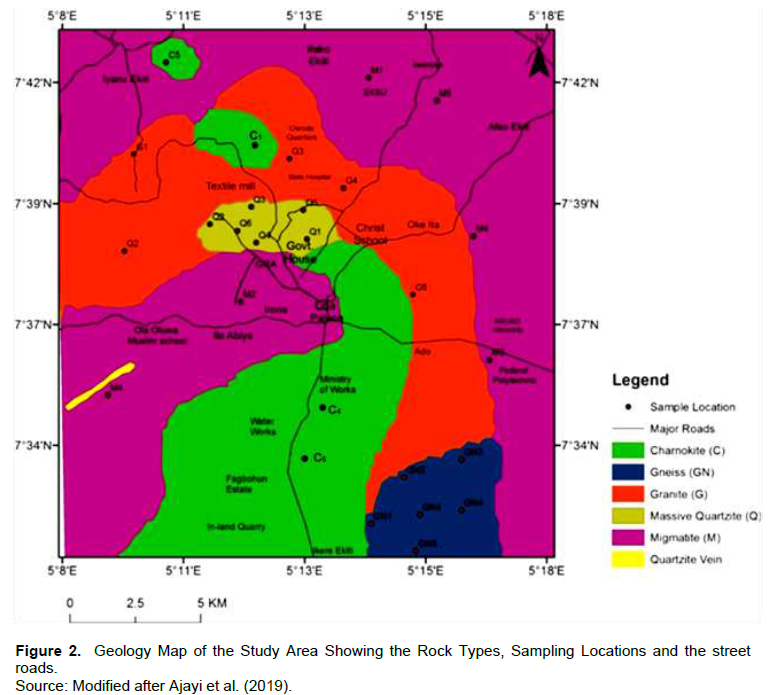
Ado-Ekiti, Southwestern Nigeria covers a total area of 346.5 km2. It is dominated by crystalline rocks (Figures 1 and 2), which consist mainly of migmatite-gneiss-quartzite complex, older granites, quartzite, charnockites, and fine to medium grained granites (Ayodele and Ajayi, 2016). In the area, there is a close association between the charnockites and granitic rocks due to their field relationship as documented in the Basement Complex Rocks of Nigeria (Rahaman, 1979). A plutonic complex containing both charnockitic and non-charnockitic granite rocks occurs within the amphibolite facie rocks of gneisses and migmatites in Ado Ekiti (Olarewaju, 1987).
METHODOLOGY
Magnetic susceptibility measurement
Magnetic susceptibility meter, which measures the amount of iron-bearing minerals in rock, was used as a geophysical tool for the study. It determines the “magnetisability” of rocks in their natural environments (Frantisek et al., 2009). It detects how convenient a rock can retain magnetic property after been exposed to an external magnetic field (Tarlingar and Hrouda, 1993). The relationship between the magnetic field strength, flux density and permeability of rocks is given by:
B = μH (Expressed in Tesla or flux per unit area) (1)
B is magnetic flux density, H is field strength
μ is absolute permeability of the medium.
In a vacuum, it is given by;
 (Expressed in Henry per meter) (2)
Unit of flux density B is Tesla (T), commonly used unit is nano Tesla due to lesser size of anomalies (1nT = 10-9T). Relative permeability, susceptibility and magnetization can also be related in a medium other than vacuum; the absolute permeability is given by;
 (Expressed in Henry per meter) (3)
From Equation 1, B = μH
Therefore,
B = μrμ0H (Expressed in Tesla or flux per unit area) (4)
Where, μ0 is absolute permeability of vacuum
B = μrμ0H = μ0H + μ0(μr-1)H (Expressed in Tesla) (5)
B = μ0 H + μ0 κ H, (Expressed in Tesla) (6)
where κ = μr-1;
Therefore,
μr = 1 + κ (Expressed in Henry per meter) (7)
Where μr is the relative permeability of the medium and κ is the magnetic susceptibility (Telford et al., 1990).
Rock magnetic susceptibility was measured using the Mag-Rock Magnetic Susceptibility Meter. The positions of the sampling points surface were cleaned with methylated spirit before taking each measurement. A total of three hundred (300) measurements (ten readings per location) were taken at the thirty (30) sampling locations which were distributed across the study area.
Determination of mechanical properties of rocks
Sample collection and preparation
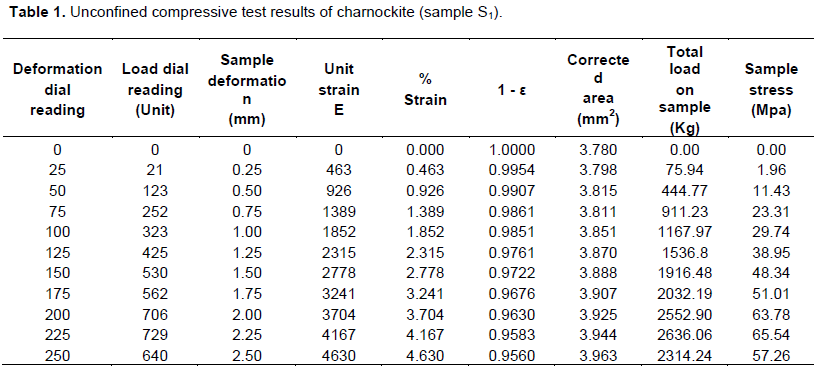
Fresh samples of rocks using ISMR standard were collected from outcrop within the study area (Figure 1). A total of thirty rock samples of cubic shape of 2 by 1.5 by 6 cm (Figure 2) were collected. The actual dimension of each of the prepared rock samples was determined and recorded. Each of the prepared samples was mounted on the Uniaxial Compression testing machine. The dial gauge and the load gauge of the machine were standardized to zero reading. The dial gauge measures the strain on the sample, while the load gauge measures the stress on the rock sample. The coarse adjustment load roller is then turned until the rock breaks. The plunger was made to touch the surface of the specimen, and the load and penetration measuring dial was set to zero. The plunger was made to penetrate the prepared rock sample at constant rate of 1 mm per min. The deformation readings were taken at every 25 deformation dial reading until the compacted rock specimen breaks or deforms. The normal stress was plotted against the axial strain. The peak of the resulted curve was taken as the Uniaxial Compressive Strength (MPa). The Young’s Modulus was determined from the gradient of the stress-strain normal relationships before deformation took place (Table 1). From the uniaxial compression test curve, Mohr circle was generated from the normal stress and strain data. The shear modulus was determined from the shear stress-strain curve on the Mohr-circle.
Mavko et al. (2003) relate the young’s modulus (E), shear modulus (µ) and the bulk modulus (k) as stated in Equation 8:
 (Expressed in MPa) (8)
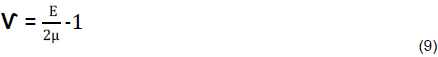
Poisson’s Ratio (Ñ´) was obtained by applying Mavko et al. (2003)’s formula that relates it with the Young’s Modulus (E) and the Shear Modulus (µ) as stated below.
Correlation of geophysical and mechanical properties of the rocks
The regression plots of the magnetic susceptibility values as geophysical parameters against each of the determined mechanical parameters can be represented by an empirical equation of the form;
Y = MX + C (10)
‘Y’ represents the mechanical parameters, ‘X’ represent the geophysical parameters, ‘M’ represent the gradient of the trend line, and ‘C’ is the intercept on the mechanical parameter (vertical) axis. From the plot, the relationship between the mechanical parameter and the geophysical parameters is best described by linear relationships, where the mechanical parameter is taken as the dependent variable.
RESULTS AND DISCUSSION
Magnetic susceptibility
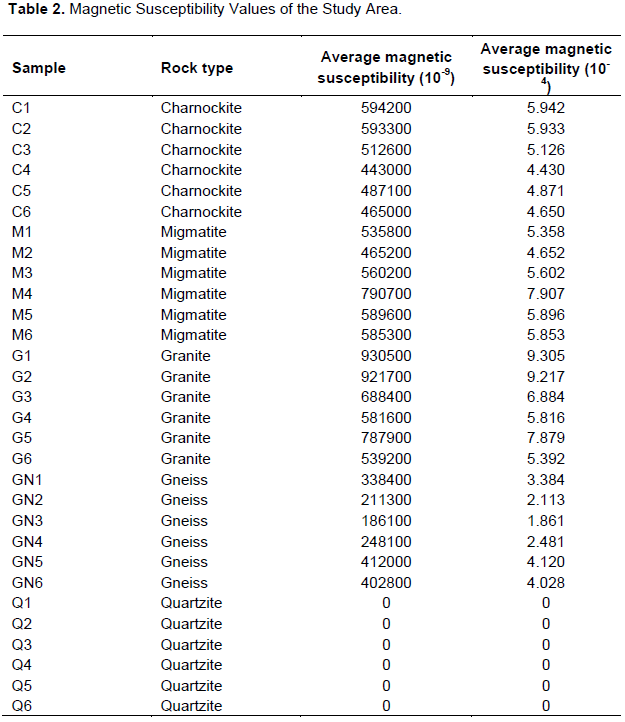
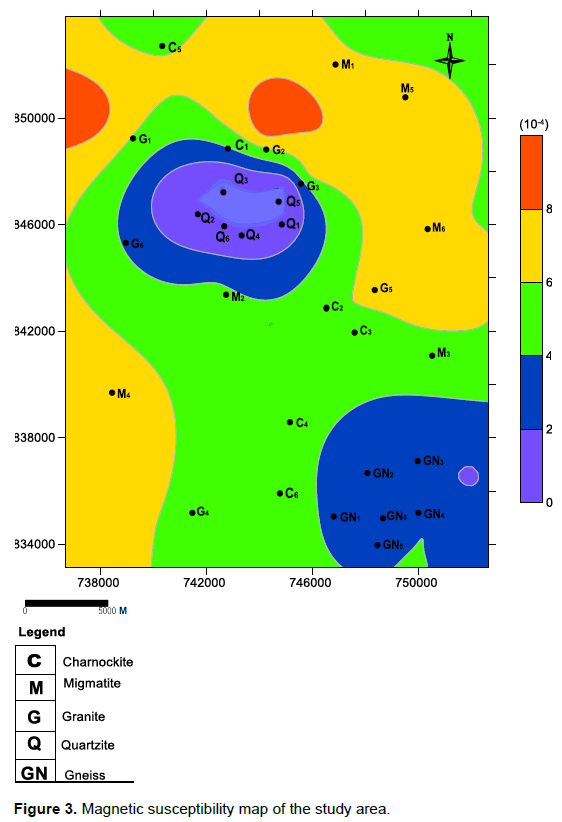
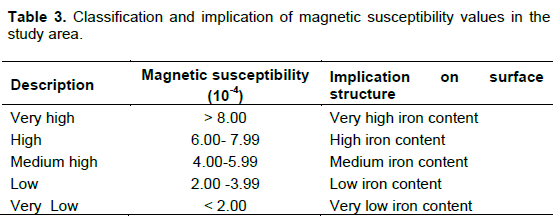
The magnetic susceptibility values are presented in Table 2 and the magnetic susceptibility map is as shown in Figure 3. Table 3 indicated the classification and implications of the magnetic susceptibility judging from possible amount of the iron content within each of the rock sample. The value ranges from 0- 9.5. Relatively low values (0 - 4 × 10⁻⁴) were observed at the north-central and south-eastern parts of the study area dominated by quartzite and gneisses. The north-western, northern and north-eastern parts dominated by migmatitic rocks are characterized by relatively high susceptibility values (6 × 10⁻⁴ – 9.5 ×10⁻⁴).
Mechanical properties
Uniaxial compressive strength (UCS)
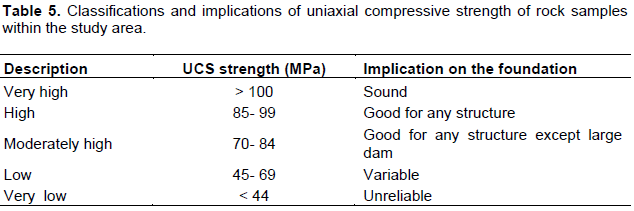
The results of the mechanical properties in the study area are presented in Table 4. Figure 4a indicates UCS values of 40 to 70 MPa within North-central/South-eastern parts of the study area. These zones are dominated by charnockitic rocks. The north-eastern and the north-western parts of the study area show relatively high values (85 - 115 MPa).
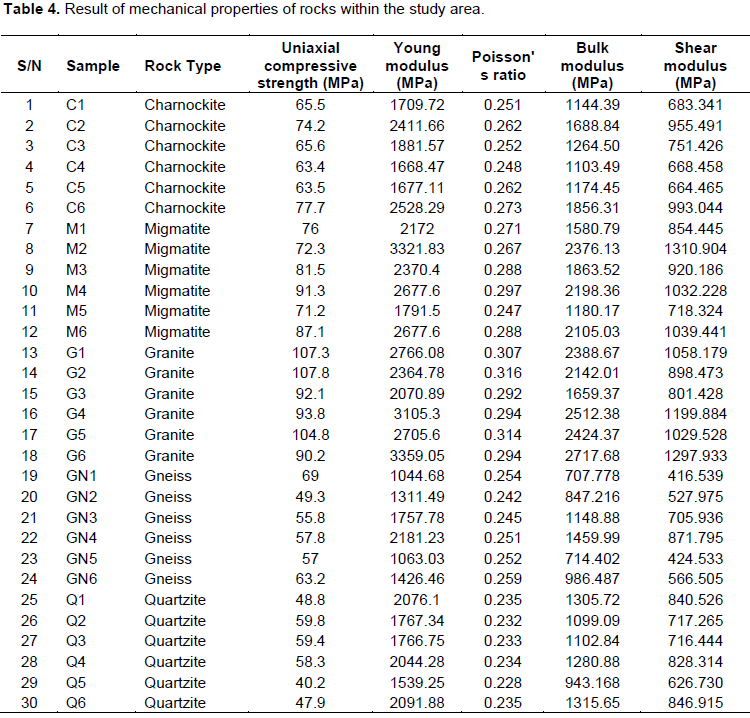
The areas were underlain by granitic and migmatite rocks (Figure 2). The study reveals that migmatite and Granite are better foundation materials than other rock unit within the study area (Table 5). This suggests that rocks with high magnetic affinity will possess higher resistance to uniaxial compressive strenght.
Young’s modulus
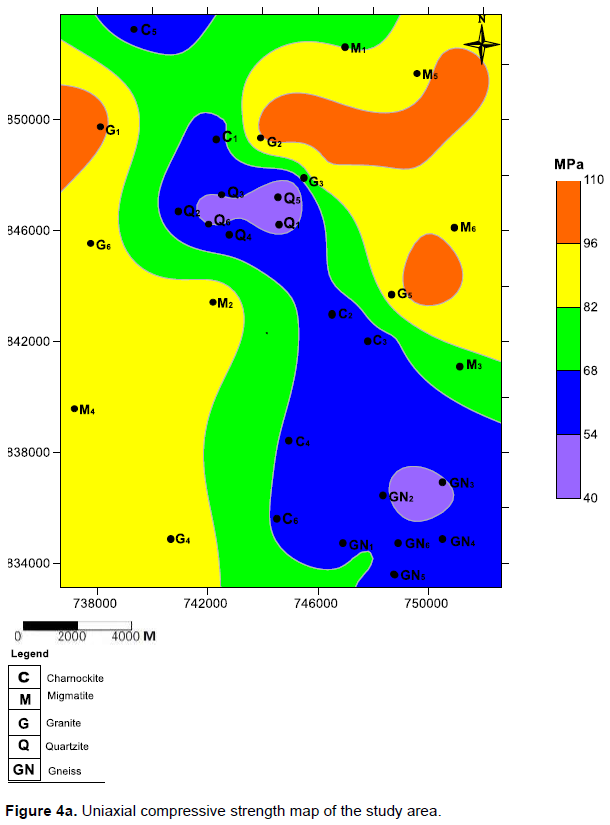
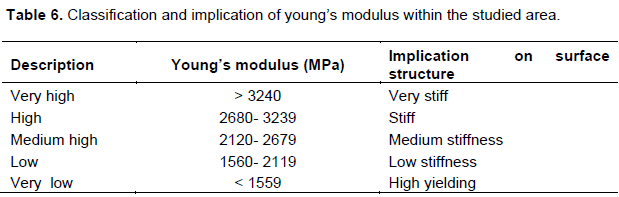
Young modulus is an indication of the stiffness of the rock when subjected to prevailing load. Figure 4b shows the Young’s modulus ranges from 1000-3400 MPa within the study area. Relatively low values (1000-21300 MPa) were observed around the south-eastern and north western parts dominated by gneiss and charnockite rocks. Relatively high values (2900 - 3400 MPa) are indicated within the western and southwestern parts mostly composed of migmatite rocks, while the medium values (1090 - 2450 MPa) are observed within granite dominated areas. The study reveals that migmatite has the highest stiff strength capacity which made it more reliable when subjected to angular or bending loads (Table 6).
Shear modulus
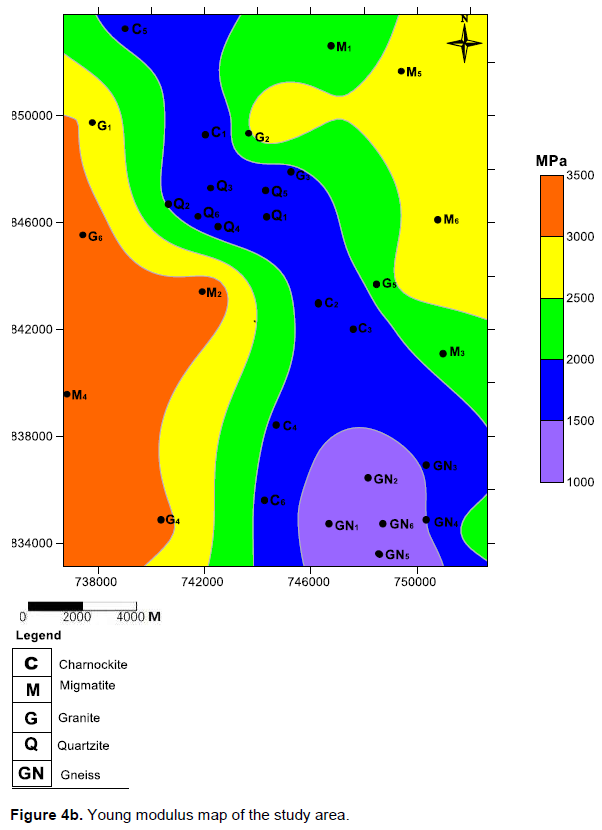
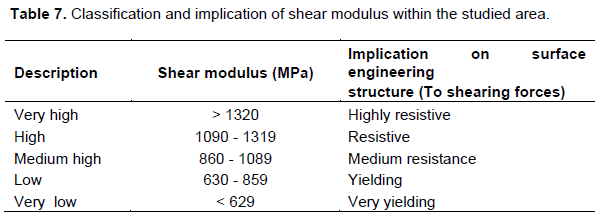
The shear modulus distribution within the study area is as shown in Figure 4c. It ranges from 400 to 1350 MPa (Table 4). The map indicates relatively low values (400 to 860 MPa) within the north-west/south-east areas. These areas include quartzite and charnockite rock. The western and south-western parts, composed of migmatites and granites are characterised with relatively high shear modulus values (1200 -1400 MPa). The measurements show that the area dominated by Charnockite has comparatively low strength than areas underlain by migmatite and granite rock. Thus, migmatite and granite have proved to be more resistive to shearing stress than other rock types characterising the study area (Table 7).
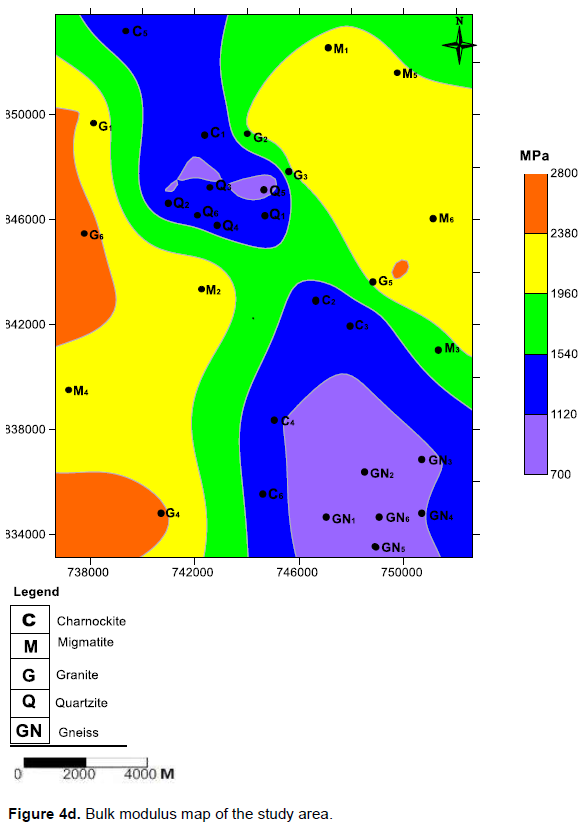
Bulk modulus
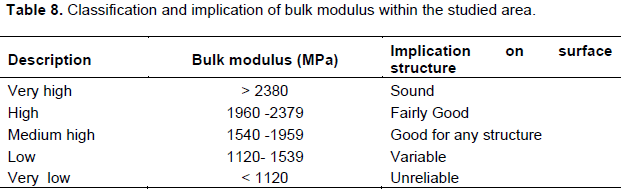
It describes how resistive a material can be to compressive forces. The bulk modulus (k) map of the study area is as shown in Figure 4d. The value ranges from 700 to 2900 MPa. It reveals relatively low values (770-1200 MPa) of bulk modulus within the north-eastern, north-west and south-eastern parts of the study area. These areas are dominated by quartzite and gneissic rocks. The relatively high values (2500 – 2900 MPa) as indctaed in Table 8 were observed within the south-western and the eastern parts of the study area, which are geologically dominated mostly by migmatite and granitic rocks. This implies that migmatite and granitic rocks are more sound to resist susceptibility to failure when subjected to all side pressure compared to other rock types within the study area.
Poisson’s ratio
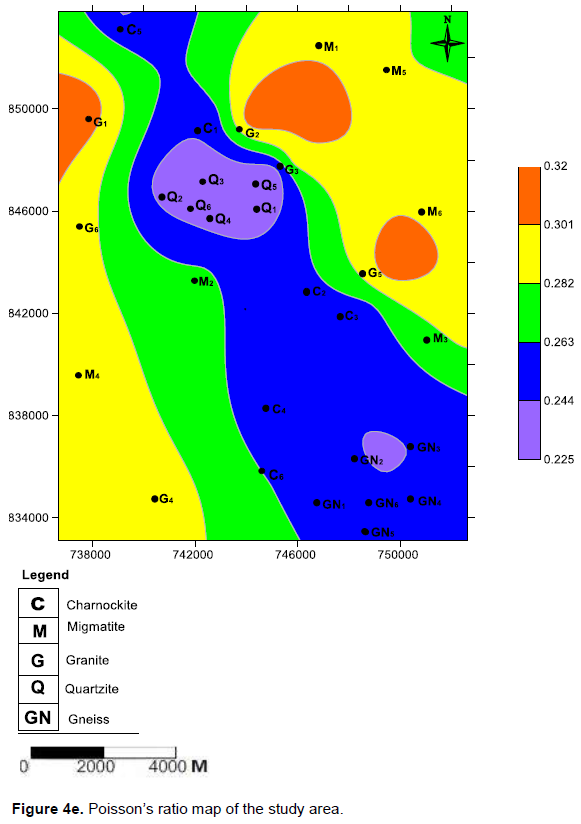
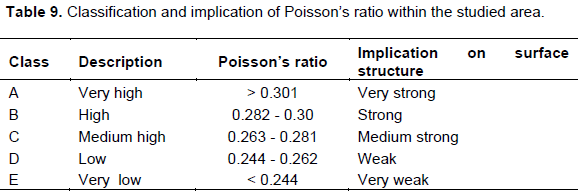
Poisson’s ratio describes the ratio of the longitudinal displacement to the axial displacement under compressive stresses. The values range from 0.225 to 0.32 (Figure 4e). Relatively low values as classified in Table 9 (0.225-0.25) were obtained in the areas underlain by quartzite, charnockite and gneiss. This implies that quartzite, charnockite and gneiss are weaker compared to other rock types within the area. Relatively higher (Table 9) values (0.3 - 0.33) characterize the area underlain by magmatic and granitic.
Evaluation of the geophysical and mechanical results
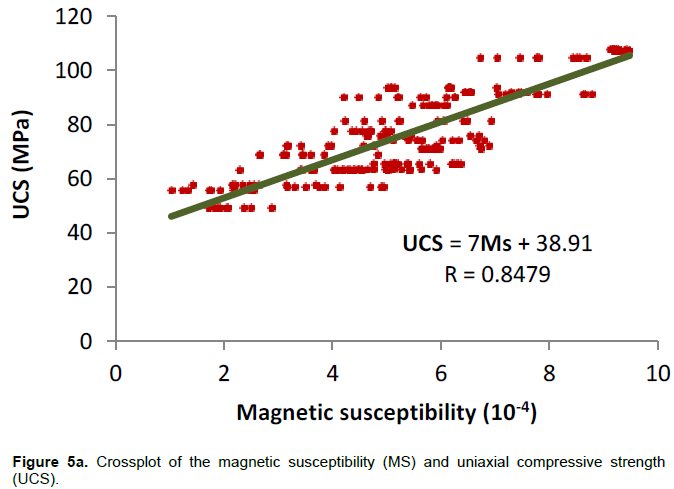
Relationship between the magnetic susceptibility (MS) and uniaxial compressive strength (UCS)
The values of iron minerals in a rock contribute to the elastic strength of the rock. The regression plot of magnetic susceptibility (Ms) against the uniaxial compressive strength (UCS) of the rock samples are presented in Figure 5a. The trend line equation for the cross plot gives coefficient of correlation (R) of 0.85, indicating a high correlation (Equation 11). This implies that magnetic susceptibility determination is reliably applicable in evaluating the stiffness of rocks for engineering purpose.
UCS = 7Ms + 38.91 (11)
Where UCS is Uniaxial Compressive Strength, Ms is Magnetic Susceptibility (10-4)
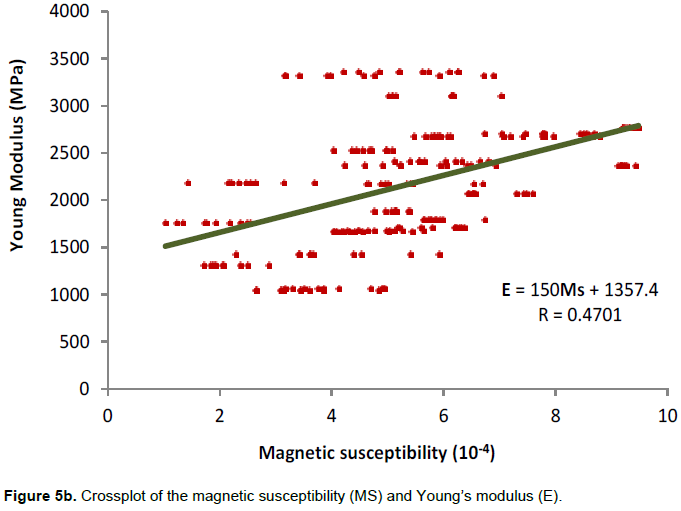
Relationship between the magnetic susceptibility (ms) and Young Modulus (E)
The regression plot of magnetic susceptibility (Ms) against the Young modulus (E) of the rock samples is presented in Figure 5b. The trend line equation for the cross plot produces coefficient of correlation (R) of 0.47. This shows a relatively fair correlation (Equation 12). This implies that, magnetic susceptibility is not reliably applicable to determination of the stiffness of rocks for engineering purpose.
E = 150MS + 1357.4 (12)
Where E = Young Modulus, Ms = Magnetic Susceptibility (10-4)
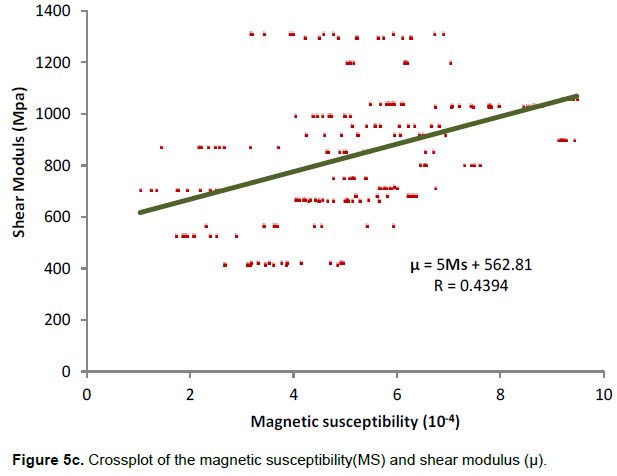
Relationship between the magnetic susceptibility(MS) and Shear Modulus (µ)
The regression plot of magnetic susceptibility (Ms) against the shear modulus (µ) of the rock samples is presented in Figure 5c. The trend line gives coefficient of correlation (R) of 0.44. Hence the equation shows a relatively weak correlation (Equation 13). This implies that magnetic susceptibility of rocks may not be reliably used to estimate the rate of resistance of rocks to prevailing shearing loads.
µ = 5Ms + 562.81 (13)
Where µ is shear modulus, Ms is magnetic susceptibility
(10-4)
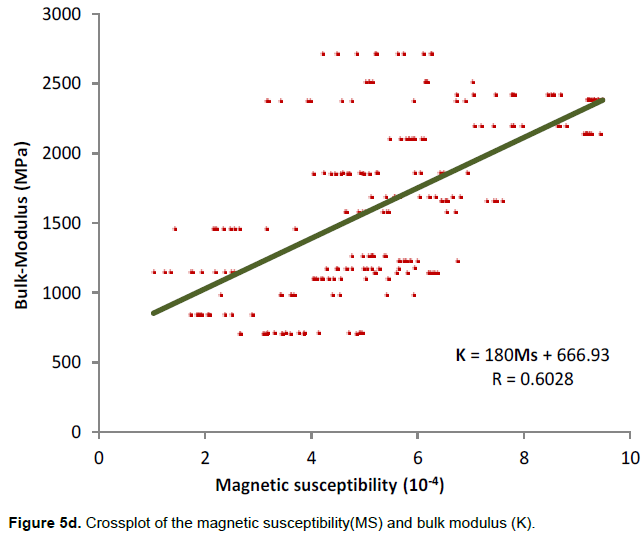
Relationship between the magnetic susceptibility(MS) and bulk modulus (K)
The regression plot of magnetic susceptibility (Ms) and the bulk modulus (K) of the rock samples are presented in Figure 5d. The trend line equation for the cross plot gives coefficient of correlation (R) of 0.60 showing a relatively good correlation (Equation 14); by implication, magnetic susceptibility can be helpful to some extent in judging the reliability of rocks to serve engineering construction purposes.
K = 180Ms + 666.93 (14)
Where K is Bulk Modulus, Ms is Magnetic Susceptibility (10-4)
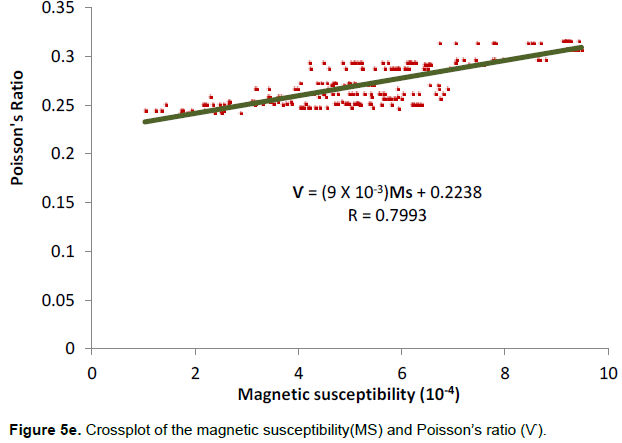
Relationship between the magnetic susceptibility (MS) and Poisson’s ratio(Ñ´)
Figure 5e shows the regression plot of magnetic susceptibility (Ms) and the Poisson’s ratio (Ñ´) of the rock samples. The trend line equation for the cross plot gives a coefficient of correlation (R) of 0.80 indicating a good correlation (Equation 15); this shows that the strength of rocks can be determined by the value of their magnetic susceptibilities.
Ñ´ = (8 X 10⁻³)M + 0.2238 (15)
Where Ñ´ is Poisson’s ratio, Ms is magnetic susceptibility (10-4)
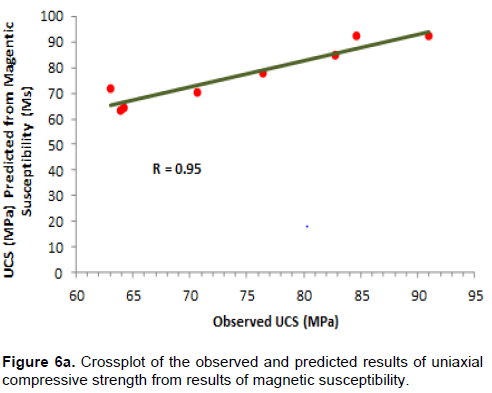
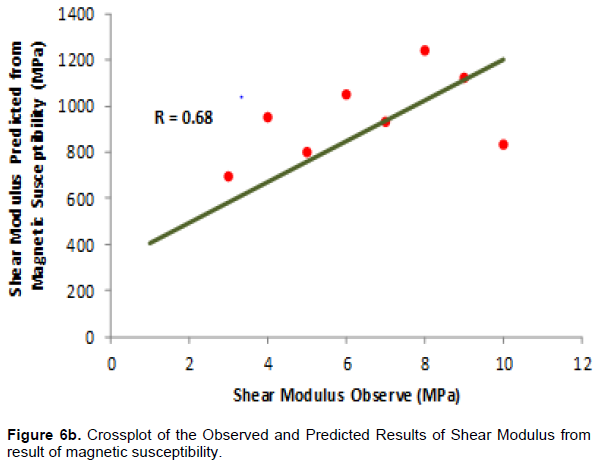
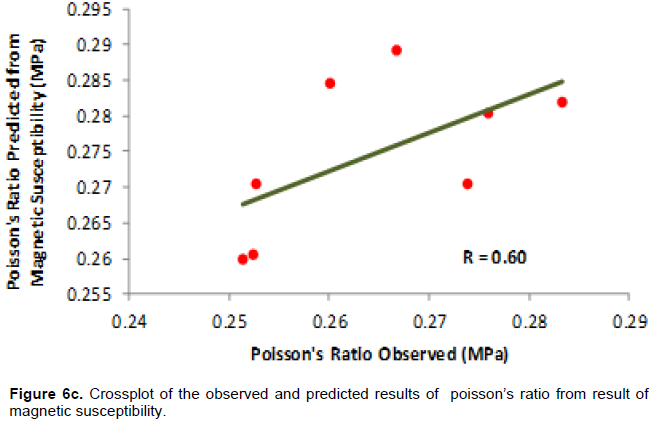
Validation of the empirical relations
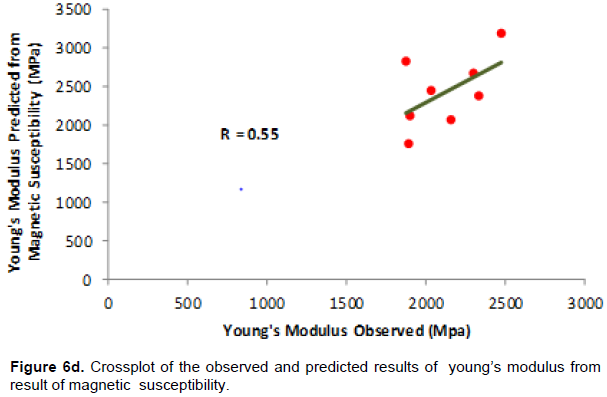
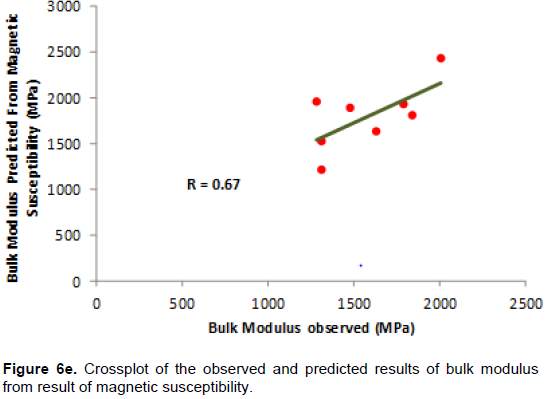
Samples were taken from ten different locations for the validation of the empirical relations. The results of the predicted mechanical parameters from the magnetic susceptibility with observed mechanical parameters are shown in Table 10.
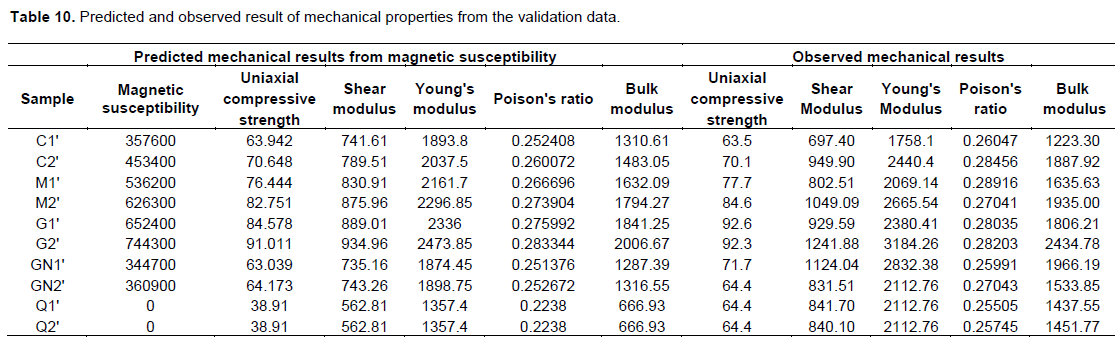
The cross plots of the observed and predicted results give coefficients of correlation (R) ranging from 0.55 to 0.95 (Figure 6a to e). This means a good correlation exists between the observed and predicted mechanical parameters derived from the magnetic susceptibility. Hence, the established empirical equations for the determination of the mechanical parameters (UCS, Young’s Modulus, Shear Modulus, Bulk Modulus and Poisson’s ratio) from the magnetic susceptibility measurement are valid.
CONCLUSIONS
The crossplots of the mechanical properties with the magnetic susceptibility show relatively fair/good correlation with coefficient of correlation (R) ranging from 44 to 85%. It implies that mechanical properties of Basement rocks can be determined using magnetic susceptibility measurements by adopting the established empirical equations for each of the determined parameters. A very strong correlation exists in the cross plot of uniaxial compressive strengths (UCS), Poisson’s ratio and bulk modulus. The esterblished magnetic susceptibility relationships with Young’s and Shear Modulus are relatively weak with coefficient of correlation (R) of 0.44 and 0.47 respectively. This implies that, magnetic susceptibility may not be reliably applicable in the determination of the stiffness of rocks and the rate of resistance of rocks to prevailing shearing loads.
The study shows that the mechanical strength of rock is a function of its magnetic susceptibility. The migmatiteand granite possess more mechanical strength as foundation bedrock than the other principal rock types that characterise the study area. The results of the study further affirmed that, highly magnetic-susceptible rocks which indicates a possible high amount of iron content have reliable correlation with the level induration, stiffness, soundness, resistance to confining and shear loads as subsurface foundation bedrocks.
CONFLICT OF INTERESTS
The authors have not declared any conflict of interests.
REFERENCES
|
Adelusi AO, Akinlalu AA, Nwanchukwu AI (2013). Integrated geophysical investigation for post-construction studies of buildings around school of science area, Federal University of Technology, Akure, southwestern, Nigeria. International Journal of Physical Science 8(15):657-669. |
|
|
Ajayi CA, Akintorinwa OJ, Ademilua OL, Adeoye AS (2019). Relationship between magnetic susceptibility and gravity of basement rocks in southwestern Nigeria. Journal of Applied Geology and Geophysics (IOSR-JAGG) 69(2):46-57. |
|
|
Ayodele OS, Ajayi CA (2016). Petrology, mineralogy and geochemistry of the Precambrian rocks around Ikere-ekiti, southwestern Nigeria. Journal of Chemical and Petrochemical Technology 2(1):1-24. |
|
|
Bayode S, Omosuyi GO, Abdullai HI (2009). Post-foundation engineering geophysical investigation in part of the Federal University of Technology, Akure, southwestern Nigeria. Journal of Emerging Trends in Engineering and Applied Sciences (JETEAS) 3(1):203-210. |
|
|
Chandong C, Mark DZ, Abbas K (2006). Empirical relations between rock strength and physical properties in sedimentary rocks. Journal of Petroleum Science and Engineering 51:223-237. |
|
|
Chary KB, Sarma LP, Lakshmi KJP (2006). Evaluation of engineering properties of rock using ultrasonic pulse velocity and uniaxial compressive strength. National Geophysical Research Institute. 7:500. |
|
|
Fadamiro JA (2002). An assessment of building regulations and standards and the implication for building collapse in Nigeria. Nigeria Institute of Building, Ondo-State, Nigeria. pp. 28-39. |
|
|
Frantisek H, Marta C, Martin C (2009). The use of magnetic susceptibility of rocks in geological exploration. Terraplus Geophysical Equipment Supplier, Georadis Publication. |
|
|
Hao Z, Wen Z, Runcheng X, Lina D, Christopher X, Yuming S, Haotian Z (2016). Characterization of Rock Mechanical Properties Using Lab Tests and Numerical Interpretation Model of Well Logs. Hindawi Publishing Corporation Mathematical Problems in Engineering. 1(10):1155. |
|
|
Mavko Mkerji GT, Dvorkin J (2003). The elastic properties of homogenous isotropic linear elastic materials. The Rock Physics Handbook, Cambridge University Press, pp. 223-235. |
|
|
Morrow CA, Moore DE, Lockner DA (2001). Permeability reduction in granite under hydrothermal conditions. Journal of Geophysics Research and Solid Earth 106:30551-30560. |
|
|
Olarewaju VO (1987). Charnockite-granite association in SW Nigeria: rapakivi granite type and charnockitic plutonism in Nigeria. Journal of African Earth Sciences 6(1):67-68. |
|
|
Olusola KO, (2002). Structural stability of building structures. Nigerian Institute of Building, Ondo-State, Nigeria, pp. 50-73. |
|
|
Oke A (2011). An examination of the causes and effects of building coollapse in Nigeria. Journal of Design and Built Environment 9:37-47 |
|
|
Patrick B, Teng-fong W, Wei Z (2014). Effects of Porosity and Crack Density on the Compressive Strength of Rocks. International Journal of Rock Mechanics and Mining Sciences 67:202-211. |
|
|
Rahaman MA (1979). Review of Basement Geology of Southwestern Nigeria, Department of Geology, Obafemi Awolowo University, Ile-Ife, Osun-State Nigeria, pp. 44-67. |
|
|
Tarlingar DH, Hrouda F (1993). The magnetic anisotropy of rocks. Chapman and Hall, London, p. 217. |
|
|
Telford WM, Geldart LP, Sheriff RE, Keys DS (1990). Applied Geophysics. Cambridge University Press. |
|
Copyright © 2024 Author(s) retain the copyright of this article.
This article is published under the terms of the Creative Commons Attribution License 4.0


