Full Length Research Paper

ABSTRACT
Variations of equatorial electrojet (EEJ) in six Magnetic Data Acquisition System (MAGDAS) stations (four stations within the magnetic equator region and two stations outside the region) on the 210ºMagnetic Meridian (MM) chain were examined. Data of hourly values of horizontal component of magnetic field, H in the year 2007 for Cooktown (CKT), Amami-oh-Shima (AMA), Davao (DAV), Langkawi (LKW), Yap- Island (YAP) and Cebu (CEB) were used in the study. The electrojet current was studied using both the estimation method and Fambitakoye simulation model to determine the correlation between their results. The strength of equatorial electrojet in the stations were estimated with respect to Cooktown (CKT; 15.48°N, 145.25°E), a station located outside the electrojet region. The maximum electrojet strength was observed in the month of March in Davao (DAV), Cebu (CEB) and Langkawi (LKW) with values of 107.5, 88.5 and 64.08 nT, respectively. The model simulation of EEJ current presents maximum values of 237.9, 207 and 160 nT in DAV, CEB and LKW, respectively in the same month. This result establishes a similarity in the performance of the methods but with higher values in the model performance. A linear correlation analysis between them showed average correlation coefficient values of 0.81 in Yap-Island (YAP), 0.84 in LKW, 0.6 in DAV and 0.54 in CEB. The data also show variability in EEJ, with results showing higher EEJ current magnitude for stations closer to the dip equator. The Root Mean Square Error (RMSE) was carried out to determine the suitability of the model for in the four seasons for each station. Result shows that the model performed better for March equinox in Cebu (3.58) and Yap-Island (5.97), December solstice (8.96) and September equinox in Davao and Langkawi (6.55), respectively.
Key words: Equatorial electrojet, dip equator, magnetic data acquisition system (MAGDAS), Fambitakoye model, E-region, solar quiet.
INTRODUCTION
The ionosphere is electrically conducting due to the partly ionized plasma generated by photoionization from solar radiation, which is the major source of solar quiet (Sq) current. The concept and study of Equatorial Electrojet (EEJ) current have been traced to Chapman (1951) who observed that the daily variation of geomagnetic field component at the equatorial stations is due to the superimposition of Sq current and the EEJ current flowing eastward at the mid latitude. Sq variations occur in the E-region in the ionosphere and can be determined by magnetic records of dynamo action on magnetically quiet days. The EEJ is a narrow band of intense electric current flowing eastward at 100 to 120 km altitude within ±3ÌŠ latitude of the geomagnetic dip equator in the ionosphere (Chapman, 1951). EEJ is enhanced by localized ionospheric currents and physical structure flowing at the dip equator with higher current intensities during the daytime, which are responsible for Sq variation. Several authors have studied various aspects of the variations of solar quiet horizontal component, the variation of EEJ strength, as well as correlation of EEJ between pairs of stations. Chapman (1951), Richmond (1973) and Onwumechili (1997) observed that the daily variation of geomagnetic field component at the equatorial station is due to the superimposition of the Sq current and the EEJ current flowing eastward at the lower altitude. Gouin and Mayaud (1967) concluded that if Sq and EEJ currents are flowing opposite to one another such that the westward EEJ current exceeds the global eastward Sq current it is called Counter Electrojet (CEJ). Adimula et al. (2011) studied the geomagnetic field variations from some EEJ stations. Their results show that there could be substantial day-to-day variability in the EEJ strength along the dip equator and correlation between pairs of stations decreases as a function of increasing distance between them. The data also shows a longitudinal variability in EEJ with the strongest EEJ current in South American sector and weakest in Malaysian sector. Abbas and Salihu (2014) studied the variability strength of EEJ over Africa during low solar activity and observed that post-sunset counter electrojet was found to be greater than pre-sunrise which is attributed to difference in photoionization. It is imperative to note that no direct measuring equipment has been provided for the measurement of EEJ, researchers have usually derived EEJ through inference from Sq current as well as models developed from earlier researchers. However, little or no attention has been paid to the morphology and comparison of EEJ derived from model and that inferred from Sq. This study is aimed at investigating the performance and correlation between Fambitakoye model and the estimated method of deriving EEJ current.
DATA AND METHODS
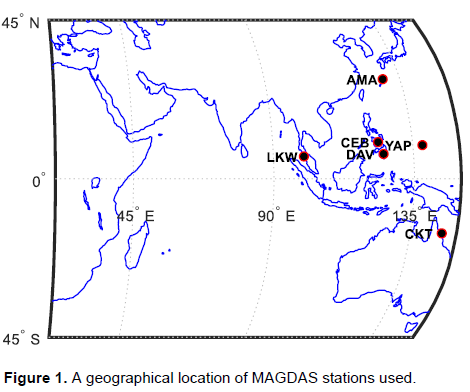
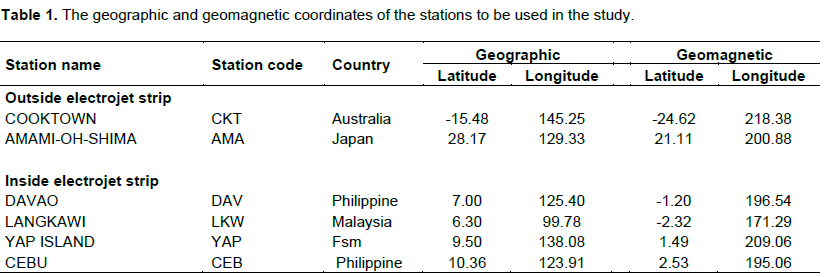
The year 2007 (low solar activity year) data from Magnetic Data Acquisition System (MAGDAS) facilities for six (6) observatories were used for the study. Figure 1 shows geographical location of MAGDAS stations and Table 1 shows the coordinates of the stations. Five (5) most magnetically quiet days from the Internationally Quiet Day (IQD) in each month for the year were selected according to the classification of planetary magnetic index, Kp (Geoscience Australia, 2009). The baseline value of H (H0) was calculated as the average value of H component near local midnight between 2400 and 0100 Local Time LT.
Ho = H2400 + H2300 + H0200 + H0100 / 4 (1)
where H2400, H2300, H0100, and H0200 represent the hourly values of H at 24, 23, 02 and 01 h LT, respectively. The midnight baseline values were subtracted from the hourly values to get the hourly departures from the midnight for a particular day. Thus,

where t=1 to 24,  is hourly values of magnetic element H, dH gives the measure of the hourly amplitude of the variation of horizontal component of the earth magnetic field H, that is, SqH (Rabiu et al., 2007). The seasonal variation was studied by grouping the months into four seasons; December Solstice (November, December, January), March Equinox (February, March, April), June Solstice (May, June, July), September Equinox (August, September, October). Each season is estimated by averaging the monthly hourly values of the parameters for individual months constituting a particular season.
Obtaining electrojet current
From the Sq observation
Generally, signatures of EEJ have been deduced using Equation 3 by subtracting dH values of station located outside the electrojet region from station located within the region (Anderson et al., 2006).

From the Fambitakoye model
The EEJ is considered as a current ribbon flowing eastward along the magnetic equator at a fixed altitude (h=105 km) according to Fambitakoye and Mayaud (1976).
The EEJ current distribution will then be represented by the following expression;
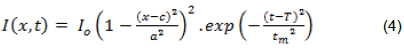
where x is the northward distance from the EEJ centre and is defined as c-a < x ≤ c+a; c is the position of the EEJ center and a is the half width.
The quadratic current distribution is used in this study because it satisfactorily accounts for the observed magnetic effects of the EEJ (Fambitakoye and Mayaud, 1976).
RESULTS AND DISCUSSION
Seasonal variation
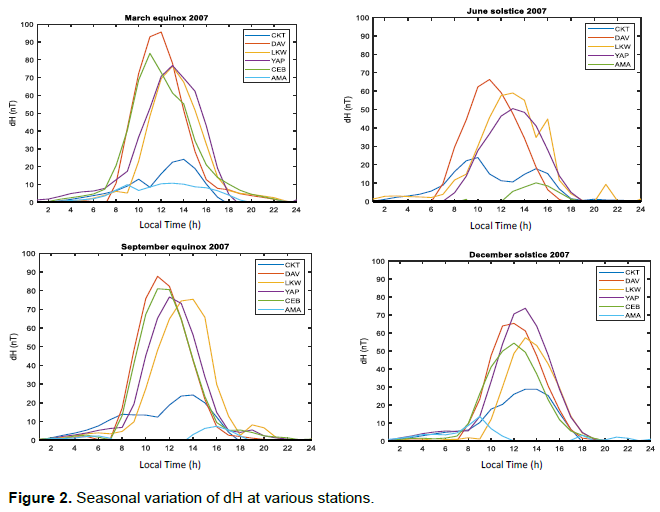
Figure 2 shows seasonal variation of dH at various stations. From the figure, it could be seen that seasonal variation was higher in stations closer to the magnetic equator compared to stations located away from equator in all the seasons. Equinoctial season also have higher values compared to solstice period. For instance, YAP and LKW both recorded maximum values of 76.8 nT in March equinox and minimum values of 50.49 and 58.98 nT, respectively in June solstice. Similarly, in March equinox, DAV showed a maximum variation of 95.59 nT with least variation in June and December solstice with values of 66.31 and 65.38 nT, respectively. CEB displayed maximum value of 83.62 nT (March equinox) with least variation of 78.78 nT in December solstice. Variation of SqH in CKT recorded maximum value of 28.82 nT in December solstice and minimum of 23.89 nT in September equinox. The range value of seasonal variation in March equinox for stations investigated is 84.88 nT, 56.18 nT in June solstice and 65.12 nT in December solstice. In this study, it could be seen that maximum values of Sq are recorded in equinoctial season. The highest peak of Sq recorded during the equinox could be attributed to enhanced equatorial electron density which increases the electrical conductivity when the sun is overhead at the equinox in addition to changes in corresponding electric field (Adimula et al., 2011). The seasonal change could be attributed to a seasonal shift in the mean position of Sq current system of the ionospheric electrojet (Hutton, 1962). The electrodynamics effect of local winds can also account for seasonal variability. Higher values of SqH in equinoctial season have been observed in previous seasonal variation studies by Chandra and Rastogi (2000), Rabiu et al. (2007) and Rastogi et al. (1994).
The seasonal variation of the electrojet strength was examined in the equatorial stations (Davao, Yap Island, Cebu and Langkawi) with respect to Cooktown (CKT), a reference station located outside the electrojet belt as shown in Figures 3 to 6. A representative month for each season was used to deduce the seasonal variation of EEJ in each station due to data availability. The months of January, February, July and September were used to represent December solstice, March equinox, June solstice and September equinox, respectively. Also, the results for CEBU station are not reported for June and September due to missing data. The EEJ strength reaches a maximum around noon in all the stations with morning depression known as counter electrojet seen around 0600 to 0800 LT, and a post-noon depression around 1600 LT suggesting global effect on H component of the magnetic field. The model simulation of EEJ was examined in this work using the Fambitakoye model, the simulation model presented similar pattern as estimated values from Sq but with higher variation in all the stations. Figures 7 to 10 show seasonal graphs of both the simulated model EEJ (axis on the left hand side) and the observed EEJ (axis on the right hand side) for the four equatorial stations in each season. The highest values were observed in March for all the stations suggesting the equinoctial maximum as a result of sun’s overhead. Tables 2 to 5 present details of peak values of EEJ current as well as the correlation coefficient values between both methods in each station.
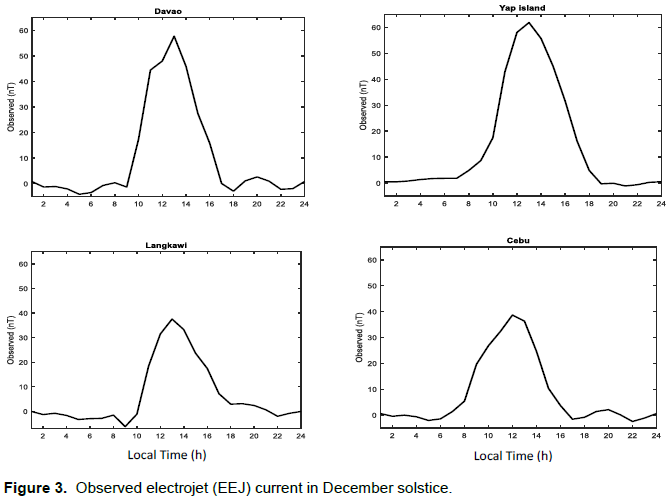
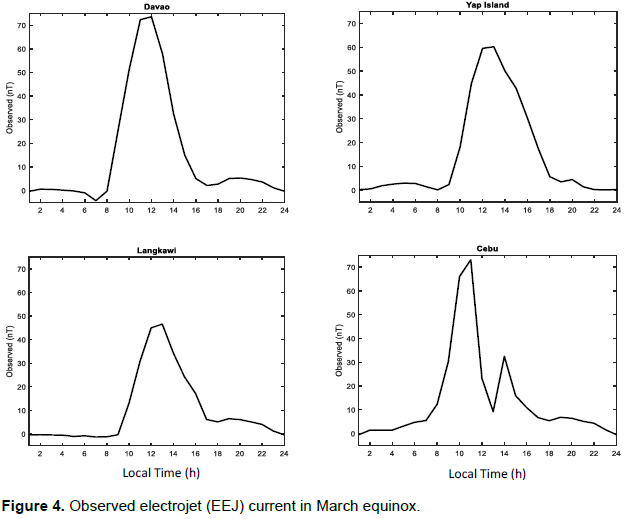
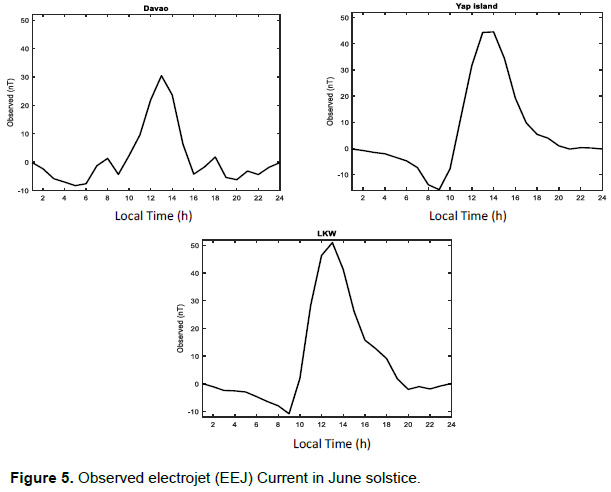
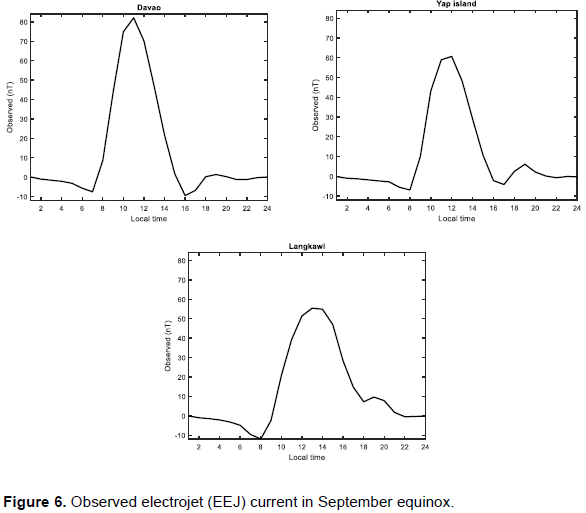
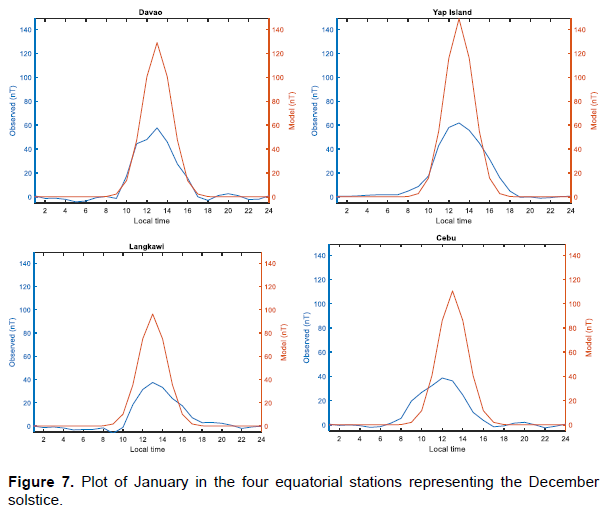
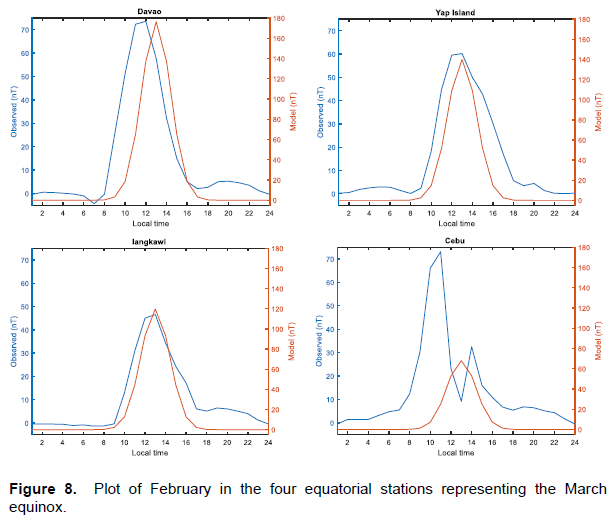
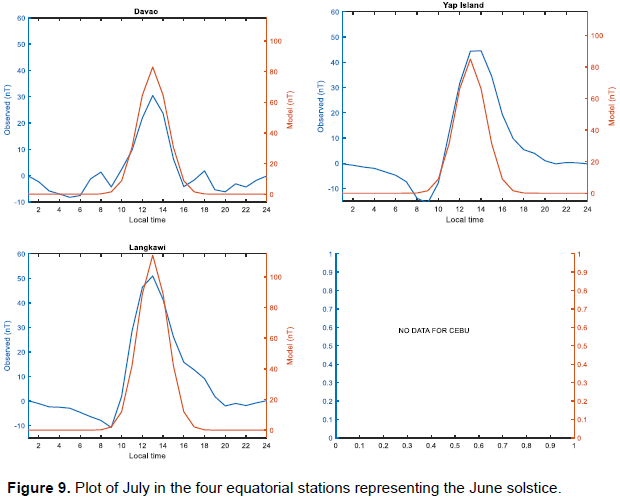
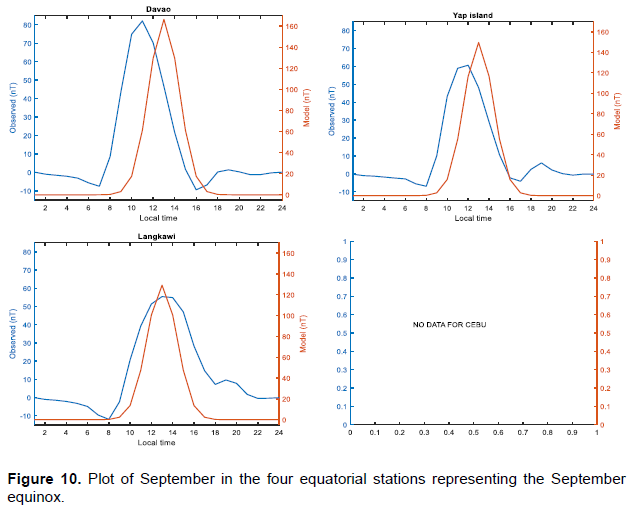
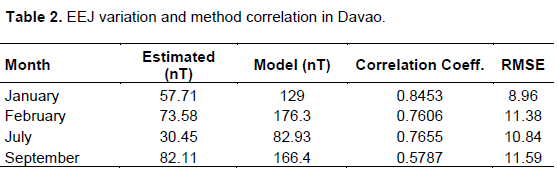
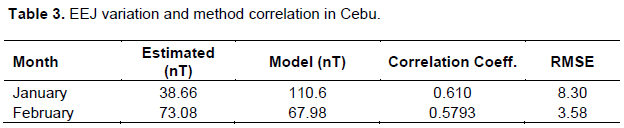
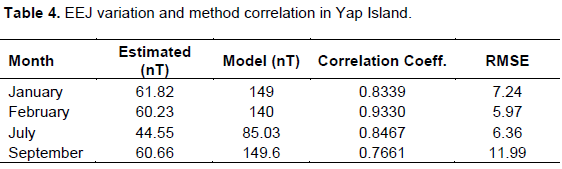
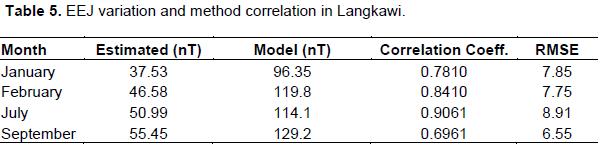
From the aforementioned values, it could be seen that the closer the station is to the dip equator, the higher the value of EEJ current. The non-availability of data in July and September resulted in the missing values those months in the Cebu, while February recorded a higher value of 73.08 nT with a lower model value of 67.98 nT. In Davao, the estimated EEJ value was observed to be the highest in September equinox with a value of 82.11 nT and the lowest value of 30.45 nT in June solstice. The simulated model displayed the highest value of 176.3 nT in March equinox and the lowest value of 82.93 nT. In LKW, September equinox recorded the highest values using both approach and the lowest values of 37.53 and 96.35 nT were recorded in the estimated and model simulation method. YAP recorded its peak value in January (61.82 nT) using estimated method and 149.6 nT in September with model simulation. Tables 2 to 5 also show the correlation examined performance and suitability between both methods. Correlation coefficient measures the strength and direction of linear relationship between two variables. The value is between +1 and -1. In Davao, correlation value was good in January solstice but performed poorly in September equinox. This indicates a gap in the performance and estimation of EEJ in the month. The average correlation coefficient for Davao is 0.6 for the year. YAP recorded higher values after DAV with an average correlation of 0.81 while CEB and LKW presented values of 0.54 and 0.84, respectively. Also, the root mean square error (RMSE) was used to measure difference between model values and observed values for each station. The lower the value of the RMSE, the better the model prediction. The lowest RMSE value of 8.91 was recorded in December solstice and the highest value of 11.59 in September equinox in Davao. In Langkawi, September equinox had the least RMSE of 6.55 and the highest (8.91) in June solstice.
The highest RMSE of 11.99 was recorded in September equinox and a least RMSE of 5.97 in March equinox for Yap Island. In Cebu, data for only two seasons were available, with March equinox recording the lower RMSE and December solstice having a higher value of 8.30. This shows that the model performed better for March equinox in Cebu and Yap-Island, December solstice and September equinox in Davao and Langkawi, respectively.
CONCLUSION
The horizontal component of the magnetic field in the stations exhibits latitudinal variations as the position of the stations affects the magnetic field intensity recorded. The closer the stations are to the magnetic equator, the higher the magnetic field intensity recorded in the station. The variability of the ionospheric processes and physical structure such as conductivity and wind structure are responsible for the Sq variation which is a proxy of EEJ study. Also, peak values of EEJ variation was seen in equinox months, while Fambitakoye model displayed higher values than the estimation method. The correlation coefficient revealed the performance between both methods. The study shows good fit in some months while in other months, the model performed poorly. The model simulation did not also give consideration to variations in local period except local noon. Local effects on strength of EEJ could further be investigated.
CONFLICT OF INTERESTS
The authors have not declared any conflict of interests.
ACKNOWLEDGMENTS
The authors are grateful to the MAGDAS team at Kyushu University, Japan for preserving the data used. They also thank the Department of Physics, University of Ilorin for enabling the use of Equatorial Ionospheric Observatory to obtain MAGDAS data used in this research.
REFERENCES
| Abbas M, Salihu M (2014).Variability Strength of the Equatorial Electrojet over Africa during Low Solar Activity. International Journal of Marine, Atmospheric and Earth Sciences 2(1):28-40. | ||||
| Adimula IA, Rabiu Yumoto K, the MAGDAS group (2011). Geomagnetic Field Variation for some Equatorial Electrojet Stations. Sun and Geosphere 6(2):45-49. | ||||
|
Chandra H, Rastogi RG (2000). Equatorial electrojet studies from rocket and ground measurements. Earth, Planets and Space 52(2):111-120. Crossref |
||||
|
Chapman S (1951). The equatorial electrojet as detected from the abnormal electric current distribution above Huancayo, Peru, and elsewhere. Archive for Meteorologie, Geophysik und Bioklimatologie, Serie A 4(1):368-390. Crossref |
||||
|
Fambitakoye O, Mayaud PN (1976). Equatorial electrojet and regular daily variation sr - i. a determination of the equatorial electrojet parameters. Journal of Atmospheric and Terrestrial Physics 38:1-17. Crossref |
||||
| Gouin P, Mayaud PN (1967). A proposal for the possible existence of a counter electrojet at magnetic equatorial latitudes. Annual of Geophysics (France), 23:41-47. | ||||
|
Hutton R (1962). The solar and lunar daily variations of Earth currents near the magnetic equator. Journal of Atmospheric and Terrestrial Physics 24(8):673-680. Crossref |
||||
| Onwumechili CA (1997). The Equatorial Electrojet Gordon and Breach Science Publishers. | ||||
| Rabiu AB, Mamukuyomi AI, Joshua EO (2007). Variability of equatorial ionosphere inferred from geomagnetic field measurements. Bulletin of the Astronomical Society of India 35:607-618. | ||||
|
Rastogi RG, Alex S, Patil A (1994). Seasonal variations of geomagnetic D, H and Z fields at low latitudes. Journal of Geomagnetism and Geoelectricity 46(2):115-126. Crossref |
||||
|
Richmond AD (1973). Equatorial electrojet-I. Development of a model including winds and instabilities. Journal of Atmospheric and Terrestrial Physics 35(6):1083-1103. Crossref |
||||
Copyright © 2024 Author(s) retain the copyright of this article.
This article is published under the terms of the Creative Commons Attribution License 4.0


