ABSTRACT
Herein, results of thermodynamic analysis of some theoretical and experimental [thermal desorption (TDS), scanning tunneling microscopy (STM), scanning tunneling spectroscopy (STS), high-resolution electron energy loss spectroscopy/low-energy electron diffraction (HREELS/LEED), photoelectron spectroscopy (PES), angle-resolved photoemission spectroscopy (ARPES), Raman spectroscopy and others] data on “reversible” hydrogenation and dehydrogenation of some graphene-layer-nanostructures are presented. In the framework of the formal kinetics and the approximation of the first order rate reaction, some thermodynamic quantities for the reaction of hydrogen sorption (the reaction rate constant, the reaction activation energy, the per-exponential factor of the reaction rate constant) have been determined. Some models and characteristics of hydrogen chemisorption on graphite (on the basal and edge planes) have been used for interpretation of the obtained quantities, with the aim of revealing the atomic mechanisms of hydrogenation and dehydrogenation of different graphene-layer-systems. The cases of both non-diffusion rate limiting kinetics and diffusion rate limiting kinetics are considered. Some open questions and perspectives remain in solving the actual problem in effective hydrogen on-board storage; using the graphite nanofibers (GNFs) is also considered.
Key words: Epitaxial and membrane graphenes, other graphene-layer-systems, hydrogenation-dehydrogenation, thermodynamic characteristics, atomic mechanisms, the hydrogen on-board efficient storage problem.
As noted in a number of articles 2007 through 2014, hydrogenation of graphene-layers-systems, as a prototype of covalent chemical functionality and an effective tool to open the band gap of graphene, is of both fundamental and applied importance (Geim and Novoselov, 2007; Palerno, 2013).
It is relevant to the current problems of thermodynamic stability and thermodynamic characteristics of the hydrogenated graphene-layers-systems (Sofo et al., 2007; Openov and Podlivaev, 2010; Han et al., 2012), and also to the current problem of hydrogen on-board storage (Akiba, 2011; Zuettel, 2011; DOE targets, 2012).
In the case of epitaxial graphene on substrates, such as SiO2 and others, hydrogenation occurs only on the top basal plane of graphene, and it is not accompanied with a strong (diamond-like) distortion of the graphene network, but only with some ripples. The first experimental indication of such a specific single-side hydrogenation came from Elias et al. (2009). The authors mentioned a possible contradiction with the theoretical results of Sofo et al. (2007), which had down-played the possibility of a single side hydrogenation. They proposed an important facilitating role of the material ripples for hydrogenation of graphene on SiO2, and believed that such a single-side hydrogenated epitaxial graphene can be a disordered material, similar to graphene oxide, rather than a new graphene-based crystal - the experimental graphane produced by them (on the free-standing graphene membrane).
On the other hand, it is expedient to note that changes in Raman spectra of graphene caused by hydrogenation were rather similar (with respect to locations of D, G, D′, 2D and (D+D′) peaks) both for the epitaxial graphene on SiO2 and for the free-standing graphene membrane (Elias et al., 2009).
As it is supposed by many scientists, such a single side hydrogenation of epitaxial graphene occurs, because the diffusion of hydrogen along the graphene-SiO2 interface is negligible, and perfect graphene is impermeable to any atom and molecule (Jiang et al., 2009). But, firstly, these two aspects are of the kinetic character, and therefore they cannot influence the thermodynamic predictions (Sofo et al., 2007; Boukhvalov et al., 2008; Zhou et al., 2009). Secondly, as shown in the present analytical study, the above noted two aspects have not been studied in an enough degree.
As shown in Elias et al. (2009), when a hydrogenated graphene membrane had no free boundaries (a rigidly fixed membrane) in the expanded regions of it, the lattice was stretched isotropically by nearly 10%, with respect to the pristine graphene. This amount of stretching (10%) is close to the limit of possible elastic deformations in graphene (Nechaev and Veziroglu, 2013), and indeed it has been observed that some of their membranes rupture during hydrogenation. It was believed (Elias et al., 2009) that the stretched regions were likely to remain non-hydrogenated. They also found that instead of exhibiting random stretching, hydrogenated graphene membranes normally split into domain-like regions of the size of the order of 1 µm, and that the annealing of such membranes led to complete recovery of the periodicity in both stretched and compressed domains (Elias et al., 2009).
It can be supposed that the rigidly fixed graphene membranes are related, in some degree, to the epitaxial graphenes. Those may be rigidly fixed by the cohesive interaction with the substrates.
As was noted in Xiang et al. (2010), the double-side hydrogenation of graphene is now well understood, at least from a theoretical point of view. For example, Sofo et al. (2007) predicted theoretically a new insulating material of CH composition called graphane (double-side hydrogenated graphene), in which each hydrogen atom adsorbs on top of a carbon atom from both sides, so that the hydrogen atoms adsorbed in different carbon sublattices are on different sides of the monolayer plane (Sofo et al., 2007). The formation of graphane was attributed to the efficient strain relaxation for sp3 hybridization, accompanied by a strong (diamond-like) distortion of the graphene network (Sofo et al., 2007; Xiang et al., 2009). In contrast to graphene (a zero-gap semiconductor), graphane is an insulator with an energy gap of Eg» 5.4 eV (Openov and Podlivaev, 2010; Lebegue et al., 2009).
Only if hydrogen atoms adsorbed on one side of graphene (in graphane) are retained, we obtain graphone of C2H composition, which is a magnetic semiconductor with Eg» 0.5 eV, and a Curie temperature of Tc» 300 to 400K (Zhou et al., 2009).
As was noted in Openov and Podlivaev (2012), neither graphone nor graphane are suitable for real practical applications, since the former has a low value of Eg, and undergoes a rapid disordering because of hydrogen migration to neighboring vacant sites even at a low temperature, and the latter cannot be prepared on a solid substrate (Podlivaev and Openov, 2011).
It is also expedient to refer to a theoretical single-side hydrogenated graphene (SSHG) of CH composition (that is, an alternative to graphane (Sofo et al. (2007)), in which hydrogen atoms are adsorbed only on one side (Pujari et al., 2011; Dzhurakhalov and Peeters, 2011). In contrast to graphone, they are adsorbed on all carbon atoms rather than on every second carbon atom. The value of Eg in SSHG is sufficiently high (1.6 eV lower than in graphane), and it can be prepared on a solid substrate in principle. But, this quasi-two-dimensional carbon-hydrogen theoretical system is shown to have a relatively low thermal stability, which makes it difficult to use SSGG in practice (Openov and Podlivaev, 2012; Pujari et al., 2011).
As was noted in Pujari et al. (2011), it may be inappropriate to call the covalently bonded SSHG system sp3 hybridized, since the characteristic bond angle of 109.5° is not present anywhere that is, there is no diamond-like strong distortion of the graphene network, rather than in graphane. Generally in the case of a few hydrogen atoms interacting with graphene or even for graphane, the underlining carbon atoms are displaced from their locations. For instance, there may be the diamond-like local distortion of the graphene network, showing the signature of sp3 bonded system. However, in SSHGraphene all the carbon atoms remain in one plane, making it difficult to call it sp3 hybridized. Obviously, this is some specific sp3- like hybridization.
The results of Nechaev (2010), and also Table 1A and B in the present paper, of thermodynamic analysis of a number of experimental data point that some specific local sp3- like hybridization, without the diamond-like strong distortion of the graphene network, may be manifested itself in the cases of hydrogen atoms dissolved between graphene layers in isotropic graphite, graphite nanofibers (GNFs) and nanostructured graphite, where obviously there is a situation similar (in a definite degree) to one of the rigidly fixed graphene membranes. As far as we know, it has not been taken into account in many recent theoretical studies.
In this connection, it is expedient to note that there are a number of theoretical works showing that hydrogen chemisorption corrugates the graphene sheet in fullerene, carbon nanotubes, graphite and graphene, and transforms them from a semimetal into a semiconductor (Sofo et al., 2007; Elias et al., 2009). This can even induce magnetic moments (Yazyev and Helm, 2007; Lehtinen et al., 2004; Boukhvalov et al., 2008).
Previous theoretical studies suggest that single-side hydrogenation of ideal graphene would be thermodynamically unstable (Boukhvalov et al., 2008; Zhou et al., 2009). Thus, it remains a puzzle why the single-side hydrogenation of epitaxial graphenes is possible and even reversible, and why the hydrogenated species are stable at room temperatures (Elias et al., 2009; Sessi et al., 2009). This puzzling situation is also considered in the present analytical study.
Xiang et al. (2010) noted that their test calculations show that the barrier for the penetration of a hydrogen atom through the six-member ring of graphene is larger than 2.0 eV. Thus, they believe that it is almost impossible for a hydrogen atom to pass through the six-member ring of graphene at room temperature (from a private communication with Xiang et al. (2009).
In the present analytical study, a real possibility of the penetration is considered when a hydrogen atom can pass through the graphene network at room temperature. This is the case of existing relevant defects in graphene, that is, grain boundaries, their triple junctions (nodes) and/or vacancies (Brito et al., 2011; Zhang et al., 2014; Banhart et al., 2011; Yazyev and Louie, 2010; Kim et al., 2011; Koepke et al., 2013; Zhang and Zhao, 2013; Yakobson and Ding, 2011; Cockayne et al., 2011; Zhang et al., 2012; Eckmann et al., 2012). The present study is related to revealing the atomic mechanisms of reversible hydrogenation of epitaxial graphenes, compared with membrane graphenes.
In the next parts of this paper, results of thermodynamic analysis, comparison and interpretation of some theoretical and experimental data are presented, which are related to better understanding and/or solving of the open questions mentioned above. It is related to a further development and modification of our previous analytical results (2010-2014), particularly published in the openaccess journals. Therefore, in the present paper, the related figures 1- 25 from our “open” publication (Nechaev and Veziroglu, 2013) are referred.
CONSIDERATION OF SOME ENERGETIC CHARACTERISTICS OF THEORETICAL GRAPHANES
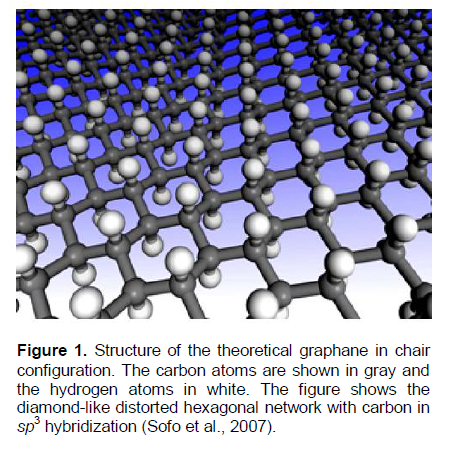
In the work of Sofo et al. (2007), the stability of graphane, a fully saturated extended two-dimensional hydrocarbon derived from a single grapheme sheet with formula CH, has been predicted on the basis of the first principles and total-energy calculations. All of the carbon atoms are in sp3 hybridization forming a hexagonal network (a strongly diamond-like distorted graphene network) and the hydrogen atoms are bonded to carbon on both sides of the plane in an alternative manner. It has been found that graphane can have two favorable conformations: a chair-like (diamond-like, Figure 1) conformer and a boat-like (zigzag-like) conformer (Sofo et al., 2007).
The diamond-like conformer (Figure 1) is more stable than the zigzag-like one. This was concluded from the results of the calculations of binding energy (?Hbind.(graphane)) (that is, the difference between the total energy of the isolated atoms and the total energy of the compounds), and the standard energy of formation (?H0f298(graphane)) of the compounds (CH(graphane)) from crystalline graphite (C(graphite)) and gaseous molecular hydrogen (H2(gas)) at the standard pressure and temperature conditions (Sofo et al., 2007; Dzhurakhalov and Peeters, 2011).
For the diamond-like graphane, the former quantity is ?Hbind.(graphane) = 6.56 eV/atom, and the latter one is ?H1 = ?H0f298(graphane) = - 0.15 eV/atom. The latter quantity corresponds to the following reaction:
C(graphite) + ½H2(gas)→ CH(graphane), (?H1) (1)
Where ?H1 is the standard energy (enthalpy) change for this reaction.
By using the theoretical quantity of ?H0f298(graphane), one can evaluate, using the framework of the thermodynamic method of cyclic processes (Karapet’yants and Karapet’yants, 1968; Bazarov, 1976), a value of the energy of formation (?H2) of graphane (CH(graphane)) from graphene (C(graphene)) and gaseous atomic hydrogen (H(gas)). For this, it is necessary to take into consideration the following three additional reactions:
C(graphene)+ H(gas)→ CH(graphane),(?H2) (2)
C(graphene)→ C(graphite), (?H3) (3)
H(gas)→ ½ H2(gas), (H4) (4)
where ?H2, ?H3 and ?H4 are the standard energy (enthalpy) changes.
Reaction 2 can be presented as a sum of Reactions 1, 3 and 4 using the framework of the thermodynamic method of cyclic processes (Bazarov, 1976):
?H2 = (?H3+?H4+?H1). (5)
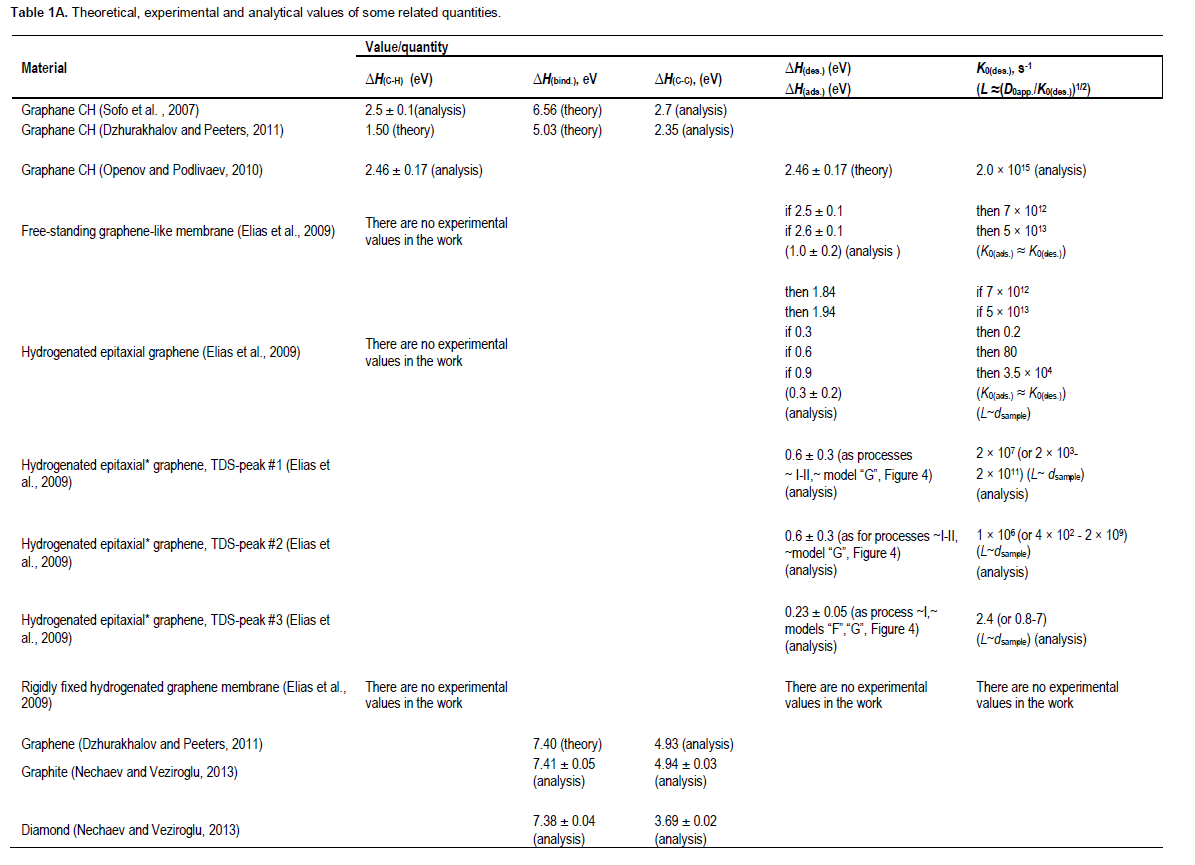
Substituting in Equation 5 the known experimental values (Karapet’yants and Karapet’yants, 1968; Dzhurakhalov and Peeters, 2011) of ?H4 = -2.26 eV/atom and ?H3 = -0.05 eV/atom, and also the theoretical value (Sofo et al., 2007) of ?H1 = -0.15 ??/atom, one can obtain a desired value of ?H2 = -2.5 ± 0.1 eV/atom. The quantity of -?H2 characterizes the breakdown energy ofC-H sp3 bond in graphane (Figure 1), relevant to the breaking away of one hydrogen atom from the material, which is ?H(C-H)graphane = -?H2 = 2.5 ± 0.1 eV (Table 1A).
In evaluating the above mentioned value of ?H3, one can use the experimental data (Karapet’yants and Karapet’yants, 1968) on the graphite sublimation energy at 298K (?Hsubl.(graphite) = 7.41 ± 0.05 eV/atom), and the theoretical data (Dzhurakhalov and Peeters, 2011) on the binding cohesive energy at about 0K for graphene (?Hcohes.(graphene) = 7.40 eV/atom). Therefore, neglecting the temperature dependence of these quantities in the interval of 0 to 298K, one obtains the value of ?H3» -0.05 eV/atom.
?Hcohes.(graphene) quantity characterizes the breakdown energy of1.5 C-C sp2 bond in graphene, relevant to the breaking away of one carbon atom from the material. Consequently, one can evaluate the breakdown energy ofC-C sp2 bonds in graphene, which is ?H(C-C)grapheme = 4.93 eV. This theoretical quantity coincides with the similar empirical quantities obtained in (Nechaev and Veziroglu, 2013) from ?Hsubl.(graphite) forC-C sp2 bonds in graphene and graphite, which are ?H(C-C)graphene » ?H(C-C)graphite = 4.94 ± 0.03 eV. The similar empirical quantity for C-C sp3 bonds in diamond obtained from the diamond sublimation energy ?Hsubl.(diamond) (Karapet’yants and Karapet’yants, 1968) is ?H(C-C)diamond = 3.69 ± 0.02 eV (Nechaev and Veziroglu, 2013).
It is important to note that chemisorption of hydrogen on graphene was studied (Dzhurakhalov and Peeters, 2011) using atomistic simulations, with a second generation reactive empirical bond order of Brenner inter-atomic potential. As shown, the cohesive energy of graphane (CH) in the ground state is ?Hcohes.(graphane) = 5.03 eV/atom (C). This results in the binding energy of hydrogen, which is ?H(C-H)graphane = 1.50 eV/atom (Dzhurakhalov and Peeters, 2011) (Table 1A).
The theoretical ?Hbind.(graphane) quantity characterizes the breakdown energy of one C-H sp3 bond and 1.5 C-C sp3 bonds (Figure 1). Hence, by using the above mentioned values of ?Hbind.(graphane) and ?H(C-H)graphane, one can evaluate the breakdown energy ofC-C sp3 bonds in the theoretical graphane (Sofo et al., 2007), which is ?H(C-C)graphane = 2.7 eV (Table 1). Also, by using the above noted theoretical values of ?Hcohes.(graphane) and ?H(C-H)graphane, one can evaluate similarly the breakdown energy ofC-C sp3 bonds in the theoretical graphane (Dzhurakhalov and Peeters, 2011), which is ?H(C-C)graphane = 2.35 eV (Table 1A).
CONSIDERATION AND INTERPRETATION OF THE DATA ON DEHYDROGENATION OF THEORETICAL GRAPHANE, COMPARING W
In Openov and Podlivaev (2010) and Elias et al. (2009) the process of hydrogen thermal desorption (TDS) from graphane has been studied using the method of molecular dynamics. The temperature dependence (for T = 1300 - 3000K) of the time (t0.01) of hydrogen desorption onset (that is, the time t0.01 of removal ~1% of the initial hydrogen concentration C0 » 0.5 (in atomic fractions), -ΔC/C0 » 0.01, C/C0» 0.99) from the C54H7(54+18) clustered with 18 hydrogen passivating atoms at the edges to saturate the dangling bonds of sp3-hybridized carbon atoms have been calculated. The corresponding activation energy of ?H(des.) = Ea = 2.46 ± 0.17 eV and the corresponding (temperature independent) frequency factor A = (2.1 ± 0.5) × 1017 s-1 have also been calculated. The process of hydrogen desorption at T = 1300 - 3000K has been described in terms of the Arrhenius-type relationship:
1/t0.01 = A exp (-Ea /kB T), (6)
where kB is the Boltzmann constant.
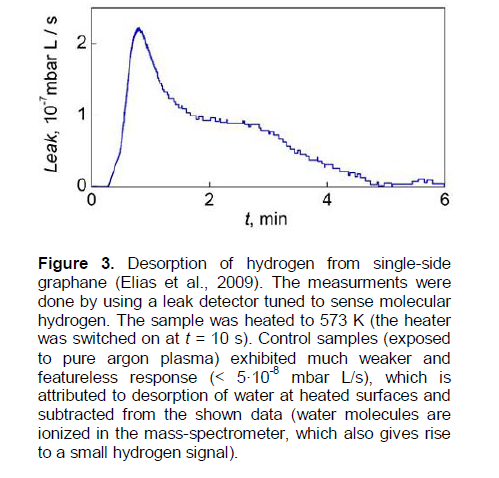
Openov and Podlivaev (2010) predicted that their results would not contradict the experimental data (Elias et al., 2009), according to which the nearly complete desorption of hydrogen (-ΔC/C0 ? 0.9, C/C0 » 0.1) from a free-standing graphane membrane (Figure 2B) was achieved by annealing it in argon at T = 723K for 24 h (that is, t0.9(membr. [5]) 723K = 8.6 × 10⁴ s). However, as the analysis presented below shows, this declaration (Openov and Podlivaev, 2010) is not enough adequate.
By using Equation (6), Openov and Podlivaev, 2010) evaluated the quantity of t0.01(graphane[4]) for T = 300K (~1×1024 s)and for T = 600K (~2 × 10³ s). However, they noted that the above two values of t0.01(graphane) should be considered as rough estimates. Indeed, using Equation 6, one can evaluate the value of t0.01(graphane[4])723K» 0.7 s for T = 723K, which is much less (by five orders) than the t0.9(membr.[5])723K value in Elias et al. (2009).
In the framework of the formal kinetics approximation in the first order rate reaction (Bazarov, 1976) a characteristic quantity for the reaction of hydrogen desorption is t0.63 - the time of the removal of ~ 63% of the initial hydrogen concentration C0 (that is, -ΔC/C0» 0.63, C/C0» 0.37) from the hydrogenated graphene. Such a first order rate reaction (desorption) can be described by the following equations (Nechaev, 2010; Nechaev and Veziroglu, 2013; Bazarov, 1976):
dC / dt = - KC, (7)
(C / C0) = exp (- Kt ) = exp (- t /t0.63), (8)
K = (1/t0.63) = K0 exp (-ΔHdes./ kB T ), (9)
Where C is the averaged concentration at the annealing time t, K = (1/t0.63) is the reaction (desorption) rate constant, ΔHdes.is the reaction (desorption) activation energy, and K0, the per-exponential (or frequency) factor of the reaction rate constant.
In the case of a diffusion rate limiting kinetics, the quantity of K0 is related to a solution of the corresponding diffusion problem (K0 ≈ D0 /L2, where D0 is the per-exponential factor of the diffusion coefficient, L is the characteristic diffusion length) (Nechaev, 2010; Nechaev and Veziroglu, 2013).
In the case of a non-diffusion rate limiting kinetics, which is obviously related to the situation of Openov and Podlivaev (2010) and Elias et al. (2009), the quantity of K0 may be the corresponding vibration (for (C-H) bonds) frequency (K0 = n(C-H)), the quantity ΔH(des.) = ΔH(C-H) (Table 1), and Equation (9) corresponds to Polanyi-Wigner (Nechaev, 2010; Nechaev and Veziroglu, 2013).
By substituting in Equation (8) the quantities of t = t0.01(graphane[4])723K and (C/C0) = 0.99, one can evaluate the desired quantity t0.63(graphane[4])723K» 70 s. Analogically, the quantity of t0.9(graphane[4])723K» 160 s can be evaluated, which is less by about three orders - than the experimental value (Elias et al., 2009) of t0.9(membr.[5])723K. In the same manner, one can evaluate the desired quantity t0.63(membr.[5])723K» 3.8 × 10⁴ s, which is higher (by about three orders) than t0.63(graphane[4])723K.
By using Equation (9) and supposing that ΔHdes.= Ea and K = 1/t0.63(graphane[4])723K, one can evaluate the analytical quantity of K0(graphane[4]) = 2 × 10¹⁵ s-1 for graphane of (Openov and Podlivaev, 2010) (Table 1A).
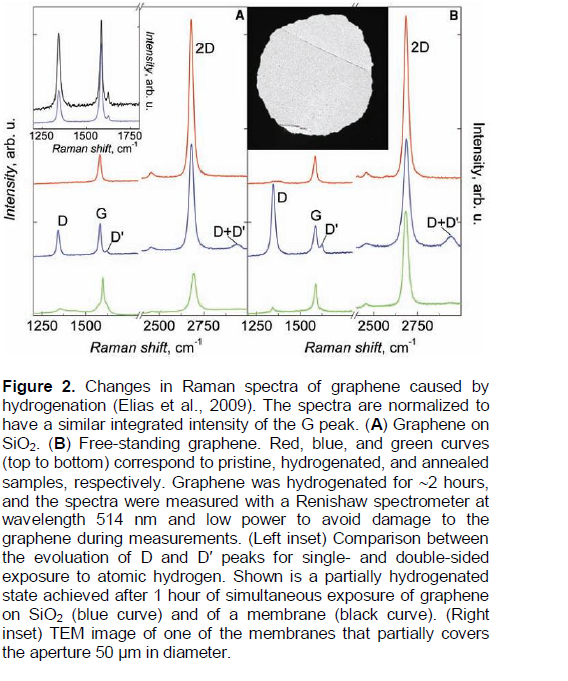
By substituting in Equation (9) the quantity of K = K(membr.[5])723K = 1/t0.63(membr.[5])723K and supposing that ΔHdes.(membr.[5]) » ?HC-H(graphane[3,4]) » 2.5 eV (Sofo et al., 2007; Nechaev and Veziroglu, 2013; Openov and Podlivaev, 2010) (Table 1A), one can evaluate the quantity of K0(membr.[5]) = n(membr.[5])» 7 × 10¹² s-1 for the experimental graphane membranes of Elias et al. (2009). The obtained quantity of n(membr.[5]) is less by one and a half orders of the vibrational frequency nRD = 2.5 × 10¹⁴ s-1, corresponding to the D Raman peak (1342 cm-1) for hydrogenated graphene membrane and epitaxial graphene on SiO2 (Figure 2). The activation of the D Raman peak in the hydrogenated samples authors (Elias et al., 2009) attribute to breaking of the translation symmetry of C-C sp2 bonds after formation of C-H sp3 bonds.
The quantity n(membr.[5]) is less by one order of the value (Xie et al., 2011) of the vibration frequency nHREELS = 8.7 × 10¹³ s-1 corresponding to an additional HREELS peak arising from C-H sp3 hybridization; a stretching appears at 369 meV after a partial hydrogenation of the epitaxial graphene. Xie et al. (2011) suppose that this peak can be assigned to the vertical C-H bonding, giving direct evidence for hydrogen attachment on the epitaxial graphene surface.
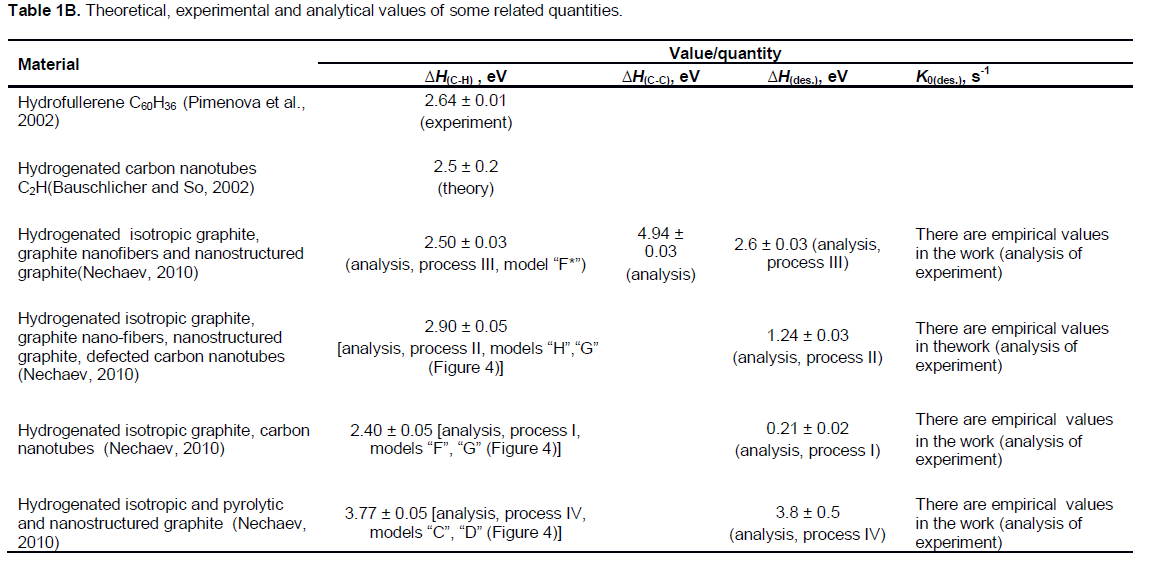
Taking into account nRD and nHREELS quantities, and substituting in Equation (9) quantities of K = 1/t0.63(membr.[5])723K and K0»K0(membr.[5])»nHREELS, one can evaluate ΔHdes.(membr.[5])= ?HC-H(membr.[5]) » 2.66 eV (Table 1A). In such approximation, the obtained value of ?HC-H(membr.[5]) coincides (within the errors) with the experimental value (Pimenova et al., 2002) of the breakdown energy of C-H bonds in hydrofullerene C60H36 (?HC-H(C60H36) = 2.64 ± 0.01 eV, Table 1B).
The above analysis of the related data shows that the experimental graphene membranes (hydrogenated up to the near-saturation) can be used. The following thermodesorption characteristics of the empirical character, relevant to Equation (9): ΔHdes.(membr.[5])= ?HC-H(membr.[5]) = 2.6 ± 0.1 eV, K0(membr.[5]) = nC-H(membr.[5])» 5 × 10¹³ s-1 (Table 1A). The analysis also shows that this is a case for a non-diffusion rate limiting kinetics, when Equation (9) corresponds to Polanyi-Wigner (Nechaev, 2010; Nechaev and Veziroglu, 2013). Certainly, these tentative results could be directly confirmed and/or modified by receiving and treating within Equations (8) and (9) of the experimental data on t0.63 at several annealing temperatures.
The above noted fact that the empirical (Elias et al., 2009; Nechaev and Veziroglu, 2013) quantity t0.63(membr.[5])723K is much larger (by about 3 orders), than the theoretical (Openov and Podlivaev, 2010; Nechaev and Veziroglu, 2013) one (t0.63(graphane[4])723K), is consistent with that mentioned in (Elias et al., 2009). The alternative possibility has been supposed in Elias et al., (2009) that (i) the experimental graphane membrane (a free-standing one) may have “a more complex hydrogen bonding, than the suggested by the theory”, and that (ii) graphane (CH) (Sofo et al., 2007) may be until now the theoretical material.
CONSIDERATION OF THE EXPERIMENTAL DATA ON HYDROGENATION-DEHYDROGENATION OF MONO- AND BI-LAYER EPITAXIAL GRAPHENES, AND COMPARING THE RELATED DATA FOR FREE-STANDING GRAPHENE
Characteristics of hydrogenation-dehydrogenation of mono-layer epitaxial graphenes
In Elias et al. (2009), both the graphene membrane samples considered above, and the epitaxial graphene and bi-graphene samples on substrate SiO2 were exposed to cold hydrogen DC plasma for 2 h to reach the saturation in the measured characteristics. They used a low-pressure (0.1 mbar) hydrogen-argon mixture of 10% H2. Raman spectra for hydrogenated and subsequently annealed free-standing graphene membranes (Figure 2B) are rather similar to those for epitaxial graphene samples (Figure 2A), but with some notable differences.
If hydrogenated simultaneously for 1 h, and before reaching the saturation (a partial hydrogenation), the D peak area for a free-standing membrane is two factors greater than the area for graphene on a substrate (Figure 2, the left inset). This indicates the formation of twice as many C-H sp3 bonds in the membrane. This result also agrees with the general expectation that atomic hydrogen attaches to both sides of the membranes. Moreover, the D peak area became up to about three times greater than the G peak area after prolonged exposures (for 2 h, a near-complete hydrogenation) of the membranes to atomic hydrogen.
The integrated intensity area of the D peak in Figure 2B corresponding to the adsorbed hydrogen saturation concentration in the graphene membranesis larger by a factor of about 3 for the area of the D peak in Figure 2A, corresponding to the hydrogen concentration in the epitaxial graphene samples.
The above noted Raman spectroscopy data (Elias et al., 2009) on dependence of the concentration (C) of adsorbed hydrogen from the hydrogenation time (t) (obviously, at about 300K) can be described with Equation (8) (Xiang et al., 2010; Bazarov, 1976). By using the above noted Raman spectroscopy data (Elias et al., 2009) (Figure 2), one can suppose that the near-saturation ((C/C0) ≈ 0.95) time (t0.95) for the free standing graphene membranes (at ~300K) is about 3 h, and a maximum possible (but not defined experimentally) value of C0(membr.) ≈ 0.5 (atomic fraction, that is, the atomic ratio (H/C) =1). Hence, using Equation (8)* results in the quantities of t0.63(membr.[5])hydr.300K ≈ 1.0 h, C3h(membr.[5]) ≈ 0.475, C2h(membr.[5]) ≈ 0.43 and C1h(membr.[5]) ≈ 0.32, where, C3h(membr.[5]), C2h(membr.[5]) and C1h(membr.[5]) being the adsorbed hydrogen concentration at the hydrogenation time (t) equal to 3, 2 and 1 h, respectively. It is expedient to note that the quantity of C0(membr.[5]) ≈ 0.5 corresponds to the local concentration of C0(membr.[5]one_side) ≈ 0.33 for each of the two sides of a membrane, that is, the local atomic ratio (H/C) = 0.50.
The evaluated value of t0.63(membr.[5])hydr.300K (for process of hydrogenation of the free standing graphene membranes (Elias et al., 2009) is much less (by about 26 orders) of the evaluated value of the similar quantity of t0.63(membr.[5])dehydr.300K ≈ (0.4 - 2.7) × 1026 h (if ?H(des.) = (2.49 - 2.61) eV, K0(des.) = (0.7 -5) × 1013 s-1, Table 1A) for process of dehydrogenation of the same free standing graphene membranes (Elias et al., 2009). This shows that the activation energy of the hydrogen adsorption (?H(ads.)) for the free standing graphene membranes (Elias et al., 2009) is considerably less than the activation energy of the hydrogen desorption (?H(des.) = (2.5 or 2.6) eV). Hence, by using Equation (9) and supposing that K0(ads.) ≈ K0(des.), one can obtain a reasonable value of ?H(ads.)membr.[5] = 1.0 ± 0.2 eV (Table 1). The heat of adsorption of atomic hydrogen by the free standing graphene membranes (Elias et al., 2009) may be evaluated as (Nechaev, 2010; Bazarov, 1976): (?H(ads.)membr.[5] - ?H(des.)membr.[5]) = -1.5 ± 0.2 eV (an exothermic reaction).
One can also suppose that the near-saturation ((C/C0) ≈ 0.95) time (t0.95) for the epitaxial graphene samples (at ~300K) is about 2 h. Hence, by using Equation 8 and the above noted data (Elias et al., 2009) on the relative concentrations [(C1h(membr.[5]) / C1h(epitax.[5])) ≈ 2, and ((C3h(membr.[5]) / C3h(epitax.[5])) ≈ 3], one can evaluate the quantities of t0.63(epitax.[5])hydr.300K ≈ 0.7 h and C0(epitax.[5]) ≈ 0.16. Obviously, C0(epitax.[5]) is related only for one of the two sides of an epitaxial graphene layer, and the local atomic ration is (H/C) ≈ 0.19. It is considerably less (about 2.6 times) of the above considered local atomic ratio (H/C) = 0.5 for each of two sides the free standing hydrogenated graphene membranes.
The obtained value of t0.63(epitax.[5])hydr.300K ≈ 0.7 h (for process of hydrogenation of the epitaxial graphene samples (Elias et al., 2009) is much less (by about two - seven orders) of the evaluated values of the similar quantity for the process of dehydrogenation of the same epitaxial graphene samples (Elias et al., 2009) (t0.63(epitax.[5])dehydr.300K ≈ (1.5 × 10² - 1.0 × 10⁷) h, for ?H(des.) = (0.3 - 0.9) eV and K0(des.) = (0.2 - 3.5 × 10⁴) s-1, Table 1A). Hence, by using Equation 9 and supposing that K0(ads.) ≈ K0(des.) (a rough approximation), one can obtain a reasonable value of ?H(ads.)epitax.[5] ≈ 0.3 ± 0.2 eV (Table 1A). The heat of adsorption of atomic hydrogen by the free standing graphene membranes (Elias et al., 2009) may be evaluated as (Nechaev, 2010; Bazarov, 1976): (?H(ads.)epitax.[5] - ?H(des.)epitax.[5]) = -0.3 ± 0.2 eV (an exothermic reaction).
The smaller values of C0(epitax.[5]) ≈ 0.16 and (H/C)(epitax.[5]) ≈ 0.19 (in comparison with C0(membr.[5]one_side) ≈ 0.33 and (H/C)(membr.[5]one_side) ≈ 0.50) may point to a partial hydrogenation localized in some defected nanoregions (Brito et al., 2011; Zhang et al., 2014; Banhart et al., 2011; Yazyev and Louie, 2010; Kim et al., 2011; Koepke et al., 2013; Zhang and Zhao, 2013; Yakobson and Ding, 2011; Cockayne et al., 2011; Zhang et al., 2012; Eckmann et al., 2012) for the epitaxial graphene samples (even after their prolonged (3 h) exposures, that is, after reaching their near-saturation. Similar analytical results, relevance to some other epitaxial graphenes are also presented.
Characteristics of dehydrogenation of mono-layer epitaxial graphenes
According to a private communication from D.C. Elias,a near-complete desorption of hydrogen (-ΔC/C0 » 0.95) from a hydrogenated epitaxial graphene on a substrate SiO2 (Figure 2A) has been achieved by annealing it in 90% Ar/10% H2 mixture at T = 573K for 2 h (that is, t0.95(epitax.[5])573K = 7.2 × 10³ s). Hence, by using Equation 8, one can evaluate the value of t0.63(epitax.[5])573K = 2.4 × 10³ s for the epitaxial graphene (Elias et al., 2009), which is about six orders less than the evaluated value of t0.63(membr.[5])573K = 1.5 × 10⁹ s for the free-standing membranes (Elias et al., 2009).
The changes in Raman spectra of graphene (Elias et al., 2009) caused by hydrogenation were rather similar in respect to locations of D, G, D′, 2D and (D+D′) peaks, both for the epitaxial graphene on SiO2 and for the free-standing graphene membrane (Figure 2). Hence, one can suppose that K0(epitax.[5]) = nC-H(epitax.[5])»K0(membr.[5]) = nC-H(membr.[5])» (0.7 or 5) × 1013 s-1 (Table 1A). Then, by substituting in Equation 9 the values of K = K(epitax.[5])573K = 1/t0.63(epitax.[5])573K and K0»K0(epitax.[5])»K0(membr.[5]), one can evaluate ΔHdes.(epitax.[5])= ?HC-H(epitax.[5]) » (1.84 or 1.94) eV (Table 1A). Here, the case is supposed of a non-diffusion-rate-limiting kinetics, when Equation 9 corresponds to thePolanyi-Wigner one (Nechaev, 2010). Certainly, these tentative thermodynamic characteristics of the hydrogenated epitaxial graphene on a substrate SiO2 could be directly confirmed and/or modified by further experimental data on t0.63(epitax.) at various annealing temperatures.
It is easy to show that: 1) these analytical results (for the epitaxial graphene (Elias et al., 2009) are not consistent with the presented below analytical results for the mass spectrometry data (Figure 3, TDS peaks ## 1-3, Table 1A) on TDS of hydrogen from a specially prepared single-side (obviously, epitaxial*) graphane (Elias et al., 2009); and 2) they cannot be described in the framework of the theoretical models and characteristics of thermal stability of SSHG (Openov and Podlivaev, 2012) or graphone (Podlivaev and Openov, 2011).
According to further consideration presented below (both here and subsequently), the epitaxial graphene case (Elias et al., 2009) may be related to a hydrogen desorption case of a diffusion rate limiting kinetics, when K0¹n, and Equation (9) does not correspond to the Polanyi-Wigner one (Nechaev, 2010).
By using the method of Nechaev, (2010) of treatment from the TDS spectra, relevant to the mass spectrometry data (Elias et al., 2009) (Figure 3) on TDS of hydrogen from the specially prepared single-side (epitaxial*) graphane (under heating from room temperature to 573K for 6 min), one can obtain the following tentative results:
(1) The total integrated area of the TDS spectra corresponds to ~10-8 g of desorbed hydrogen that may correlate with the graphene layer mass (unfortunately, it’s not considered in Elias et al. (2009), particularly, for evaluation of the C0 quantities);
(2) The TDS spectra can be approximated by three thermodesorption (TDS) peaks (# # 1-3);
(3) TDS peak # 1 (~30 % of the total area, Tmax#1 » 370 K) can be characterized by the activation energy of ?H(des.) = ETDS-peak # 1= 0.6 ± 0.3 eV and by the per-exponential factor of the reaction rate constant K0(TDS-peak #1)» 2×10⁷ s-1;
(4) TDS peak # 2 (~15% of the total area, Tmax#2 » 445K) can be characterized by the activation energy ?H(des.) = ETDS-peak #2 = 0.6 ± 0.3 eV, and by the per-exponential factor of the reaction rate constant K0(TDS-peak #2)» 1 × 10⁶ s-1;
(5) TDS peak # 3 (~55% of the total area, Tmax#3 » 540K) can be characterized by the activation energy ?H(des.) = ETDS-peak #3 = 0.23 ± 0.05 eV and by the per-exponential factor of the reaction rate constant K0(TDS-peak #3)» 2.4 s-1.
These analytical results (on quantities of ?H(des.) and K0) show that all three of the above noted TDS processes (#1TDS, #2TDS and #3TDS) can not been described in the framework of the Polanyi-Wigner equation (Nechaev, 2010; Nechaev and Veziroglu, 2013) (due to the obtained low values of the K0(des.) and ?H(des.) quantities, in comparison with the n(C-H) and ΔH(C-H) ones).
As shown below, these results may be related to a hydrogen desorption case of a diffusion-rate-limiting kinetics (Nechaev, 2010; Nechaev and Veziroglu, 2013), when in Equation (9) the value of K0»D0app. / L2 and the value of ΔHdes.= Qapp., where D0app is the per-exponent factor of the apparent diffusion coefficient Dapp. = D0app.exp (-Qapp./kBT), Qapp. is the apparent diffusion activation energy, and L is the characteristic diffusion size (length), which (as shown below) may correlate with the sample diameter (Elias et al., 2009) (L ~ dsample ≈ 4 × 10⁻³ cm, Figure 2, Right inset).
TDS process (or peak) #3TDS (Figure 3, Table 1A) may be related to the diffusion-rate-limiting TDS process (or peak) I in (Nechaev, 2010), for which the apparent diffusion activation energy is Qapp.I» 0.2 eV »ETDS-peak#3 and D0app.I» 3 × 10⁻³ cm2/s, and which is related to chemisorption models “F” and/or “G” (Figure 4).
By supposing of L ~ dsample, that is, of the order of diameter of the epitaxial graphene specimens (Elias et al., 2009), one can evaluate the quantity of D0app.(TDS-peak#3) »L2 ? K0(TDS-peak#3)» 4 × 10⁻⁵ cm (or within the errors limit, it is of (1.3 - 11) × 10-5 cm, for ETDS-peak #3 values 0.18 - 0.28 eV, Table 1A). The obtained values of D0app.(TDS-peak#3) satisfactory (within one-two orders, that may be within the errors limit) correlate with the D0app.I quantity. Thus, the above analysis shows that for TDS process (or peak) # 3TDS (Elias et al., 2009), the quantity of L may be of the order of diameter (dsample) of the epitaxial* graphene samples.
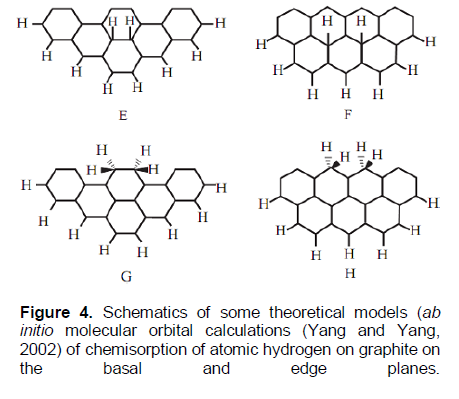
Within approach (Nechaev, 2010), model “F” (Figure 4) is related to a “dissociative-associative” chemisorption of molecular hydrogen on free surfaces of graphene layers of the epitaxial samples (Elias et al., 2009). Model “G” (Figure 4) is related, within (Nechaev, 2010) approach, to a “dissociative-associative” chemisorption of molecular hydrogen on definite defects in graphene layers of the epitaxial samples (Elias et al., 2009), for instance, vacancies, grain boundaries (domains) and/or triple junctions (nodes) of the grain-boundary network (Brito et al., 2011; Zhang et al., 2014; Banhart et al., 2011; Yazyev and Louie, 2010; Kim et al., 2011; Koepke et al., 2013; Zhang and Zhao, 2013; Yakobson and Ding, 2011; Cockayne et al., 2011; Zhang et al., 2012; Eckmann et al., 2012), where the dangling carbon bonds can occur.
TDS processes (or peaks) #1TDS and #2TDS (Elias et al., 2009) (Table 1A) may be (in some extent) related to the diffusion-rate-limiting TDS processes (or peaks) I and II in (Nechaev, 2010).
Process II is characterized by the apparent diffusion activation energy Qapp.II» 1.2 eV (that is considerably higher of quantities of ETDS-peak#1 and ETDS-peak#2) andD0app.II» 1.8×103 cm2/s. It is related to chemisorption model “H” (Figure 4). Within approach (Nechaev, 2010), model “H” is related (as and model “G”) to a “dissociative - associative” chemisorption of molecular hydrogen on definite defects in graphene layers of the epitaxial samples (Elias et al., 2009), for instance, vacancies, grain boundaries (domains) and/or triple junctions (nodes) of the grain-boundary network noted above, where the dangling carbon bonds can occur.
By supposing the possible values of ETDS-peaks##1,2 = 0.3, 0.6 or 0.9 eV, one can evaluate the quantities of K0(TDS-peak#1) and K0(TDS-peak#2) (Table 1A). Hence, by supposing of L ~ dsample, one can evaluate the quantities of D0app.(TDS-peak#1) and D0app.(TDS-peak#2), some of them correlatewith the D0app.I quantity or with D0app.II quantity. It shows that for TDS processes (or peaks) #1TDS and #2TDS (Elias et al., 2009), the quantity of L may be of the order of diameter of the epitaxial* graphene samples.
For the epitaxial graphene (Elias et al., 2009) case, supposing the values of ΔHdes.(epitax.[5])» 0.3, 0.6 or 0.9 eV results in relevant values of K0(epitax.[5]) (Table 1A). Hence, by supposing of L ~ dsample, one can evaluate the quantities of D0app.(epitax.[5]), some of them correlate with the D0app.I quantity or with D0app.II quantity. It shows that for these two processes, the quantity of L also may be of the order of diameter of the epitaxial graphene samples (Elias et al., 2009).
It is important to note that chemisorption of atomic hydrogen with free-standing graphane-like membranes (Elias et al., 2009) and with the theoretical graphanes may be related to model “F*” considered in (Nechaev, 2010). Unlike model “F” (Figure 4), where two hydrogen atoms are adsorbed by two alternated carbon atoms in a graphene-like network, in model “F*” a single hydrogen atom is adsorbed by one of the carbon atoms (in the graphene-like network) possessing of 3 unoccupied (by hydrogen) nearest carbons. Model “F*” is characterized (Nechaev, 2010) by the quantity of ?H(C-H)”F*” » 2.5 eV, which coincides (within the errors) with the similar quantities (?H(C-H)) for graphanes (Table 1A). As also shown in the previous paper parts, the dehydrogenation processes in graphanes (Elias et al., 2009; Openov and Podlivaev, 2010) may be the case of a non-diffusion rate limiting kinetics, for which the quantity of K0 is the corresponding vibration frequency (K0 = n), and Equation (9) is correspond to the Polanyi-Wigner one.
On the other hand, model “F*” is manifested in the diffusion-rate-limiting TDS process (or peak) III in (Nechaev, 2010) (Table 1B), for which the apparent diffusion activation energy is Qapp.III» 2.6 eV » ?H(C-H)”F*” and D0app.III» 3 × 10⁻³ cm2/s. Process III is relevant to a dissociative chemisorption of molecular hydrogen between graphene-like layers in graphite materials (isotropic graphite and nanostructured one) and nanomaterials – GNFs (Nechaev, 2010) (Table 1B).
It is expedient also to note about models “C” and “D”, those manifested in the diffusion-rate-limiting TDS process (or peak) IV in (Nechaev, 2010) (Table 1B), for which the apparent diffusion activation energy is Qapp.IV» 3.8 eV » ?H(C-H)”C”,”D” and D0app.IV» 6 × 102 cm2/s. Process IV is relevant to a dissociative chemisorption of molecular hydrogen in defected regions in graphite materials (isotropic graphite, pyrolytic graphane and nanostructured one) (Nechaev, 2010) (Table 1B).
But such processes (III and IV) have not manifested, when the TDS annealing of the hydrogenated epitaxial graphene samples (Elias et al., 2009) (Figure 3), unlike some hydrogen sorption processes in epitaxial graphenes and graphite samples considered in some next parts of this paper.
An interpretation of characteristics of hydrogenation-dehydrogenation of mono-layer epitaxial graphenes
The above obtained values (Table 1A and B) of characteristics of dehydrogenation of mono-layer epitaxial graphene samples (Elias et al., 2009) can be presented as follows: ΔHdes. ~ Qapp.I or ~ Qapp.II (Nechaev, 2010), K0(des.) ~ (D0app.I / L2) or ~ (D0app.II / L2) (Nechaev, 2010), L ~ dsample, that is, being of the order of diameter of the epitaxial graphene samples. And it is related to the chemisorption models “F”, “G” and/or “H” (Figure 4).
These characteristics unambiguously point that in the epitaxial graphene samples (Elias et al., 2009), there are the rate-limiting processes (types of I and/or II (Nechaev, 2010) of diffusion of hydrogen, mainly, from chemisorption “centers” [of “F”, “G” and/or “H” types (Figure 4)] localized on the internal graphene surfaces (and/or in the graphene/substrate interfaces) to the frontier edges of the samples. It corresponds to the characteristic diffusion length (L~ dsample) of the order of diameter of the epitaxial graphene samples, which, obviously, cannot be manifested for a case of hydrogen desorption processes from the external graphene surfaces. Such interpretation is direct opposite, relevance to the interpretation of Elias et al. (2009) and a number of others, those probably believe in occurrence of hydrogen desorption processes, mainly, from the external epitaxial graphene surfaces. Such different (in some sense, extraordinary) interpretation is consisted with the above analytical data (Table 1A) on activation energies of hydrogen adsorption for the epitaxial graphene samples (?H(ads.)epitax.[5] ≈ 0.3 ± 0.2 eV), which is much less than the similar one for the free standing graphene membranes (Elias et al., 2009) (?H(ads.)membr.[5] = 1.0 ± 0.2 eV). It may be understood for the case of chemisorotion [of “F”, “G” and/or “H” types (Figure 4)] on the internal graphene surfaces [neighboring to the substrate (SiO2) surfaces], which obviously proceeds without the diamond-like strong distortion of the graphene network, unlike graphene (Sofo et al., 2007).
Such an extraordinary interpretation is also consisted with the above analytical results about the smaller values of C0(epitax.[5]) ≈ 0.16 and (H/C)(epitax.[5]) ≈ 0.19, in comparison with C0(membr.[5]one_side) ≈ 0.33 and (H/C)(membr.[5]one_side) ≈ 0.50. It may point to an “internal” (in the above considered sense) local hydrogenation in the epitaxial graphene layers. It may be, for instance, an “internal” hydrogenation localized, mainly, in some defected nanoregions (Brito et al., 2011; Zhang et al., 2014; Banhart et al., 2011; Yazyev and Louie, 2010; Kim et al., 2011; Koepke et al., 2013; Zhang and Zhao, 2013; Yakobson and Ding, 2011; Cockayne et al., 2011; Zhang et al., 2012; Eckmann et al., 2012), where their near-saturation may be reached after prolonged (3 h) exposures.
On the basis of the above analytical results, one can suppose that a negligible hydrogen adsorption by the external graphene surfaces (in the epitaxial samples of Elias et al., 2009) is exhibited. Such situation may be due to a much higher rigidity of the epitaxial graphenes (in comparison with the free standing graphene membranes), that may suppress the diamond-like strong distortion of the graphene network attributed for graphene of Sofo et al. (2007). It may result (for the epitaxial graphenes of Elias et al. (2009) in disappearance of the hydrogen chemisorption with characteristics of ?H(ads.)membr.[5] and ?H(des.)membr.[5] (Table 1A) manifested in the case of the free standing graphene membranes of Elias et al. (2009). And the hydrogen chemisorption with characteristics of ?H(ads.)epitax.[5] and (?H(des.)epitax.[5] (Table 1A) by the external graphene surfaces, in the epitaxial samples of Elias et al. (2009), is not observed, may be, due to a very fast desorption kinetics, unlike the kinetics in the case of the internal graphene surfaces.
Certainly, such an extraordinary interpretation also needs in a reasonable explanation of results (Figure 2) the fact that the changes in Raman spectra of graphene of Elias et al. (2009) caused by hydrogenation were rather similar with respect to locations of D, G, D′, 2D and (D+D′) peaks, both for the epitaxial graphene on SiO2 and for the free-standing graphene membrane.
An interpretation of the data on hydrogenation of bi-layer epitaxial graphenes
In Elias et al. (2009), the same hydrogenation procedures of the 2 h long expositions have been applied also for bi-layer epitaxial graphene on SiO2/Si wafer. Bi-layer samples showed little change in their charge carrier mobility and a small D Raman peak, compared to the single-layer epitaxial graphene on SiO2/Si wafer exposed to the same hydrogenation procedures. Elias et al. (2009) believe that higher rigidity of bi-layers suppressed their rippling, thus reducing the probability of hydrogen adsorption.
But such an interpretation (Elias et al., 2009) does not seem adequate, in order to take into account the above, and below (next parts of this paper) the presented consideration and interpretation of a number of data.
By using the above extraordinary interpretation, and results on characteristics (Qapp.III» 2.6 eV, D0app.III» 3 × 10⁻³ cm2/s (Table 1B) of a rather slow diffusion of atomic hydrogen between neighboring graphene-like layers in graphitic materials and nanostructures (process III, model “F*” (Nechaev, 2010), one can suppose a negligible diffusion penetration of atomic hydrogen between the two graphene layers in the bi-layer epitaxial samples of Elias et al. (2009) (during the hydrogenation procedures of the 2 h long expositions, obviously, at T» 300K). Indeed, by using values of Qapp.III andD0app.III, one can estimate the characteristic diffusion size (length) L ~ 7 × 10-22 cm, which points to absence of such diffusion penetration.
In the next next parts of this study, a further consideration of some other known experimental data on hydrogenation and thermal stability characteristics of mono-layer, bi-layer and three-layer epitaxial graphene systems is given, where (as shown) an important role plays some defects found in graphene networks (Brito et al., 2011; Zhang et al., 2014; Banhart et al., 2011; Yazyev and Louie, 2010; Kim et al., 2011; Koepke et al., 2013; Zhang and Zhao, 2013; Yakobson and Ding, 2011; Cockayne et al., 2011; Zhang et al., 2012; Eckmann et al., 2012), relevant to the probability of hydrogen adsorption and the permeability of graphene networks for atomic hydrogen.
CONSIDERATION AND INTERPRETATION OF THE RAMAN SPECTROSCOPY DATA ON HYDROGENATION-DEHYDROGENATION OF
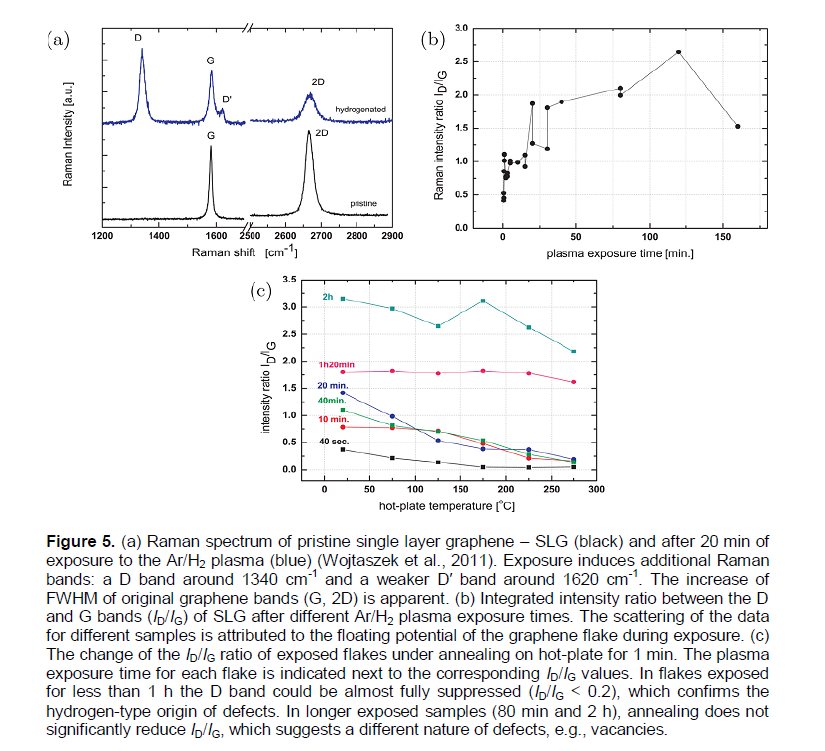
In Wojtaszek et al. (2011), it is reported that the hydrogenation of single and bilayer graphene flakes by an argon-hydrogen plasma produced a reactive ion etching (RIE) system. They analyzed two cases: One where the graphene flakes were electrically insulated from the chamber electrodes by the SiO2 substrate, and the other where the flakes were in electrical contact with the source electrode (a graphene device). Electronic transport measurements in combination with Raman spectroscopy were used to link the electric mean free path to the optically extracted defect concentration, which is related to the defect distance (Ldef.). This showed that under the chosen plasma conditions, the process does not introduce considerable damage to the graphene sheet, and that a rather partial hydrogenation (CH ≤ 0.05%) occurs primarily due to the hydrogen ions from the plasma, and not due to fragmentation of water adsorbates on the graphene surface by highly accelerated plasma electrons. To quantify the level of hydrogenation, they used the integrated intensity ratio (ID/IG) of Raman bands. The hydrogen coverage (CH) determined from the defect distance (Ldef.) did not exceed ~ 0.05%.
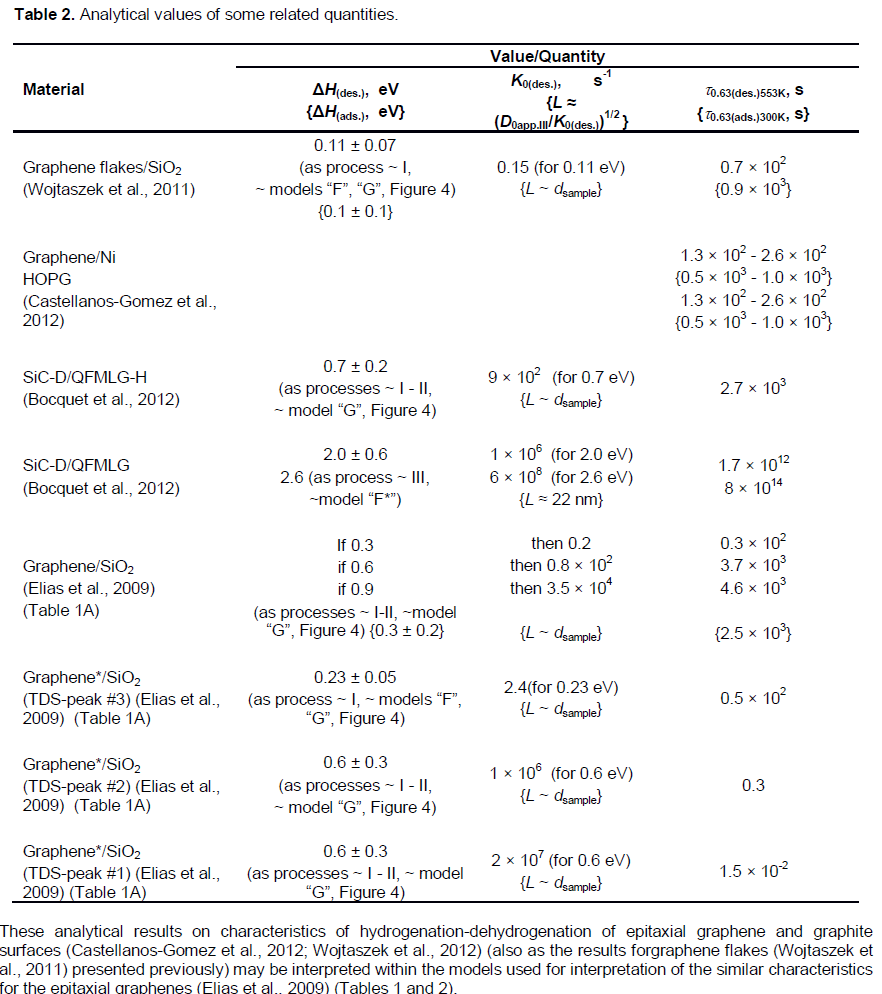
In Nechaev and Veziroglu (2013), the data (Wojtaszek et al., 2011) (Figure 5) has been treated and analyzed. The obtained analytical results (Table 2) on characteristics of hydrogenation-dehydrogenation of graphene flakes (Wojtaszek et al., 2011) may be interpreted within the models used for interpretation of the similar characteristics for the epitaxial graphenes of Elias et al. (2009) (Table 1A), which are also presented (for comparing) in Table 2.
By taking into account the fact that the RIE exposure regime (Wojtaszek et al., 2011) is characterized by a form of (ID/IG) ~ Ldef.-2 (for (ID/IG) < 2.5), Ldef.» 11 - 17 nm and the hydrogen concentration CH ≤ 5 × 10⁴, one can suppose that the hydrogen adsorption centers in the single graphene flakes (on the SiO2 substrate) are related in some point, nanodefects (that is, vacancies and/or triple junctions (nodes) of the grain-boundary network) of diameter ddef. » const. In such a model, the quantity CH can be described satisfactory as:
CH »nH (ddef.)2 / (Ldef.)2, (10)
Where nH» const. is the number of hydrogen atoms adsorbed by a center; CH ~ (ID/IG) ~ Ldef.-2.
It was also found (Wojtaszek et al., 2011) that after the Ar/H2 plasma exposure, the (ID/IG) ratio for bi-layer graphene device is larger than that of the single graphene device. As noted in (Wojtaszek et al. (2011), this observation is in contradiction to the Raman ratios after exposure of graphene to atomic hydrogen and when other defects are introduced. Such a situation may have place in Elias et al. (2009) for bi-layer epitaxial graphene on SiO2/Si wafer.
In Castellanos-Gomez (2012) and Wojtaszek et al. (2012), the effect of hydrogenation on topography and electronic properties of graphene grown by CVD on top of a nickel surface and HOPG surfaces were studied by scanning tunneling microscopy (STM) and scanning tunneling spectroscopy (STS). The surfaces were chemically modified using 40 min Ar/H2 plasma (with 3 W power) treatment (Figure 6) average an energy band gap of 0.4 eV around the Fermi level. Although the plasma treatment modifies the surface topography in an irreversible way, the change in the electronic properties can be reversed by moderate thermal annealing (for 10 min at 553K), and the samples can be hydrogenated again to yield a similar, but slightly reduced, semiconducting behavior after the second hydrogenation.
The data (Figure 6) show that the time of desorption from both the epitaxial graphene/Ni samples and HOPG samples of about 90 to 99% of hydrogen under 553K annealing is t0.9(des.)553K (or t0.99(des.)553K) » 6 × 10² s. Hence, by using Equation (8), one can evaluate the quantity t0.63(des.)553K[52]» 260 (or 130) s, which is close (within the errors) to the similar quantity of t0.63(des.)553K[51]» 70 s for the epitaxial graphene flakes (Wojtaszek et al., 2011) (Table 2).
The data (Figure 6) also show that the time of adsorption (for both the epitaxial graphene/Ni samples and HOPG samples) of about 90 to 99% of the saturation hydrogen amount (under charging at about 300K) is t0.9(ads.)300K (or t0.99(ads.)300K) » 2.4 × 10³ s. Hence, by using Equation (8)*, one can evaluate the quantity t0.63(ads.)300K[52]» (1.1 or 0.5) × 102 s, which coincides (within the errors) with the similar quantity of t0.63(ads.)300K[51]» 9 × 10² s for the epitaxial graphene flakes (Wojtaszek et al., 2011) (Table 2).
The data (Figure 6) also show that the time of adsorption (for both the epitaxial graphene/Ni samples and HOPG samples) of about 90 - 99% of the saturation hydrogen amount (under charging at about 300K) is t0.9(ads.)300K (or t0.99(ads.)300K) » 2.4 × 10³ s. Hence, by using Equation (8)*, one can evaluate the quantity t0.63(ads.)300K[52]» (1.1 or 0.5) × 102 s, which coincides (within the errors) with the similar quantity oft0.63(ads.)300K[51]» 9 × 10² s for the epitaxial graphene
As noted in Castellanos-Gomes et al. (2012) and Arramel et al. (2012), before the plasma treatment, the CVD graphene exhibits a Moiré pattern superimposed to the honeycomb lattice of graphene (Figure 6d). This is due to the lattice parameter mismatch between the graphene and the nickel surfaces, and thus the characteristics of the most of the epitaxial graphene samples. On the other hand, as is also noted in Castellanos-Gomes et al. (2012) and Arramel et al., 2012), for the hydrogenated CVD graphene, the expected structural changes are twofold. First, the chemisorption of hydrogen atoms will change the sp2 hybridization of carbon atoms to tetragonal sp3 hybridization, modifying the surface geometry. Second, the impact of heavy Ar ions, present in the plasma, could also modify the surface by inducing geometrical displacement of carbon atoms (rippling graphene surface) or creating vacancies and other defects (for instance, grain or domain boundaries (Brito et al., 2011; Zhang et al., 2014; Banhart et al., 2011; Yazyev and Louie, 2010; Kim et al., 2011; Koepke et al., 2013; Zhang and Zhao, 2013; Yakobson and Ding, 2011; Cockayne et al., 2011; Zhang et al., 2012; Eckmann et al., 2012). Figure 6e shows the topography image of the surface CVD graphene after the extended (40 min) plasma treatment. The nano-order-corrugation increases after the treatment, and there are brighter nano-regions (of about 1 nm in height and several nm in diameter) in which the atomic resolution is lost or strongly distorted. It was also found (Castellanos-Gomez, Wojtaszek et al., 2012; Castellanos-Gomes, Arramel et al., 2012) that these bright nano-regions present a semiconducting behavior, while the rest of the surface remains conducting (Figure 6g to h).
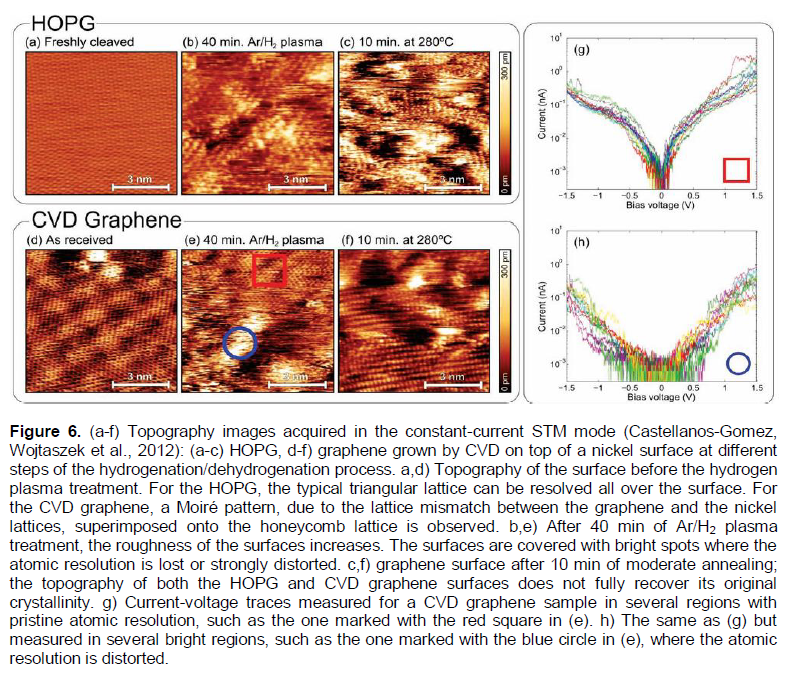
It is reasonable to assume that most of the chemisorbed hydrogen is localized into these bright nano-regions, which have a blister-like form. Moreover, it is also reasonable to assume that the monolayer (single) graphene flakes on the Ni substrate are permeable to atomic hydrogen only in these defected nano-regions. This problem has been formulated in Introduction. A similar model may be valid and relevant for the HOPG samples (Figure 6a to c).
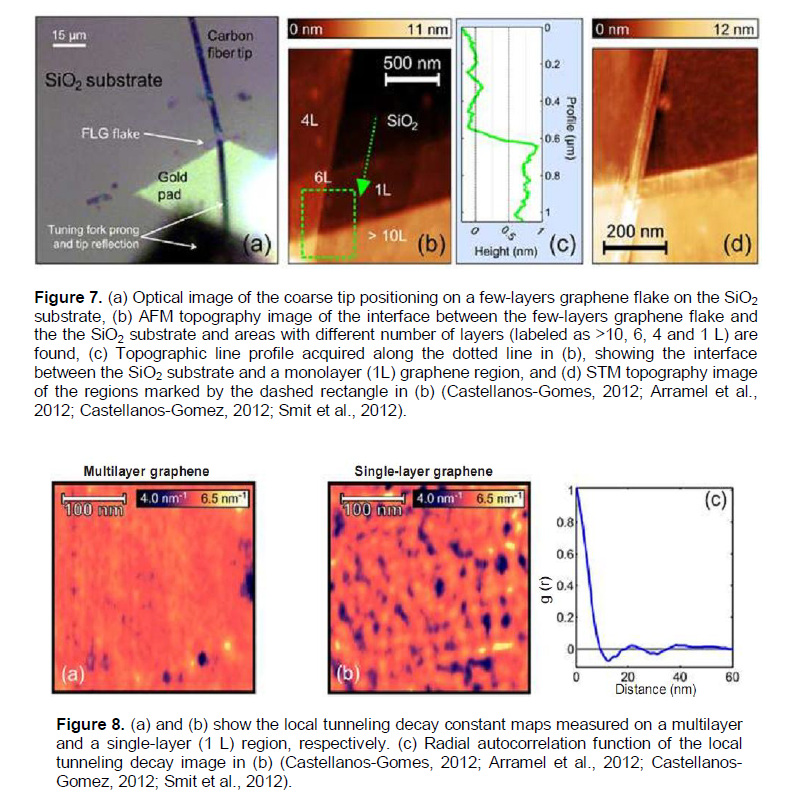
It has been found out that when graphene is deposited on a SiO2 surface (Figures 7 and 8) the charged impurities presented in the graphene/substrate interface produce strong inhomogeneities of the electronic properties of graphene.On the other hand, it has also been shown how homogeneous graphene grown by CVD can be altered by chemical modification of its surface by the chemisoption of hydrogen. It strongly depresses the local conductance at low biases, indicating the opening of a band gap in graphene (Castellanos-Gomes, Arramel et al., 2012; Castellanos-Gomez, Smit et al., 2012).
The charge inhomogeneities (defects) of epitaxial hydrogenated graphene/SiO2 samples do not show long range ordering, and the mean spacing between them is Ldef.» 20 nm (Figure 8). It is reasonable to assume that the charge inhomogeneities (defects) are located at the interface between the SiO2 layer (300 nm thick) and the graphene flake (Castellanos-Gomes, 2012; Arramel et al., 2012; Smit et al., 2012). A similar quantity[Ldef.» 11 - 17 nm, (Wojtaszek et al., 2011) for the hydrogen adsorption centers in the monolayer graphene flakes on the SiO2 substrate has been above considered.
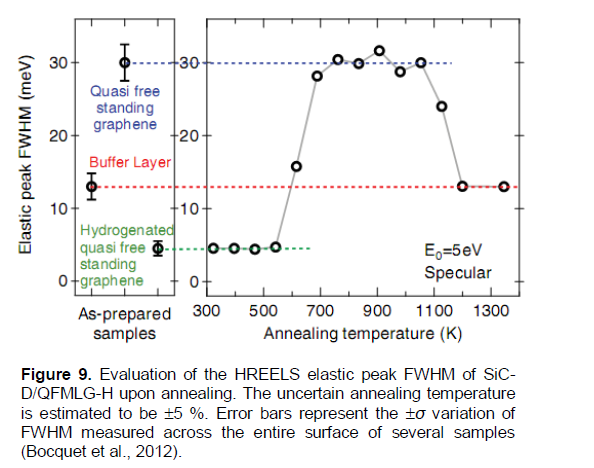
In Bocquet et al. (2012), hydrogenation of deuterium-intercalated quasi-free-standing monolayer graphene on SiC(0001) was obtained and studied with LEED and HREELS. While the carbon honeycomb structure remained intact, it has shown a significant band gap opening in the hydrogenated material. Vibrational spectroscopy evidences for hydrogen chemisorption on the quasi-free-standing graphene has been provided and its thermal stability has been studied (Figure 9). Deuterium intercalation, transforming the buffer layer in quasi-free-standing monolayer graphene (denoted as SiC-D/QFMLG), has been performed with a D atom exposure of ~5 × 1017 cm-2 at a surface temperature of 950K. Finally, hydrogenation up to saturation of quasi-free-standing monolayer graphene has been performed at room temperature with H atom exposure > 3 × 1015 cm-2. The latter sample has been denoted as SiC-D/QFMLG-H to stress the different isotopes used.
According to a private communication from R. Bisson, the temperature indicated at each point in Figure 9 corresponds to successive temperature ramp (not linear) of 5 min. Within a formal kinetics approach for the first order reactions (Nechaev, 2010; Bazarov, 1976), one can treat the above noted points at Ti = 543, 611 and 686 K, by using Equation (8) transformed to a more suitable form (8′): Ki» -(ln(C/C0i)/t), where t = 300 s, and the corresponding quantities C0i and C are determined from Figure 9. It resulted in finding values of the reaction (hydrogen desorption from SiC-D/QFMLG-H samples) rate constant Ki(des.) for 3 temperatures: Ti = 543, 611 and 686K. The temperature dependence is described by Equation (9). Hence, the desired quantities have been determined (Table 2) as the reaction (hydrogen desorption) activation energy ΔH(des.)(SiC-D/QFMLG-H)[55]= 0.7 ± 0.2 eV, and the per-exponential factor of the reaction rate constant K0(des.)(SiC-D/QFMLG-H)[55]» 9 × 10² s-1. The obtained value of ΔH(des.)(SiC-D/QFMLG-H)[55] is close (within the errors) to the similar ones (ETDS-peak #1[5] and ETDS-peak # 2[5]) for TDS processes #1 and #2 (Table 1A). But the obtained value K0des.(SiC-D/QFMLG-H)[55] differs by several orders from the similar ones (K0des.(TDS-peak #1)[5] and K0des.(TDS-peak #2)[5]) for TDS processes #1 and #2 (Table 1A). Nevertheless, these three desorption processes may be related to chemisorption models “H” and/or “G” (Figure 4).
These analytical results on characteristics of hydrogen desorption (dehydrogenation) from (of) SiC-D/QFMLG-H samples (Bocquet et al., 2012) may be also (as the previous results) interpreted within the models used for interpretation of the similar characteristics for the epitaxial graphenes (Elias et al., 2009) (Tables 1A and 2).
In the same way, one can treat the points from Figure 9 (at Ti = 1010, 1120 and 1200 K), which are related to the intercalated deuterium desorption from SiC-D/QFMLG samples. This results in finding the desired quantities (Table 2): the reaction (deuterium desorption) activation energy ΔH(des.)(SiC-D/QFMLG)[55]= 2.0 ± 0.6 eV, and the per-exponential factor of the reaction rate constant K0(des.)(SiC-D/QFMLG)[55]» 1 × 10⁶ s-1.
Such a relatively low (in comparison with the vibration C-H or C-D frequencies) value of K0(des.)(SiC-D/QFMLG)[55], points out that the process cannot be described within the Polanyi-Wigner model (Nechaev, 2010; Nechaev and Veziroglu, 2013), related to the case of a non-diffusion rate limiting kinetics.
And as concluded in Bocquet et al. (2012), the exact intercalation mechanism of hydrogen diffusion through the anchored graphene lattice, at a defect or at a boundary of the anchored graphene layer, remains an open question.
Formally, this desorption process (obviously, of a diffusion-limiting character) may be described (as shown below) similarly to TDS process III (model “F*”) (Table 1B), and the apparent diffusion activation energy may be close to the break-down energies of the C-H bonds.
Obviously such analytical results on characteristics of deuterium desorption from SiC-D/QFMLG samples (Bocquet et al., 2012) may not be interpreted within the models used for interpretation of the similar characteristics for the epitaxial graphenes (Elias et al., 2009) (Tables 1A and 2).
But these results (for SiC-D/QFMLG samples of Bocquet et al. (2012) may be quantitatively interpreted on the basis of using the characteristics of process III (Table 1B). Indeed, by using the quantities’ values (from Table 1) of ΔH(des.)(SiC-D/QFMLG)[55]»Qapp.III» 2.6 eV, K0(des.)(SiC-D/QFMLG)[55]» 6 × 10⁸ s-1 and D0app.III » 3 × 10⁻³ cm2/s, one can evaluate the quantity of L » (D0app.III / K0(des.))1/2 = 22 nm. The obtained value of L coincides (within the errors) with values of the quantities of Ldef.» 11 - 17 nm [Equation (10)] and Ldef.» 20 nm (Figure 8b). It shows that in the case under consideration, the intercalation mechanism of hydrogen (deuterium) diffusion through the anchored graphene lattice at the corresponding point type defects (Brito et al., 2011; Zhang et al., 2014; Banhart et al., 2011; Yazyev and Louie, 2010; Kim et al., 2011; Koepke et al., 2013; Zhang and Zhao, 2013; Yakobson and Ding, 2011; Cockayne et al., 2011; Zhang et al., 2012; Eckmann et al., 2012), of the anchored graphene layer may have place. And the desorption process of the intercalated deuterium may be rate-limited by diffusion of deuterium atoms to a nearest one of such point type defects of the anchored graphene layer.
It is reasonable to assume that the quasi-free-standing monolayer graphene on the SiC-D substrate is permeable to atomic hydrogen (at room temperature) in some defect nano-regions (probably, in vacancies and/or triple junctions (nodes) of the grain-boundary network (Brito et al., 2011; Zhang et al., 2014; Banhart et al., 2011; Yazyev and Louie, 2010; Kim et al., 2011; Koepke et al., 2013; Zhang and Zhao, 2013; Yakobson and Ding, 2011; Cockayne et al., 2011; Zhang et al., 2012; Eckmann et al., 2012).
It would be expedient to note that the HREELS data (Bocquet et al., 2012) on bending and stretching vibration C-H frequencies in SiC-D/QFMLG-H samples [153 meV (3.7 × 10¹³ s-1) and 331 meV (8.0 × 10¹³ s-1), respectively] are consistent with those (Xie et al., 2011) considered above, related to the HREELS data for the epitaxial graphene (Elias et al., 2009).
The obtained characteristics (Table 2) of desorption processes (Wojtaszek et al., 2011; Castellanos-Gomez, 2012; Wojtaszek et al., 2012; Bocquet et al., 2012) show that all these processes may be of a diffusion-rate-controlling character (Nechaev, 2010).
CONSIDERATION AND INTERPRETATION OF THE RAMAN SPECTROSCOPY DATA ON DEHYDROGENATION OF GRAPHENE LAYER
In Luo et al. (2009), graphene layers on SiO2/Si substrate have been chemically decorated by radio frequency hydrogen plasma (the power of 5 - 15 W, the pressure of 1 T or) treatment for 1 min. The investigation of hydrogen coverage by Raman spectroscopy and micro-x-ray photoelectron spectroscopy (PES) characterization demonstrates that the hydrogenation of a single layer graphene on SiO2/Si substrate is much less feasible than that of bi-layer and multilayer graphene. Both the hydrogenation and dehydrogenation processes of the graphene layers are controlled by the corresponding energy barriers, which show significant dependence on the number of layers. These results (Luo et al., 2009) on bilayer graphene/SiO2/Si are in contradiction to the results (Elias et al., 2009) on a negligible hydrogenation of bi-layer epitaxial graphene on SiO2/Si wafer, when obviously other defects are produced.
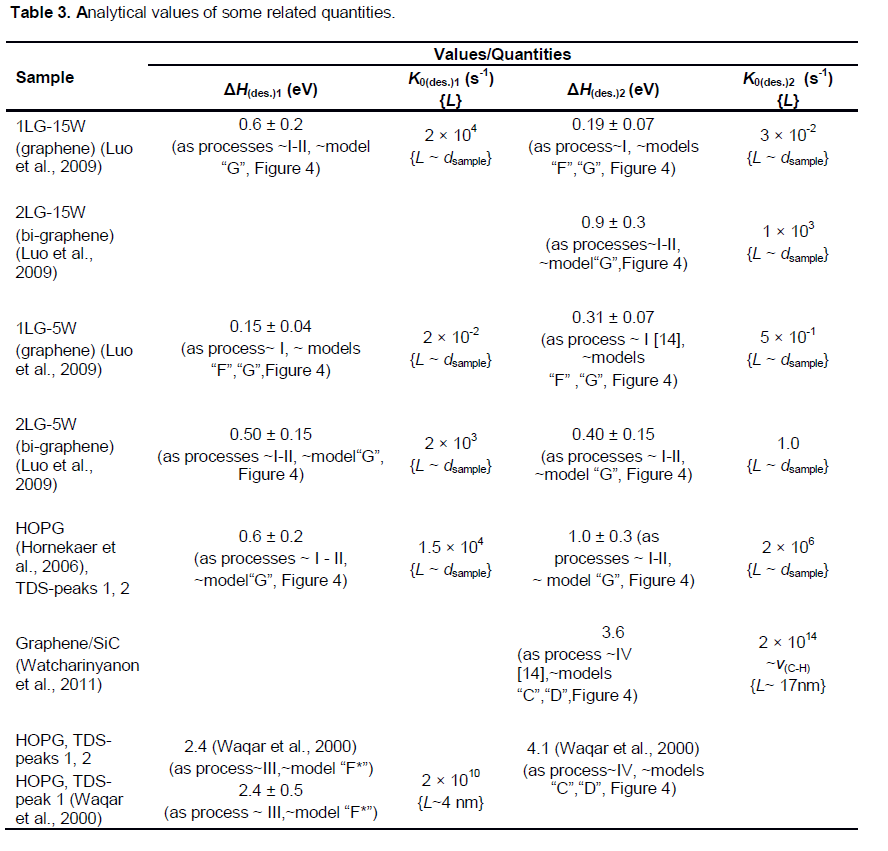
Within a formal kinetics approach (Nechaev, 2010; Bazarov, 1976), the kinetic data from (Figure 10a) for single layer graphene samples (1LG-5W and 1LG-15W ones) can be treated. Equation (7) is used to transform into a more suitable form (7′): K» -[(DC/Dt)/C], where Dt = 1800 s, and DC and C are determined from Figure 10a. The results have been obtained for 1LG-15W sample 3 values of the #1 reaction rate constant K1(1LG-15W) for 3 temperatures (T = 373, 398 and 423K), and 3 values of the#2reaction rate constant K2(1LG-15W) for 3 temperatures (T = 523, 573 and 623K). Hence, by using Equation 9, the following quantities for 1LG-15W samples have been determined (Table 3): the #1 reaction activation energy ΔHdes.1(1LG-15W) = 0.6 ± 0.2 eV, the per-exponential factor of the #1 reaction rate constant K0des.1(1LG-15W)» 2 × 10⁴ s-1, the #2 reaction activation energy ΔHdes.2[(1LG-15W)= 0.19 ± 0.07 eV, and the per-exponential factor of the #2 reaction rate constant K0des.2[(1LG-15W)» 3 × 10⁻² s-1.
This also resulted in finding for 1LG-5W sample 4 values of the #1 reaction rate constant KI(1LG-5W) for 4 temperatures (T = 348, 373, 398 and 423K), and 2 values of the #2 reaction rate constant K2(1LG-5W) for 2 temperatures (T = 523 and 573 K). Therefore, by using Equation 9, one can evaluate the desired quantities for 1LG-5W specimens (Table 3): the #1 reaction activation energy ΔHdes.1(1LG-5W) = 0.15 ± 0.04 eV, the per-exponential factor of the #1 reaction rate constant K0des.1[(1LG-5W)» 2 × 10⁻² s-1, the #2 reaction activation energy ΔHdes.2(1LG-5W) = 0.31 ± 0.07 eV, and the per-exponential factor of the #2reaction rate constant K0des.2(1LG-5W)» 0.5 s-1.
A similar treatment of the kinetic data from (Figure 10c) for bi-layer graphene 2LG-15W samples resulted in obtaining 4 values of the #2reaction rate constant K2(2LG-15W) for 4 temperatures (T = 623, 673, 723 and 773K). Hence, by using Equation (9), the following desired values are found (Table 3): the #2 reaction activation energy ΔHdes.2(2LG-15W) = 0.9 ± 0.3 eV, the per-exponential factor of the #2 reaction rate constant K0des.2(2LG-15W) »1 × 10³ s-1.
A similar treatment of the kinetic data from (Figure 6c) in Luo et al. (2009) for bi-layer graphene 2LG-5W samples results in obtaining 4 values for the #1 reaction rate constant K1(2LG-5W) for 4 temperatures (T = 348, 373, 398 and 423K), and 3 values for the #2 reaction rate constant K2(2LG-5W) for 3 temperatures (T = 573, 623 and 673K). Their temperature dependence is described by Equation (9). Hence, one can evaluate the following desired values (Table 3): the #1 reaction activation energy ΔHdes.1[(2LG-5W) = 0.50 ± 0.15 eV, the per-exponential factor of the #1 reaction rate constant K0des.1(2LG-5W)» 2×10³ s-1, the #2reaction activation energy ΔHdes.2(2LG-5W) = 0.40 ± 0.15 eV, and the per-exponential factor of the #2 reaction rate constant K0des.2(2LG-5W)» 1 s-1.
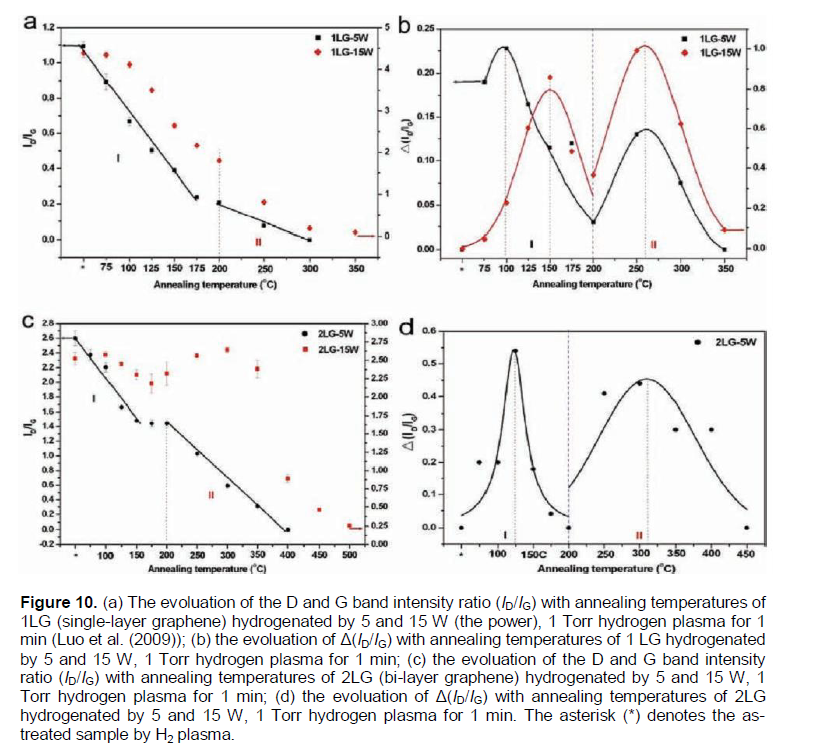
The obtained analytical results (Table 3) on characteristics of desorption (dehydrogenation) processes #1and #2 (Luo et al., 2009) may be interpreted within the models used for interpretation of the similar characteristics for the epitaxial graphenes (Elias et al.,2009) (Table 1A). It shows that the desorption processes #1and #2 in Luo et al. (2009) may be of a diffusion-rate-controlling character.
CONSIDERATION AND INTERPRETATION OF THE TDS/STM DATA FOR HOPG TREATED BY ATOMIC DEUTERIUM
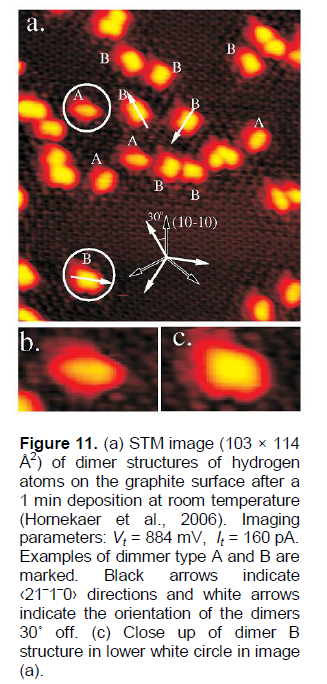
Hornekaer et al. (2006) present results of a STM study of HOPG samples treated by atomic deuterium, which reveals the existence of two distinct hydrogen dimer nano-states on graphite basal planes (Figures 11 and 12b). The density functional theory calculations allow them to identify the atomic structure of these nano-states and to determine their recombination and desorption pathways. As predicted, the direct recombination is only possible from one of the two dimer nano-states. In conclusion (Hornekaer et al., 2006), this results in an increased stability of one dimer nanospecies, and explains the puzzling double peak structure observed in temperature programmed desorption spectra (TPD or TDS) for hydrogen on graphite (Figure 12a).
By using the method of Nechaev (2010) of TDS peaks’ treatment, for the case of TDS peak 1 (~65% of the total area, Tmax#1 » 473K) in Figure 12), one can obtain values of the reaction #1 rate constant (K(des.)1 = 1/t0.63(des.)1) for several temperatures (for instance, T = 458, 482 and 496K). Their temperature dependence can be described
by Equation (9). Hence, the desired values are defined as follows (Table 3): the #1 reaction (desorption) activation energy ΔH(des.)1 = 0.6 ± 0.2 eV, and the per-exponential factor of the #1 reaction rate constant K0(des.)1» 1.5 × 10⁴ s-1.
In a similar way, for the case of TDS peak 2 (~35% of the total area, Tmax#2 » 588 K) in Figure 12a, one can obtain values of the #2 reactionrate constant (K(des.)2 = 1/t0.63(des.)2) for several temperatures (for instance, T = 561 and 607K). Hence, the desired values are defined as follows (Table 3): the #2 reaction (desorption)activation energy ΔH(des.)2 = 1.0 ± 0.3 eV, and the per-exponential factor of the #2 reaction rate constant K0(des.)2» 2 × 10⁶ s-1.
The obtained analytical results (Table 3) on characteristics of desorption (dehydrogenation) processes #1and #2 in Hornekaer et al. (2006) (also as in Luo et al. (2009) may be interpreted within the models used above for interpretation of the similar characteristics for the epitaxial graphenes (Elias et al., 2009) (Table 1A). It shows that the desorption processes #1and #2 (in Hornekaer et al. (2006) and Luo et al. (2009) may be of a diffusion-rate-controlling character. Therefore, these processes cannot be described by using the Polanyi-Wigner equation (as it has been done in Hornekaer et al. (2006).
The observed “dimer nano-states” or “nano-protrusions” (Figures 11 and 12b) may be related to the defected nano-regions, probably, as grain (domain) boundaries (Brito et al., 2011; Zhang et al., 2014; Banhart et al., 2011; Yazyev and Louie, 2010; Kim et al., 2011; Koepke et al., 2013; Zhang and Zhao, 2013; Yakobson and Ding, 2011; Cockayne et al., 2011; Zhang et al., 2012; Eckmann et al., 2012), and/or triple and other junctions (nodes) of the grain-boundary network in the HOPG samples. Some defected nano-regions at the grain boundary network (hydrogen adsorption centres #1, mainly, the “dimer B” nano-structures) can be related to TPD (TDS) peak 1, the others (hydrogen adsorption centres #2, mainly, the “dimer A” nano-structures) to TPD (TDS) peak 2.In Figures 11a and 12b, one can imagine some grain boundary network (with the grain size of about 2 - 5 nm) decorated (obviously, in some nano-regions at grain boundaries) by some bright nano-protrusions. Similar “nano-protrusions” are observed and in graphene/SiC systems (Balog et al., 2009; Watcharinyanon et al., 2011) (Figures 13 to 16).
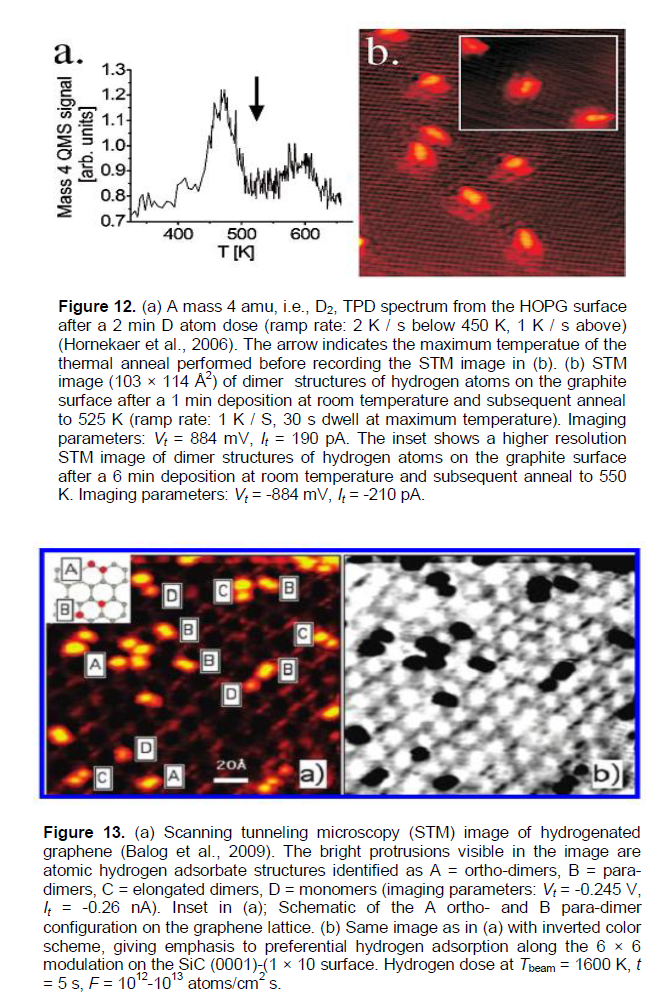
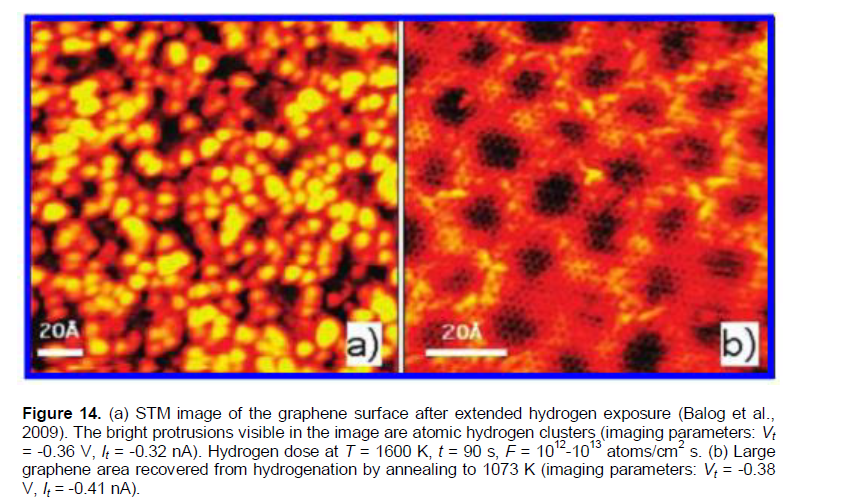
In Balog et al. (2009), hydrogenation was studied by a beam of atomic deuterium 1012 - 1013 cm-2s-1 (corresponding to PD» 10-4 Pa) at 1600K, and the time of exposure of 5 - 90 s, for single graphene on SiC-substrate. The formation of graphene blisters were observed, and intercalated with hydrogen in them (Figures 13 and 14), similar to those observed on graphite (Hornekaer et al., 2006) (Figures 11 and 12) and graphene/SiO2 (Watcharinyanon et al., 2011) (Figures 15 and 16). The blisters (Balog et al., 2009) disappeared after keeping the samples in vacuum at 1073K (~ 15 min). By using Equation (8), one can evaluate the quantity of t0.63(des.)1073K[58]» 5 min, which coincides (within the errors) with the similar quantity of t0.63(des.)1073K[17]» 7 min evaluated for graphene/SiC samples (Watcharinyanon et al., 2011) (Table 3).
A nearly complete decoration of the grain boundary network (Brito et al., 2011; Zhang et al., 2014; Banhart et al., 2011; Yazyev and Louie, 2010; Kim et al., 2011; Koepke et al., 2013; Zhang and Zhao, 2013; Yakobson and Ding, 2011; Cockayne et al., 2011; Zhang et al., 2012; Eckmann et al., 2012), can be imagined in Figure 15b. Also, as seen in Figure 16, such decoration of the nano-regions obviously, located at the grain boundaries (Brito et al., 2011; Zhang et al., 2014; Banhart et al., 2011; Yazyev and Louie, 2010; Kim et al., 2011; Koepke et al., 2013; Zhang and Zhao, 2013; Yakobson and Ding, 2011; Cockayne et al., 2011; Zhang et al., 2012; Eckmann et al., 2012), has a blister-like cross-section height of about 1.7 nm and width of 10 nm order.
According to the thermodynamic analysis presented above, Equation (15), such blister-like decoration nano-regions (obviously, located at the grain boundaries (Brito et al., 2011; Zhang et al., 2014; Banhart et al., 2011; Yazyev and Louie, 2010; Kim et al., 2011; Koepke et al., 2013; Zhang and Zhao, 2013; Yakobson and Ding, 2011; Cockayne et al., 2011; Zhang et al., 2012; Eckmann et al., 2012), may contain the intercalated gaseous molecular hydrogen at a high pressure.
CONSIDERATION AND INTERPRETATION OF THE PES/ARPES DATA ON HYDROGENATION-DEHYDROGENATION OF GRAPHENE/
In Watcharinyanon et al. (2011), atomic hydrogen exposures at a pressure of PH» 1 × 10⁻⁴ Pa and temperature T = 973K on a monolayer graphene grown on the SiC(0001) surface are shown, to result in hydrogen intercalation. The hydrogen intercalation induces a transformation of the monolayer graphene and the carbon buffer layer to bi-layer graphene without a buffer layer. The STM, LEED, and core-level PES measurements reveal that hydrogen atoms can go underneath the graphene and the carbon buffer layer. This transforms the buffer layer into a second graphene layer. Hydrogen exposure (15 min) results initially in the formation of bi-layer graphene (blister-like) islands with a height of ~ 0.17 nm and a linear size of ~ 20 - 40 nm, covering about 40% of the sample (Figures 15b and e), 16a and b). With larger (additional 15 min) atomic hydrogen exposures, the islands grow in size and merge until the surface is fully covered with bi-layer grapheme (Figures 15c and 15f, 16c and d). A (Ö 3 × Ö 3) R30° periodicity is observed on the bi-layer areas. Angle resolved PES and energy filtered X-ray photoelectron emission microscopy (XPEEM) investigations of the electron band structure confirm that after hydrogenation the single p-band characteristic of monolayer graphene is replaced by two p-bands that represent bi-layer graphene. Annealing an intercalated sample, representing bi-layer graphene, to a temperature of1123K or higher, re-establishes the monolayer graphene with a buffer layer on SiC (0001).
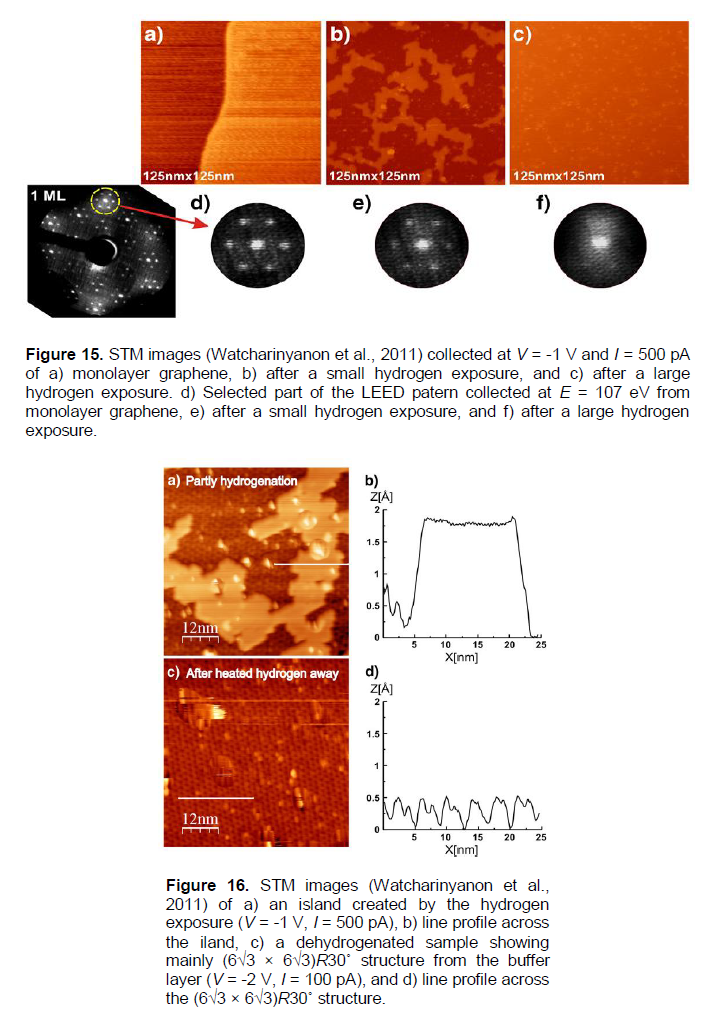
The dehydrogenation has been performed by subsequently annealing (for a few minutes) the hydrogenated samples at different temperatures, from 1023 to 1273K. After each annealing step, the depletion of hydrogen has been probed by PES and ARPES (Figures 17 and 18). From this data, using Equations (8) and (9), one can determine the following tentative quantities: t0.63(des.) (at 1023 and 1123K), ΔH(des.)» 3.6 eV and K0(des.)» 2 × 10¹⁴ s-1 (Table 3).
The obtained value of the quantity of ΔH(des.) coincides (within the errors) with values of the quantities of Qapp.IV» 3.8 eV » ?H(C-H)”C”,”D” (Table 1B), which are related to the diffusion-rate-limiting TDS process IV of a dissociative chemisorption of molecular hydrogen in defected regions in graphite materials (Table 1B), and to the chemisorption models “C” and “D”(Figure 4).
The obtained value of the quantity of K0(des.) may be correlated with possible values of the (C-H) bonds’ vibration frequency (ν(C-H)”C”,”D”). Hence, by taking also into account that ΔH(des.)» ?H(C-H)”C”,”D”, one may suppose the case of a non-diffusion-rate-controlling process corresponding to the Polanyi-Wigner model (Nechaev, 2010).
On the other hand, by taking also into account that ΔH(des.)» ?H(C-H)”C”,”D”, one may suppose the case of a diffusion-rate-controlling process corresponding to the TDS process IV (Table 1B). Hence, by using the value (Nechaev, 2010) of D0app.IV » 6 × 102 cm2/s, one can evaluate the quantity of L ≈ (D0app.IV / K0(des.))1/2 = 17 nm (Table 3). The obtained value of L (also, as and in the case of (SiC-D/QFMLG) (Bocquet et al., 2012), Table 2) coincides (within the errors) with values of the quantities of Ldef.» 11 - 17 nm [Equation (10)] and Ldef.» 20 nm (Figure 8b). The obtained value of L is also correlated with the STM data (Figures 15 and 16). It shows that the desorption process of the intercalated hydrogen may be rate-limited by diffusion of hydrogen atoms to a nearest one of the permeable defects of the anchored graphene layer.
When interpretation of these results, one can also take into account the model (proposed in (Watcharinyanon et al., 2011) of the interaction of hydrogen and silicon atoms at the graphene-SiC interface resulted in Si-C bonds at the intercalated islands.
CONSIDERATION AND INTERPRETATION OF THE TDS/STM DATA FOR HOPG TREATED BY ATOMIC HYDROGEN
In Waqar (2007), atomic hydrogen accumulation in HOPG samples and etching their surface under hydrogen TDS have been studied by using a STM and atomic force microscope (AFM). STM investigations revealed that thesurface morphology of untreated reference HOPG samples was found to be atomically flat (Figure 19a), with a typical periodic structure of graphite (Figure 19b). Atomic hydrogen exposure (treatment) of the reference HOPG samples (30 - 125 min at atomic hydrogen pressure PH» 10-4 Pa and a near-room temperature (~300K)) with different atomic hydrogen doses (D), has drastically changed the initially flat HOPG surface into a rough surface, covered with nanoblisters with an average radius of ~25 nm and an average height of ~4 nm(Figures 19c and d).
TDS of hydrogen has been found in heating of the HOPG samples under mass spectrometer control. As shown in Figure 20a, with the increase of the total hydrogen doses (D) to which HOPG samples have been exposed, the desorbed hydrogen amounts (Q) increase and the percentage of D retained in samples approaches towards a saturation stage.
After TD, no nanoblisters were visible on the HOPG surface, the graphite surface was atomically flat, and covered with some etch-pits of nearly circular shapes, one or two layers thick (Figure 20b). This implies that after release of the captured hydrogen gas, the blisters become empty of hydrogen, and the HOPG surface restores to a flat surface morphology under the action of corresponding forces.
According to the concept by Waqar (2007), nanoblisters found on the HOPG surface after atomic hydrogen exposure are simply monolayer graphite (graphene) blisters, containing hydrogen gas in molecular form (Figure 21). As suggested in Waqar (2007), atomic hydrogen intercalates between layers in the graphite net through holes in graphene hexagons, because of the small diameter of atomic hydrogen, compared to the hole’s size, and is then converted to a H2 gas form which is captured inside the graphene blisters, due to the relatively large kinetic diameter of hydrogen molecules.
However, such interpretation is in contradiction with that noted in Introduction results (Xiang et al., 2010; Jiang et al., 2009), that it is almost impossible for a hydrogen atom to pass through the six-member ring of graphene at room temperature.
It is reasonable to assume (as it has been done in some previous parts of this paper) that in HOPG (Waqar, 2007) samples atomic hydrogen passes into the graphite near-surface closed nano-regions (the graphene nanoblisters) through defects (perhaps, mainly through triple junctions of the grain and/or subgrain boundary network (Brito et al., 2011; Zhang et al., 2014; Banhart et al., 2011; Yazyev and Louie, 2010; Kim et al., 2011; Koepke et al., 2013; Zhang and Zhao, 2013; Yakobson and Ding, 2011; Cockayne et al., 2011; Zhang et al., 2012; Eckmann et al., 2012), in the surface graphene layer. It is also expedient to note that in Figure 20b, one can imagine some grain boundary network decorated by the etch-pits.
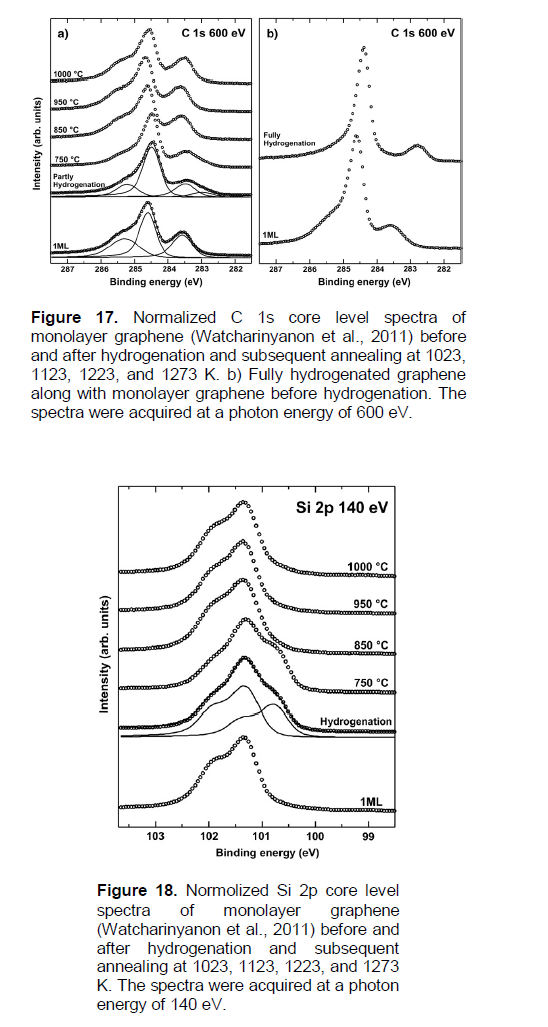
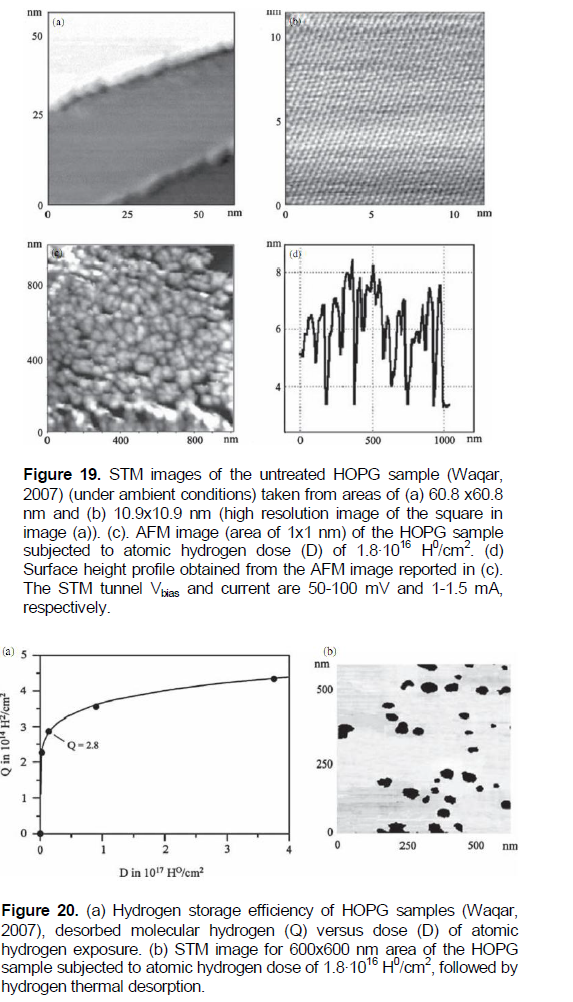
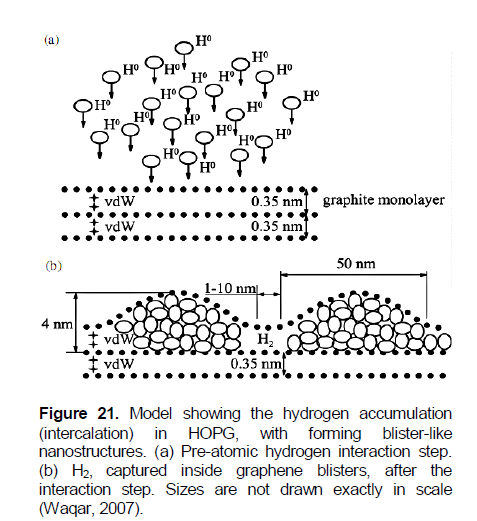
The average blister has a radius of ~25 nm and a height ~4 nm (Figure 19). Approximating the nanoblister to be a semi-ellipse form, results in the blister area of Sb » 2.0 × 10⁻¹¹ cm2 and its volume Vb » 8.4 × 10⁻¹⁹ cm3. The amount of retained hydrogen in this sample becomes Q » 2.8 × 10¹⁴ H2/cm2 and the number of hydrogen molecules captured inside the blister becomes n» (Q Sb) » 5.5 × 10³. Thus, within the ideal gas approximation, and accuracy of one order of the magnitude, the internal pressure of molecular hydrogen in a single nanoblister at near-room temperature (T » 300 K) becomes PH2» {kB (Q Sb) T / Vb} » 108 Pa. The hydrogen molecular gas density in the blisters (at T » 300K and PH2» 1 × 10⁸ Pa) can be estimated as r» {(QMH2Sb)/Vb} » 0.045 g/cm3, where MH2 is the hydrogen molecule mass. It agrees with data (Trunin et al., 2010) considered in Nechaev and Veziroglu (2013), on the hydrogen (protium) isotherm of 300K.
These results can be quantitatively described, with an accuracy of one order of magnitude, with the thermodynamic approach (Bazarov, 1976), and by using the condition of the thermo-elastic equilibrium for the reaction of (2H(gas) → H2(gas_in_blisters)), as follows (Nechaev and Veziroglu, 2013):

(11)
Where P*H2 is related to the blister “wall” back pressure (caused by PH2) - the so called (Bazarov, 1976) surface pressure (P*H2»PH2» 1 × 10⁸ Pa), PH is the atomic hydrogen pressure corresponding to the atomic flux (Waqar, 2007) (PH» 1×10⁻⁴ Pa), P0H2 = P0H = 1 Pa is the standard pressure, ?Hdis = 4.6 eV is the experimental value (Karapet’yants and Karapet’yants, 1968) of the dissociation energy (enthalpy) of one molecule of gaseous hydrogen (at room temperatures), ?Sdis = 11.8 kB is the dissociation entropy (Karapet’yants and Karapet’yants, 1968), ?V» (Sb rb / n) is the apparent volume change, rb is the radius of curvature of nanoblisters at the nanoblister edge (rb» 30 nm, Figures 19 and 21b), NA is the Avogadro number, and Tis the temperature (T » 300K). The quantity of (P*H2?V) is related to the work of the nanoblister surface increasing with an intercalation of 1 molecule of H2.
The value of the tensile stresses σb (caused by P*H2) in the graphene nanoblister "walls" with a thickness of db and a radius of curvature rb can be evaluated from another condition (equation) of the thermo-elastic equilibrium of the system in question, which is related to Equation 11 as follows (Nechaev and Veziroglu, 2013):
σb» (P*H2 rb / 2 db) » (eb Eb) (12)
Where eb is a degree of elastic deformation of the graphene nanoblister walls, and Eb is the Young’s modulus of the graphene nanoblister walls. Substituting in the first part of Equation (12), the quantities of P*H2» 1 × 10⁸ Pa, rb» 30 nm and db» 0.15 nm results in the value of σb[15]» 1 × 10¹⁰ Pa.
The degree of elastic deformation of the graphene nanoblister walls, apparently reaches eb[15]» 0.1 (Figure 21b). Hence, with Hooke’s law of approximation, using the second part of Equation (12), one can estimate, with the accuracy of one-two orders of the magnitude, the value of the Young’s modulus of the graphene nanoblister walls: Eb » (σb/eb) » 0.1 TPa. It is close (within the errors) to the experimental value (Lee et al., 2008; Pinto and Leszczynski, 2014) of the Young’s modulus of a perfect (that is, without defects) graphene (Egraphene » 1.0 TPa).
The experimental data (Waqar, 2007; Waqar et al., 2010) on the TDS (the flux Jdes) of hydrogen from graphene nanoblisters in pyrolytic graphite can be approximated by three thermodesorption (TDS) peaks, that is, #1 with Tmax#1 » 1123K, #2 with Tmax#2 » 1523K, and #3 with Tmax#3 » 1273K. But their treatment, with using the above mentioned methods (Nechaev, 2010), is difficult due to some uncertainty relating to the zero level of the Jdes quantity.
Nevertheless, TDS peak #1 (Waqar et al., 2010) can be characterized by the activation desorption energy ΔH(des.)1[59]= 2.4 ± 0.5 eV, and by the per-exponential factor of the reaction rate constant of K0(des.)1[59]» 2 × 10¹⁰ s-1 (Table 3). It points that TDS peak 1 (Waqar et al., 2010) may be related to TDS peak (process) III, for which the apparent diffusion activation energy is Qapp.III = (2.6 ± 0.3) eV and D0app.III » 3 × 10⁻³ cm2/s (Table 1B). Hence, one can obtain (with accuracy of one-two orders of the magnitude) a reasonable value of the diffusion characteristic size of LTDS-peak1[59]» (D0app.III/K0(des.)1[59])1/2» 4 nm, which is obviously related to the separating distance between the graphene nanoblisters (Figure 21b) or (within the errors) to the separation distance between etch-pits (Figure 20b) in the HOPG specimens (Waqar, 2007; Waqar et al., 2010).
As noted in the previous parts of this paper, process III is related to model “F*” (Yang and Yang, 2002) (with ?H(C-H)“F*” = (2.5 ± 0.3) eV (Nechaev, 2010), and it is a rate-limiting by diffusion of atomic hydrogen between graphene-like layers (in graphite materials and nanomaterials), where molecular hydrogen cannot penetrate (according to analysis (Nechaev, 2010) of a number of the related experimental data).
Thus, TDS peak (process) 1 (Waqar, 2007; Waqar et al., 2010) may be related to a rate-limiting diffusion of atomic hydrogen, between the surface graphene-like layer and neighboring (near-surface) one, from the graphene nanoblisters to the nearest penetrable defects of the separation distance LTDS-peak1[59] ~ 4 nm.
As considered below, a similar (relevance to results (Waqar, 2007; Waqar et al., 2010) situation, with respect to intercalation of a high density molecular hydrogen into closed (in the definite sense) nanoblisters and/or nanoregions in graphene-layer-structures, may occur in hydrogenated GNFs.
A POSSIBILITY OF INTERCALATION OF SOLID H2 INTO CLOSED NANOREGIONS IN HYDROGENATED GRAPHITE NANOFIBERS (GNFS) RELEVANT TO THE HYDROGEN ON-BOARD STORAGE PROBLEM
The possibility of intercalation of a high density molecular hydrogen (up to solid H2) into closed (in the definite sense) nanoregions in hydrogenated GNFs is based both on the analytical results presented in the previous psrts of this study (Tables 1 to 3), and on the following facts (Nechaev and Veziroglu, 2013):
(1) According to the experimental and theoretical data (Trunin et al., 2010) (Figures 22 and 23), a solid molecular hydrogen (or deuterium) of density of ρH2 = 0.3 - 0.5 g/cm3(H2)can exist at 300K and an external pressure of P = 30 - 50 Gpa.
(2) As seen from data in Figures 19 to 21and Equations 11 and 12, the external (surface) pressure of P = P*H2 = 30 to 50 GPa at T» 300K may be provided at the expense of the association energy of atomic hydrogen (T?Sdis -?Hdis), into some closed (in the definite sense) nano- regions in hydrogenated (in gaseous atomic hydrogen with the corresponding pressure PH) graphene-layer-nanostructures possessing of a high Young’s modulus (Egraphene» 1 TPa).
(3) As shown in Nechaev and Veziroglu (2013), the treatment of the extraordinary experimental data (Gupta et al., 2004) (Figure 24) on hydrogenation of GNFs results in the empirical value of the hydrogen density ρH2= (0.5 ± 0.2) g(H2)/cm3(H2) (or ρ(H2-C-system)» 0.2 g(H2)/cm3(H2-C-system)) of the intercalated (at T» 300K) high-purity reversible hydrogen (about 17 mass% H2); it corresponds to the state of solid molecular hydrogen at the pressure of P = P*H2» 50 GPa, according to data from Figures 22 and 23.
(4) Substituting in Equation (12) the quantities of P*H2» 5 × 10¹⁰ Pa, eb» 0.1 (Figure 24), the largest possible value of Eb» 1012 Pa (Lee et al., 2008; Pinto and Leszczynski (2014)), the largest possible value of the tensile stresses (σb» 1011 Pa (Lee et al., 2008; Pinto and Leszczynski, 2014) in the edge graphene “walls” (of a thickness of db and a radius of curvature of rb) of the slit-like closed nanopores of the lens shape (Figure 24), one can obtain the quantity of (rb / db) » 4. It is reasonable to assume rb » 20 nm; hence, a reasonable value follows of db» 5 nm.
(5) As noted in (Nechaev and Veziroglu, 2013), a definite residual plastic deformation of the hydrogenated graphite (graphene) nano-regions is observed in Figure 24. Such plastic deformation of the nanoregins during hydrogenation of GNFs may be accompanied with some mass transfer resulting in such thickness (db) of the walls.
(6) The related data (Figure 25) allows us to reasonably assume a break-through in results (Nechaev and Veziroglu, 2013) on the possibility (and particularly, physics) of intercalation of a high density molecular hydrogen (up to solid H2) into closed (in the definite sense) nanoregions in hydrogenated GNFs (Gupta et al., 2004; Park et al., 1999), relevant for solving of the current problem (Akiba, 2011; Zuettel, 2011; DOE targets, 2012) of the hydrogen on-board effective storage.
(7) Some fundamental aspects - open questions on engineering of "super" hydrogen storage carbonaceous nanomaterials, relevance for clean energy applications, are also considered in (Nechaev and Veziroglu, 2013) and in this study, as well.
On the “thermodynamic forces” and/or energetics of forming (under atomic hydrogen treatment) of graphene nanoblisters in the surface HOPG layers and epitaxial graphenes
A number of researchers (Waqar, 2007; Watcharinyanon et al., 2011; Wojtaszek et al., 2011; Castellanos-Gomezet al., 2012; Bocquet et al., 2012; Hornekaer et al., 2006; Luo et al., 2009; Balog et al., 2009; Waqar et al., 2010) have not sufficiently considered the “thermodynamic forces” and/or energetics of forming (under atomic hydrogen treatment) graphene nanoblisters in the surface HOPG layers and epitaxial graphenes.
Therefore, in this study, the results of the thermodynamic analysis (Equations 11 and 12) are presented, which may be used for interpretation of related data (Figures 6 to 8, 11 to 16, 19 to 21).
On some nanodefects (grain boundaries, their triple junctions and others), penetrable for atomic hydrogen, in the surface HOPG graphene-layers and epitaxial graphenes
A number of researchers noted above have not taken into account (in a sufficient extent) the calculation results (Xiang et al., 2010) showing that the barrier for the penetration of a hydrogen atom through the six-member ring of a perfect graphene is larger than 2.0 eV. Thus, it is almost impossible for a hydrogen atom to pass through the six-member ring of a perfect (that is, without defects) graphene layer at room temperature.
Therefore, in this study, a real possibility of the atomic hydrogen penetration through some nanodefects in the graphene-layer-structures, that is, grain boundaries, their triple junctions (nodes) and/or vacancies (Brito et al., 2011; Zhang et al., 2014; Banhart et al., 2011; Yazyev and Louie, 2010; Kim et al., 2011; Koepke et al., 2013; Zhang and Zhao, 2013; Yakobson and Ding, 2011; Cockayne et al., 2011; Zhang et al., 2012; Eckmann et al., 2012), are considered. These analytical results may be used for interpretation of the related data (for instance, Figures 6 to 8, 11 to 16, 19 to 21).
On finding and interpretation of the thermodynamic characteristics of “reversible” hydrogenation-dehydrogenation of epitaxial graphenes and membrane ones
A number of researchers, for instance ones noted above have not treated and compared their data on “reversible” hydrogenation-dehydrogenation of membrane graphenes and epitaxial ones, with the aim of finding and interpretation of

the thermodynamic characteristics. Therefore, in this analytical study, the thermodynamic approaches (particularly, Equations 1 to 12), such treatment results of related theoretical and experimental data (Tables 1 to 3) and their interpretation are presented. As shown, these analytical results may be used for a more detailed understanding and revealing of the atomic mechanisms of the processes.
There is a considerable difference (in the declared errors and without any explanation) in the theoretical values of the energetic graphene (CH) quantities (?H(C-H), ?H(bind.), ?H(C-C)) obtained in different theoretical studies, for instance, in (Sofo et al., 2007; Dzhurakhalov and Peeters, 2011) (Table 1A).
Unfortunately, the theoretical values of the graphene quantity of ?H(C-C) is usually not evaluated by the researchers, and not compared by them with the much higher values of the graphene (both theoretical, and experimental) quantity of ?H(C-C) (Table 1A). It could be useful, for instance, when considering the fundamental strength properties of graphane and graphene structures.
As far as we know, most researchers have not taken into account the alternative possibility supposed in (Elias et al., 2009) that (i) the experimental graphene membrane (a free-standing one) may have “a more complex hydrogen bonding, than the suggested by the theory”, and that (ii) graphane (CH) (Sofo et al., 2007) may be the until now theoretical material.
In this connection, it seems expedient to take into account also some other approaches and results (Sorokin and Chernozatonskii, 2013; Davydov and Lebedev, 2012; Khusnutdinov, 2012; Chernozatonskii et al., 2012; Data et al., 2012).
On the thermodynamic characteristics and atomic mechanisms of “reversible” hydrogenation-dehydrogenation of free-standing graphene membranes
The thermodynamic analysis of experimental data (Elias et al., 2009) on “reversible” hydrogenation-dehydrogenation of free-standing graphene membranes have resulted in the following conclusive suppositions and/or statements:
(1) These chemisorption processes are related to a non-diffusion-rate-limiting case. They can be described and interpreted within the physical model of the Polanyi-Wigner equation for the first order rate reactions (Nechaev, 2010; Nechaev and Veziroglu, 2013), but not for the second order rate ones (Zhao et al., 2006).
(2) The desorption activation energy is of ΔHdes.(membr.[5])= ?HC-H(membr.[5]) = 2.6 ± 0.1 eV (Table 1A). The value of the quantity of ?HC-H(membr.[5]) coincides (within the errors), in accordance with the Polanyi-Wigner model, with the values of the similar quantities for theoretical graphenes (Sofo et al., 2007; Openov and Podlivaev, 2010) (Table1A) possessing of a diamond-like distortion of the graphene network. The value of the quantity of ?HC- H(membr.[5]) coincides (within the errors) with the value of the similar quantity for model “F*” (Table 1B) manifested in graphitic structures and nanostructures not possessing of a diamond-like distortion of the graphene network (an open theoretical question).
(3) The desorption frequency factor is of K0des.(membr.[5]) = nC-H(membr.[5])» 5 × 10¹³ s-1 (Table 1A); it is related to the corresponding vibration frequency for the C-H bonds (in accordance with the Polanyi-Wigner model for the first order rate reactions.
(4) The adsorption activation energy (in the approximation of K0ads.»K0des.) is of ?Hads.(membr.[5]) = 1.0 ± 0.2 eV (Table 1A). The heat of adsorption of atomic hydrogen by the free standing graphene membranes (Elias et al., 2009) can be evaluated as: (?Hads.(membr.[5]) - ?Hdes.(membr.[5])) = -1.5 ± 0.2 eV (an exothermic reaction).
(5) Certainly, these tentative analytical results could be directly confirmed and/or modified by receiving and treating (within Equations (8) and (9) approach) of the experimental data on t0.63 at several annealing temperatures.
On the thermodynamic characteristics and atomic mechanisms of “reversible” hydrogenation-dehydrogenation of epitaxial graphenes
The thermodynamic analyses of experimental data (Waqar, 2007; Watcharinyanon et al., 2011; Wojtaszek et al., 2011; Castellanos-Gomez et al., 2012; Bocquet et al., 2012; Luo et al., 2009) on “reversible” hydrogenation-dehydrogenation of epitaxial graphenes have resulted in the following conclusive suppositions and/or statements:
(1) These chemisorption processes for all 16 considered epitaxial graphenes (Tables 1A, 2 and 3), unlike ones for the free-standing graphene membranes (Table 1A), are related to a diffusion-rate-limiting case. They can be described and interpreted within the known diffusion approximation of the first order rate reactions (Nechaev, 2010; Nechaev and Veziroglu, 2013), but not within the physical models of the Polanyi-Wigner equations for the first (Hornekaer et al., 2006) or for the second (Zhao et al., 2006) order rate reactions.
(2) The averaged desorption activation energy for 14 of 16 considered epitaxial graphenes (Tables 1A, 2 and 3) is of ΔHdes.(epitax.)= 0.5 ± 0.4 eV, and the averaged quantity of ?nK0des.(epitax.) = 5 ± 8, that is, K0des.(epitax.)» 1.5 × 10² s-1 (or 5 × 10⁻² – 5 × 10⁵ s-1); the adsorption activation energy (in a rough approximation of K0ads.»K0des.) is of ?Hads.(epitax.) = 0.3 ± 0.2 eV.
(3) The above obtained values of characteristics of dehydrogenation of the epitaxial graphenes can be presented, as follows: ΔHdes.~ Qapp.I, K0des. ~ (D0app.I / L2), where Qapp.I and D0app.I are the characteristics of process I (Table 1B), L ~ dsample, that is, being of the order of diameter (dsample) of the epitaxial graphene samples. The diffusion-rate-limiting process I is related to the chemisorption models “F” and “G” (Figure 4). These results unambiguously point that in the epitaxial graphenes the dehydrogenation processes are rate-limiting by diffusion of hydrogen, mainly, from chemisorption “centers” (of “F” and/or “G” types (Figure (4) localized on the internal graphene surfaces to the frontier edges of the samples. These results also point that the solution and the diffusion of molecular hydrogen may occur between the graphene layer and the substrate, unlike for a case of the graphene neighbor layers in graphitic structures and nanostructures, where the solution and the diffusion of only atomic hydrogen (but not molecular one) can occur (process III (Nechaev, 2010), Table 1B).
(4) The above formulated interpretation (model) is direct opposite to the supposition (model) of a number of researchers, those believe in occurrence of hydrogen desorption (dehydrogenation) processes, mainly, from the external epitaxial graphene surfaces.And it is direct opposite to the supposition - model of many scientists that the diffusion of hydrogen along the graphene-substrate interface is negligible.
(5) In this connection, it is expedient to take into account also some other related experimental results, for instance (Stolyarova et al., 2009; Riedel et al., 2009; Riedel et al., 2010; Goleret al., 2013; Jones et al., 2012; Lee et al., 2012), on the peculiarities of the hydrogenation-dehydrogenation processes in epitaxial graphenes, particularly, in the graphene-substrare interfaces.
(1) The chemisorption processes in the free-standing graphene membranes are related to a non-diffusion-rate-limiting case. They can be described and interpreted within the physical model of the Polanyi-Wigner equation for the first order rate reactions, but not for the second order rate reactions.
The desorption activation energy is of ΔHdes.(membr.)= ?HC-H(membr.) = 2.6 ± 0.1 eV. It coincides (within the errors), in accordance with the Polanyi-Wigner model, with the values of the similar quantities for theoretical graphanes (Table 1A) possessing of a diamond-like distortion of the graphene network. It also coincides (within the errors) with the value of the similar quantity [process III, model “F*” (Table 1B)] manifested in graphitic structures and nanostructures, not possessing of a diamond-like distortion of the graphene network (an open theoretical question).
The desorption frequency factor is of K0des.(membr.) = nC-H(membr.) » 5 × 10¹³ s-1 (Table 1A). It is related to the corresponding vibration frequency for the C-H bonds (in accordance with the Polanyi-Wigner model).
The adsorption activation energy (in the approximation of K0ads. ≈ K0des.) is of ?Hads.(membr.) = 1.0 ± 0.2 eV (Table 1A). The heat of adsorption of atomic hydrogen by the free standing graphene membranes (Elias et al., 2009) may be as (?Hads.(membr.) - ?Hdes.(membr.)) = -1.5 ± 0.2 eV (an exothermic reaction).
(2) The hydrogen chemisorption processes in epitaxial graphenes (Tables 1A, 2 and 3), unlike ones for the free-standing graphene membranes (Table 1A), are related to a diffusion-rate-limiting case. They can be described and interpreted within the known diffusion approximation of the first order rate reactions, but not within the physical models of the Polanyi-Wigner equations for the first or for the second order rate reactions.
The desorption activation energy is of ΔHdes.(epitax.)= 0.5 ± 0.4 eV. The quantity of ?nK0des.(epitax.) is of 5 ± 8, and the per-exponential factor of the desorption rate constant is of K0des.(epitax.)» 1.5 × 10² s-1 (or 5 × 10⁻² – 5 × 10⁵ s-1). The adsorption activation energy (in a rough approximation of K0ads.»K0des.) is of ?Hads.(epitax.) = 0.3 ± 0.2 eV.
The above obtained values of characteristics of dehydrogenation of the epitaxial graphenes can be presented as ΔHdes.~ Qapp.I and K0des. ~ (D0app.I / L2), where Qapp.I and D0app.I are the characteristics of process I (Table 1B), L ~ dsample, that is, being of the order of diameter (dsample) of the epitaxial graphene samples. The diffusion-rate-limiting process I is related to the chemisorption models “F” and “G” (Figure 4). These results unambiguously point that in the epitaxial graphenes the dehydrogenation processes are rate-limiting by diffusion of hydrogen, mainly, from chemisorption “centers” [of “F” and/or “G” types (Figure 4)] localized on the internal graphene surfaces to the frontier edges of the samples. These results also point that the solution and the diffusion of molecular hydrogen occurs in the interfaces between the graphene layers and the substrates. It differs from the case of the graphene neighbor layers in graphitic structures and nanostructures, where only atomic hydrogen solution and diffusion can occur (process III, model “F*”, Table 1B). Such an interpretation (model) is direct opposite, relevance to the supposition (model) of a number of researchers, those believe in occurrence of hydrogen desorption processes, mainly, from the external epitaxial graphene surfaces.And it is direct opposite to the supposition-model of many scientists that the diffusion of hydrogen along the graphene-substrate interface is negligible.
(3) The possibility, and particularly, the physics of intercalation of a high density molecular hydrogen (up to solid H2) in closed nanoregions, in hydrogenated GNFs have been discussed, in connection to the analytical results (Tables 1 to 3) and the empirical facts considered in this paper.
It is relevant for developing of a key breakthrough nanotechnology of the hydrogen on-board efficient and compact storage (Figure 25) - the very current problem.
Such a nanotechnology may be developed within a reasonable (for the current hydrogen energy demands and predictions) time frame of several years. International cooperation is necessary.
The author(s) have not declared any conflict of interest.
The authors are grateful to A. Yürüm, A. Tekin, N. K. Yavuz and Yu. Yürüm, participants of the joint RFBR-TUBAK project, for helpful and fruitful discussions. This work has been supported by the RFBR (Project #14-08-91376 CT) and the TUBITAK (Project # 213M523).
REFERENCES
|
Akiba E (2011). Hydrogen related R&D and hydrogen storage materials in Japan. In: Materials of Int. Hydrogen Research Showcase 2011, University of Birmingham, UK, April 13-15, 2011; the UK-SHEC.
View
|
|
|
Balog R, Jørgensen B, Wells J, Lægsgaard E, Hofmann P, Besenbacher F, Hornekær L (2009). Atomic hydrogen adsorbate structures on graphene. J. Am. Chem. Soc. 131(25): 8744-8745.
Crossref |
|
|
Banhart F, Kotakovski J, Krasheninnikov AV (2011). Structural defects in graphene (Review). ACS Nano. 5(1):26-41.
Crossref |
|
|
Bauschlicher CW(Jr), So CR (2002). High coverages of hydrogen on (10.0), (9.0) and (5.5) carbon nanotubes. Nano Lett. 2(4):337-341.
Crossref |
|
|
|
Bazarov IP (1976). Thermodynamics. "Vysshaya Shkola", Moscow. |
|
|
|
Bocquet FC, Bisson R, Themlin JM, Layet JM, Angot T (2012). Reversible hydrogenation of deuterium-intercalated quasi-free-standing graphene on SiC(0001). Phys. Rev. B - Condensed Matter Mater. Phys. 85(20):article # 201401. |
|
|
Boukhvalov DW, Katsnelson MI, Lichtenstein AI (2008). Hydrogen on graphene: total energy, structural distortions and magnetism from first-principles calculations. Phys. Rev. B. 77:035427-1-7.
Crossref |
|
|
Brito WH, Kagimura R, Miwa RH (2011).Hydrogen grain boundaries in grapene. Appl. Phys. Lett. 98(21): article # 213107.
Crossref |
|
|
|
Castellanos-Gomes A, Arramel, Wojtaszek M, Smit RHM, Tombros N, Agrait N, Van Wees BJ, Rubio-Bollinger G (2012). Electronic inhomogeneities in graphene: the role of the substrate interaction and chemical doping. Boletin Grupo Espa-ol Carbón. 25:18-22. |
|
|
Castellanos-Gomez A, Smit RHM, Agraït N, Rubio-Bollinger G (2012). Spatially resolved electronic inhomogeneities of graphene due to subsurface charges. Carbon. 50(3): 932-938.
Crossref |
|
|
Castellanos-Gomez A,Wojtaszek M, Arramel, Tombros N,Van Wees BJ (2012). Reversible hydrogenation and bandgap opening of graphene and graphite surfaces probed by scanning tunneling spectroscopy. Small 8(10):1607-1613.
Crossref |
|
|
Chernozatonskii LA, Mavrin BN, Sorokin PB (2012). Determination of ultrathin diamond films by Raman spectroscopy. Physica Status Solidi B. 249(8):1550-1554.
Crossref |
|
|
|
Cockayne E, Rutter GM,Guisinger NP, Crain JN, First PN, Stroscio JA (2011). Grain boundary loops in graphene. Phys. Rev. B- Condensed Matter Mater. Phys. 83(19):article # 195425. |
|
|
Data J, Ray NR, Sen P, Biswas HS, Wogler EA (2012). Structure of hydrogenated diamond-like carbon by Micro-Raman spectroscopy. Mater. Lett. 71:131-133.
Crossref |
|
|
Davydov SYu, Lebedev AA (2012). Epitaxial single-layer graphene on the SiC substrate. Material Science Forum. 717-720:645-648.
Crossref |
|
|
|
DOE targets for on-board hydrogen storage systems for light-duty vehicles (2012). |
|
|
Dzhurakhalov AA, Peeters FM (2011). Structure and energetics of hydrogen chemisorbed on a single graphene layer to produce graphane. Carbon 49:3258-3266.
Crossref |
|
|
Eckmann A, Felten A, Mishchenko A, Brintell L, Krupke R, Novoselov KS, Casiraghi C (2012). Probing the nature of defects in graphene by Raman spectroskopy. Nano Lett. 12(8):3925-3930.
Crossref |
|
|
Elias DC, Nair RR, Mohiuddin TMG, Morozov SV, Blake P, Halsall MP, Ferrari AC, Boukhvalov DW, Katsnelson MI, Geim AK, Novoselov KS (2009). Control of graphene's properties by reversible hydrogenation: evidence for graphane. Science 323(5914):610-626.
Crossref |
|
|
Geim AK, Novoselov KS (2007).The rise of graphene. Nature Mater. 6(3):183-191.
Crossref |
|
|
Goler S, Coletti C, Piazza V, Pingue P, Colangelo F, Pallegrini V, Emtsev KV, Forti S, Starke U, Beltram F, Heun S (2013). Revealing the atomic structure of the buffer layer between SiC(0001) and epitaxial graphene. Carbon 51(1):249-254.
Crossref |
|
|
Gupta BK, Tiwari RS, Srivastava ON (2004). Studies on synthesis and hydrogenation behavior of graphitic nanofibers prepared through palladium catalyst assisted thermal cracking of acetylene. J. Alloys Compd. 381:301-308.
Crossref |
|
|
|
Han SS, Jung H, Jung DH, Choi S-H, Park N (2012). Stability of hydrogenation states of graphene and conditions for hydrogenspillover. Phys. Rev. B – Condens. Matter. Mater. Phys. 85(15):article # 155408. |
|
|
Hornekaer L, ŠljivanÄanin Ž, Xu W, Otero R, Rauls E, Stensgaard I, Lægsgaard E, Hammer B, Besenbacher F (2006). Metastable structures and recombination pathways for atomic hydrogen on the graphite (0001) surface. Phys. Rev. Lett. 96:article # 156104.
Crossref |
|
|
Jiang D, Cooper VR, Dai S (2009). Porous graphene as the ultimate membrane for gas separation. Nano Lett. 9: 4019-4024.
Crossref |
|
|
|
Jones JD, Morris CF, Verbeck GF, Perez JM (2012). Oxidative pit formation in pristin, hydrogenated and dehydrogenated graphene. Appl. Surface Sci. 10: 1-11. |
|
|
|
Karapet'yants MK, Karapet'yants ML (1968). Fundamental Thermodynamic Constants of Inorganic and Organic Substances. "Khimiya", Moscow. |
|
|
Khusnutdinov NR (2012). The thermal Casimir–Polder interaction of an atom with a spherical plasma shell. J. Phys. A: Math. Theor. 45:265-301 [arXiv:1203.2732].
Crossref |
|
|
Kim K, Lee Z, Regan W, Kisielowski C, Crommie MF, Zettl A (2011). Grain boundary mapping in polycrystalline graphene. ACS Nano. 5(3):2142-2146.
Crossref |
|
|
Koepke JC, Wood JD, Estrada D, Ong ZY, He KT, Pop E, Lyding JW (2013). Atomic-scale evidence for potential barriers and strong carrier scattering at graphene grain boundaries: A scanning tunneling microscopy study. ACS Nano. 7(1):75-86.
Crossref |
|
|
|
Lebegue S, Klintenberg M, Eriksson O, Katsnelson MI (2009). Accurate electronic band gap of pure and functionalized graphane from GW calculations. Phys. Rev. B – Condensed Matter Mater. Phys. 79(24): article # 245117. |
|
|
Lee C, Wei X, Kysar JW,Hone J(2008). Measurement of the elastic properties and intrinsic strength of monolayer graphene. Science 321(5887):385-388.
Crossref |
|
|
Lee MJ, Choi JS, Kim JS, Byun I-S, Lee DH, Ryu S, Lee C, Park BH (2012). Characteristics and effects of diffused water between graphene and a SiO2 substrste. Nano Res. 5(10): 710-717.
Crossref |
|
|
Lehtinen PO, Foster AS, Ma Y, Krasheninnikov AV, Nieminen RM (2004). Irradiation-induced magnetism in graphite: A density functional study. Phys. Rev. Lett. 93: 187202-1-4.
Crossref |
|
|
Luo Z, Yu T, Kim KJ, Ni Z, You Y, Lim S, Shen Z, Wang S, Lin J (2009). Thickness-dependent reversible hydrogenation of graphene layers. ACS Nano. 3(7):1781-1788.
Crossref |
|
|
Nechaev YuS (2010). Carbon nanomaterials, relevance to the hydrogen storage problem. J. Nano Res. 12:1-44.
Crossref |
|
|
Nechaev YuS, Veziroglu, TN (2013). Thermodynamic aspects of the stability of the graphene/graphane/hydrogen systems, relevance to the hydrogen on-board storage problem. Adv. Mater. Phys. Chem. 3:255-280.
Crossref |
|
|
Openov LA, Podlivaev AI (2010). Thermal desorption of hydrogen from graphane. Tech. Phys. Lett. 36(1): 31-33.
Crossref |
|
|
Openov LA, Podlivaev AI (2012). Thermal stability of single-side hydrogenated graphene. Tech. Phys. 57(11):1603-1605.
Crossref |
|
|
Palerno V (2013). Not a molecule, not a polymer, not a substrate the many faces of graphene as a chemical platform. Chem. Commun. 49(28):2848-2857.
Crossref |
|
|
Park C, Anderson PE, Chambers A, Tan CD, Hidalgo R, Rodriguez NM (1999). Further studies of the interaction of hydrogen with graphite nanofibers. J. Phys. Chem. B. 103:10572-10581.
Crossref |
|
|
Pimenova SM, Melkhanova SV, Kolesov VP, Lobach AS (2002). The enthalpy of formation and C-H bond enthalpy hydrofullerene C60H36. J. Phys. Chem. B. 106(9):2127-2130.
Crossref |
|
|
|
Pinto HP, Leszczynski J (2014). Fundamental properties of graphene. In: Handbook of Carbon Nano Materials. Volume 5 (Graphene – Fundamental Properties), Eds. F. D'Souza, K. M. Kadish, Word Scientific Publishing Co, New Jersey et al., pp. 1-38. |
|
|
Podlivaev AI, Openov LA (2011). On thermal stability of graphone. Semiconductors 45(7): 958-961.
Crossref |
|
|
Pujari BS, Gusarov S, Brett M, Kovalenko A (2011). Single-side-hydrogenated graphene: Density functional theory predictions. Phys. Rev. B. 84:041402-1-6.
Crossref |
|
|
Riedel C, Coletti C, Iwasaki T, Starke U (2010). Hydrogen intercalation below epitaxial graphene on SiC(0001). Mater. Sci. Forum. 645-648:623-628.
Crossref |
|
|
|
Riedel C, Coletti C, Iwasaki T, Zakharov AA, Starke U (2009). Quazi-free-standing epitaxial graphene on SiC obtained by hydrogen intercalation. Phys. Rev. Lett. 103:246804-1-4. |
|
|
Sessi P, Guest JR, Bode M, Guisinger NP (2009). Pattering graphene at the nanometer scale via hydrogen desorption. Nano Lett. 9(12):4343-4347.
Crossref |
|
|
|
Showcase 2011, University of Birmingham, UK, April 13-15, 2011; the UK-SHEC website:
View
|
|
|
Sofo JO, Chaudhari AS, Barber GD (2007). Graphane: A two-dimensional hydrocarbon. Phys. Rev. B. 75:153401-1-4.
Crossref |
|
|
Sorokin PB, Chernozatonskii LA (2013). Graphene based semiconductor nanostructures. Physics-Uspekhi. 56(2):113-132.
Crossref |
|
|
Stolyarova E, Stolyarov D, Bolotin K, Ryu S, Liu L, Rim KT, Klima M, Hybrtsen M, Pogorelsky I, Pavlishin I, Kusche K, Hone J, Kim P, Stormer HL, Yakimenko V, Flynn G (2009). Observation of graphene bubbles and effective mass transport under graphene films. Nano Lett. 9(1):332-337.
Crossref
|
|
|
Trunin RF, Urlin VD, Medvedev AB (2010). Dynamic compression of hydrogen isotopes at megabar pressures. Phys. Usp. 53:605-622.
Crossref |
|
|
|
Waqar W, Klusek Z, Denisov E, Kompaniets T, Makarenko I, Titkov A, Saleem A (2000). Effect of atomic hydrogen sorption and desorption on topography and electronic properties of pyrolytic graphite. Electrochemical Soc. Proc. 16:254-265. |
|
|
Waqar Z (2007). Hydrogen accumulation in graphite and etching of graphite on hydrogen desorption. J. Mater. Sci. 42(4):1169-1176.
Crossref |
|
|
Watcharinyanon S, Virojanadara C, Osiecki JR, Zakharov AA, Yakimova R, Uhrberg RIG, Johanson LI (2011). Hydrogen intercalation of graphene grown 6H-SiC(0001). Surface Sci. 605(17-18):1662-1668.
Crossref |
|
|
Wojtaszek M, Tombros N, Garreta A, Van Loosdrecht PHM,Van Wees BJ (2011). A road to hydrogenating graphene by a reactive ion etching plasma. J. Appl. Phys. 110(6):article # 063715.
Crossref |
|
|
Xiang H, Kan E, Wei S-H, Whangbo MH, Yang J (2009). "Narrow" graphene nanoribbons made easier by partial hydrogenation. Nano Lett. 9(12): 4025-4030.
Crossref |
|
|
Xiang HJ, Kan EJ, Wei S-H, Gong XG, Whangbo M-H (2010). Thermodynamically stable single-side hydrogenated graphene. Phys. Rev. B. 82:165425-1-4.
Crossref |
|
|
Xie L, Wang X, Lu J, Ni Z, Luo Z, Mao H, Wang R, Wang Y, Huang H, Qi D, Liu R, Yu T, Shen Z, Wu T, Peng H, Oezyilmaz B, Loh K, Wee ATS, Ariando S,Chen W (2011). Room temperature ferromagnetism in partially hydrogenated epitaxial graphene. Appl. Phys. Lett. 98(19):article # 193113.
Crossref |
|
|
Yakobson BI, Ding F (2011). Observational geology of graphene, at the nanoscale (Review). ACS Nano 5(3):1569-1574.
Crossref |
|
|
Yang FH, Yang RT (2002). Ab initio molecular orbital study of adsorption of atomic hydrogen on graphite: Insight into hydrogen storage in carbon nanotubes. Carbon 40:437-444.
Crossref |
|
|
Yazyev OV, Helm L (2007). Defect-induced magnetism in graphene. Phys. Rev. B. 75:125408-1-5.
Crossref |
|
|
|
Yazyev OV, Louie SG (2010).Topological defects in graphene: Dislocations and grain boundaries. Phys. Rev. B - Condensed Matter Mater. Phys. 81(19): article # 195420. |
|
|
Zhang J, Zhao J (2013). Structures and electronic properties of symmetric and nonsymmetric graphene grain boundaries. Carbon. 55:151-159.
Crossref |
|
|
Zhang J, Zhao J, Lu J (2012). Intrinsic strength and failure behaviours of graphene grain boundaries. ACS Nano. 6(3):2704-2711.
Crossref |
|
|
Zhang T, Li X, Gao H (2014). Defects controlled wrinkling and topological design in graphene. J. Mech. Phys. Solids 67:2-13.
Crossref |
|
|
Zhao X, Outlaw RA, Wang JJ, Zhu MY, Smith GD, Holloway BC (2006). Thermal desorption of hydrogen from carbon nanosheets. J. Chem. Phys. 124:194704-1-6.
Crossref |
|
|
Zhou J, Wang Q, Sun Q, Chen XS, Kawazoe Y, Jena P (2009). Ferromagnetism in semihydrogenated graphene sheet. Nano Letters. 9(11):3867-3870.
Crossref |
|
|
Zuettel A (2011). Hydrogen the future energy carrier. In: Materials of Int. Hydrogen Research
|