Full Length Research Paper

ABSTRACT
This study deals with comparison between Dakar station ionospheric’s F2 layer critical frequency (foF2) data and the two subroutines (CCIR and URSI) of IRI-2016 model predictions. Comparisons are made for very quiet geomagnetic activity during the four phases of the solar cycles 21 and 22 (minimum, increasing, maximum and decreasing). Model's predictions are suitable with observed data by day than by night. The accuracy is better during increasing phase and poor during the other solar cycle phases. During minimum, maximum and decreasing solar phases, both model subroutines do not express the signature of E×B and on other hand they express an intense counter-electrojet instead of a medium intensity electrojet.
Key words: Solar cycle, geomagnetic quiet activity, ionosphere electrodynamic phenomena, IRI-2016 model prediction.
INTRODUCTION
Experimental data comparison with a model estimation is common in ionosphere study (Anderson et al., 1987; Bhuyan et al., 2003; Gulyaeva, 2012; Oyeyemi et al., 2005; Zhang et al., 2011). The International Reference Ionosphere (IRI) is a joint undertaking by the Committee on Space Research (COSPAR) and the International Union of Radio Science (URSI), since the 1960s. This international standard's first version parameters of Earth’s ionosphere dates from 1978 (Rawer et al., 1978). The IRI model has gradually improved due to the new data acquired, and also to the advent of better modeling techniques and its latest version is IRI-2016 (Bilitza et al., 2017). IRI model permits several ionospheric parameters determination (e.g. ionosphere layer critical frequencies, ionosphere total electron content (TEC), bottom side thickness (B0) and bottom side shape (B1), electron density (Ne) etc (Bilitza et al., 2014, 2017; Sethi and Mahajan, 2002).
Several authors have worked on the comparison between observed ionospheric parameters and IRI model predictions (Adewale et al., 2010; Bertoni et al., 2006; Chakraborty et al., 2014; Kumar et al., 2014; Liu et al., 2010; Nanéma and Ouattara, 2013; Nanema et al., 2018; Ouattara and Nanéma, 2014; Sethi et al., 2007; Zhang et al., 2010). Like some of these papers, this study focuses on Africa sector and it is extending over all phases (minimum, increasing, maximum and decreasing) of solar cycles 21 and 22 (SC21 and SC22). This paper concerns data obtained from Dakar station (Lat: 14.8°N; Long: 342.6°E) in Senegal, an African Equatorial Ionization Anomaly (EIA) region station. It concerns the comparison of the F2 layer critical frequency (foF2) variation as measured at Dakar station with both IRI-2016 subroutines prediction (CCIR and URSI) over quiet geomagnetic activities throughout solar cycle phases.
MATERIALS AND METHODS
Data used
Three types of data are used in this article: (1) foF2 values measured at Dakar station. This station operated from 1950 to December 1996. Our study covers the period from 1976 to 1995, that is, solar cycles 21 and 22. (2) Zurich sunspot number (Rz) for the influence of solar cycle phases and (3) Mayaud (1971, 1972, 1973, 1980)geomagnetic index, aa for geomagnetic activity impacts. For this study, foF2 diurnal variations are analyzed by considering solar cycle phases impacts.
For comparison with IRI model values we use IRI-2016 version that can be run through the website https://ccmc.gsfc.nasa.gov/modelweb/models/iri2016_vitmo.php.
Geomagnetic activity determination
Based on the strong correlation between geomagnetic index aa and solar wind velocity established by Svalgaard (1977), it is well-known, according to Legrand and Simon , Ouattara and Amory-Mazaudier (2009), Ouattara and Zerbo (2011), Zerbo et al. (2012), that disturbed activities are characterized by  and are classified into three groups: (1) recurrent activity due to solar high wind stream and Corotating interaction Region (CIRs). (2) shock activity due to Coronal Mass Ejections (CMEs) and magnetic clouds and (3) fluctuating activity, consequences of solar heliosheet fluctuation.
To better study the impact of quiet geomagnetic activity on the season; very quiet days are not selected according to the reference limit previously defined by Zerbo et al. (2011)and Gnabahou and Ouattara (2012)but rather with the objective of selecting the quietest days of the considered month. Indeed, for a given month, Mayaud (1980)specifies that the quietest days are obtained by taking  . But here, our quietest days per month are determined by taking the five days with the lowest aa. Daily aa values are obtained from the following website: http://isgi.unistra.fr/data_download.php.
Solar cycle phases determination
Solar cycle phases are determined by using the criteria given by Ouattara (2009), Ouattara and Amory-Mazaudier (2009), Zerbo et al. (2011)and Gnabahou and Ouattara (2012): (1) minimum phase:  , where Rz is the yearly average Zürich Sunspot number; (2) ascending phase:
  and Rz greater than the previous year’s value; (3) maximum phase:
  [for small solar cycles (solar cycles with Sunspot number maximum (Rz max) less than 100), the maximum phase is obtained by considering
  ; and (4) descending phase:
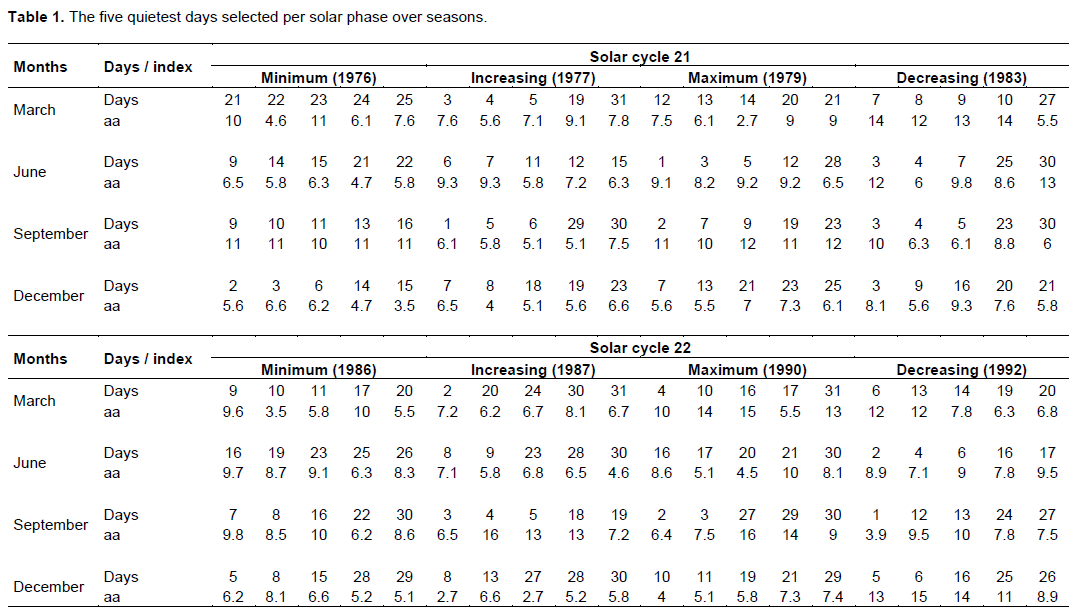
  and Rz less than the previous year’s values. Based on this criterion of splitting the solar phases of both SC 21 and SC 22 concerned by the study, and in order to obtain a good distribution of the data of the study according to solar activity, the first years of each solar phase were considered representative of the solar phase. The retained days per solar cycle phases over selected months are mentioned in Table 1.
Data analysis methods
This article aims to study foF2 hourly variations over solar cycle phases. To appreciate IRI model predictions, we will compare foF2 values from the URSI and CCIR subroutines of IRI-2016 model with those of Dakar station measured data. For this we will use error bars in the graphs given by the following equation:

where V is the variance defined by 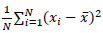 with
with  mean value and N the total number of observations for a particular dataset.
The two types of analyses will be carried out: (1) comparison between foF2 profiles and the five standard profiles established by Faynot and Vila (1979)for African equatorial ionization anomaly (EIA) region and (2) quantitative analysis based on comparison between foF2 observed data profiles with those of both IRI-2016 subroutines.
The five standard profiles established by Faynot and Vila are linked to the nature, the strength or the absence of electric currents in the E layer of ionosphere (Dunford, 1967; Acharya et al., 2010, 2011; Vassal, 1982a, b); these are: "Noon bite out" or “B” profile characterized by a double peak (morning and evening) with a trough around midday; "Reversed" or “R” profile characterized by a single peak at evening; "Morning pic" or “M” profile characterized by a single maximum at morning; "Plateau" or “P” profile characterized by an ionization plateau during daytime and "Dome profile" or “D” profile characterized by a single maximum around noon. These five profiles express respectively signature of a high electrojet, an important afternoon conter-electrojet, moderate electrojet, a weak electrojet and absence of electrojet (Vassal, 1982a, b). Comparison of foF2 measured data with those of both IRI-2016 subroutines will be done by determining relative deviation of foF2 defined by:
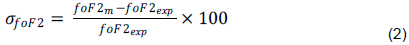
where  are respectively model and experimental foF2 values. σfoF2 is the relative deviation with the following appreciation:
 model overestimates the experimental foF2 value;
 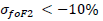 model underestimates the experimental foF2 value;
 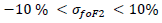 model predictions are suitable.
RESULTS AND DISCUSSION
Figure 1 shows foF2 diurnal time variation in left column and relative deviation percentage  in right column for minimum (panel “a”), increasing (panel “b”), maximum (panel “c”) and decreasing (panel “d”) phases of our both solar cycles. Observed data from Dakar station are represented by solid line while IRI-2016 predictions profiles are in dotted (for URSI) and in dash lines (for CCIR).
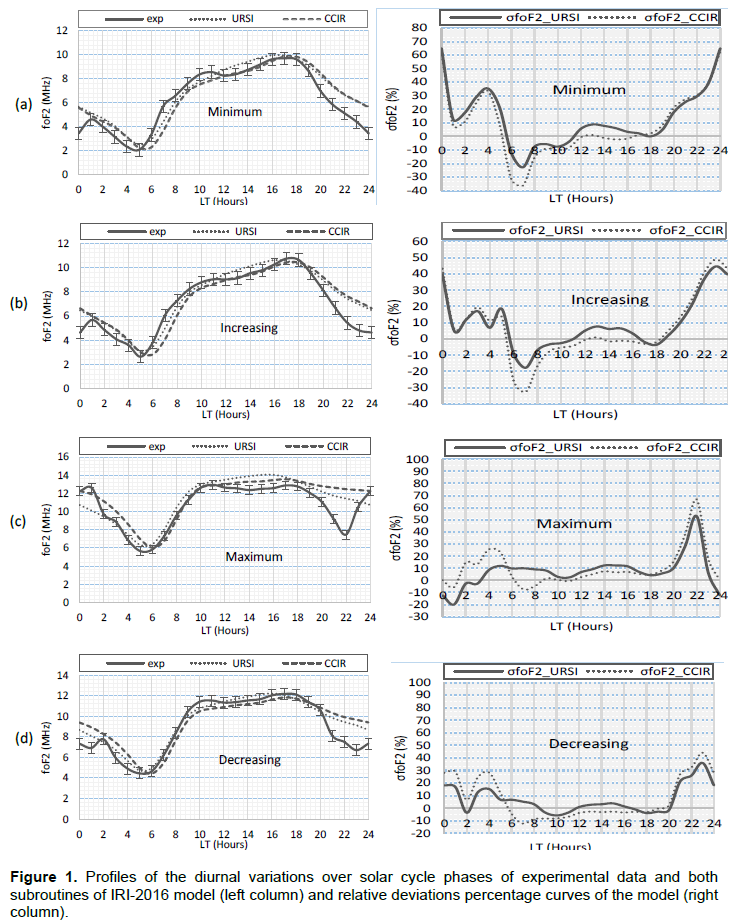
Solar minimum (see panel "a") model curves present an "R" profile while experimental data curve presents a "B" profile with a trough observed at noon and an afternoon peak higher than the morning one. The observed data afternoon peak is very close to those of the model curves. Afternoon peak of experimental data is observed at 1700 LT, simultaneously with that of CCIR and one hour after that of URSI. Experimental data profile shows a high electrojet presence (signature of the E x B drift) associated with an intense counter-electrojet. But only the latter, characterized by afternoon peak, is observed for model predictions. Thus, IRI-2016's both subroutines do not show the upward drift E x B phenomenon at solar minimum.  curves show that both subroutines overestimate the experimental data by night (1900 to 0500 LT), except from 0100 to 0200 LT for CCIR. In addition, one observes experimental data underestimation in the morning for URSI (0600 to 0800 LT) and for CCIR (0600 to 0900 LT). Negative peaks are observed at 0700 LT for URSI (-22.8%) and CCIR (-36.3%) and positive peaks at 0000 LT for URSI (+ 65% ) and CCIR (+62.8%).
Therefore, at solar minimum, CCIR underestimates experimental data more than URSI, while URSI overestimates more than CCIR. Nevertheless, we note a more suitable prediction of the model by day than by night. Indeed, σfoF2's curves present values within ±10% from 0500 to 1900 LT for both subroutines, except from 0600 to 0800 LT for URSI and from 0600 to 0900 LT for CCIR.
During increasing phase (see panel "b"), all profiles are type "R". Experimental data afternoon peak is observed at 1700 LT, simultaneously with that of CCIR and one hour after that of URSI. σfoF2 curves show that both model’s subroutines overestimate experimental data by night (2000 to 0500 LT), except from 0100 to 0200 LT for CCIR and around 0400 LT for URSI. Furthermore, model underestimates measured data in the morning from 0600 to 0900 LT for CCIR and from 0600 to 0800 LT for URSI. Negative peaks are observed at 0700 LT for URSI (-17.8%) and for CCIR (-32.7%) and positive peaks at 2300 LT for URSI (+44.6%) and for CCIR (+49%).Therefore, during ascending phase, CCIR underestimates and overestimates the observed data more than URSI. Nevertheless, one notices a suitable prediction of the model by day than by night. Indeed, σfoF2 curves present values within ±10% in the morning (0500-0600 LT) and from 0900 to 2000 LT for CCIR; and throughout the day (0800-2000 LT) and from 0100 to 0200 LT, 0300 to 0400 LT and 0500 to 0600 LT for URSI.
Solar maximum (see panel "c"), experimental data curve presents a "B" profile with a late trough around 1400 LT while the model curves present "R" profiles. Experimental data afternoon peak is observed at 1700 LT, simultaneously with that of CCIR and two hours after that of URSI. Thus, experimental data profile shows a high electrojet (signature of the vertical drift E×B) presence while model predictions profiles indicate an intense counter electrojet presence. We deduce that IRI-2016 does not reproduce the upward vertical drift E×B at solar maximum. σfoF2 curves show that model's both subroutines overestimate the experimental data by night for CCIR (1900-2300 LT and 0200-0600 LT) and for URSI (2000-2300 LT); and also, before sunrise (0400-0600 LT) and in the afternoon (14-1600 LT) for URSI. Positive peaks are observed at 2200 LT for URSI (+ 52.9) and CCIR (+66.7%). The negative peak of URSI (-19.9%) is observed at 0100 LT and that of CCIR (-7.4%) is observed at 0700 LT. Therefore, at solar maximum, experimental data are more overestimated by CCIR while they are more underestimated by URSI. Nevertheless, one notices a suitable prediction of the model by day than by night. Indeed, σfoF2 curves present values within ±10% from 0200 to 1300 LT (except around 0500 LT) and from 1600 to 2000 LT for URSI and during the night (2300-0200 LT) and all the day (0600-2000 LT) for CCIR.
During decreasing phase (see panel "d") model curves present "R" profiles while experimental data curve presents a "B" profile with a trough around local noon and an afternoon peak higher than that of the morning and very close to those of the model. Experimental data afternoon peak is observed at 1700 LT, simultaneously with that of CCIR, and one hour after that of URSI. Experimental data profile indicates a high electrojet (signature of the upward vertical drift E x B) presence associated with an intense counter-electrojet. Only the latter is indicated by model's curves. Thus, IRI-2016 model does not reproduce the upward vertical drift E x B during decreasing phase. σfoF2 curves show that both subroutines overestimate the experimental data during night for CCIR (2000-0500 LT, except around 0200 LT) and for URSI (2000-0500 LT, except after 0100 to 0300 LT). This overestimation is also observed in the morning (0600-0800 LT) for CCIR. Positive peaks are observed at 2300 LT for URSI (+ 36%) and CCIR (+ 44.1%). URSI's negative peak (-5.8%) is observed at 1000 LT and the one of CCIR (-12.2%) is observed at 0700 LT. Therefore, during decreasing phase, CCIR underestimates and overestimates the experimental data more than URSI. Nevertheless, one can note an appropriate prediction of the model by day than by night. Indeed, σfoF2 curves present values within ±10% at night (0100 to 0300 LT) and throughout the day (0400-2000 LT) for URSI and around 0200LT, at dawn (0500- 0600 LT) and all the daytime (0800-2000 LT) for CCIR.
DISCUSSION
Generally, we observe that experimental data afternoon peak appears simultaneously with that of CCIR subroutine and one hour after that of URSI during all phases of both solar cycles. Also, IRI-2016 model does not reproduce the upward vertical drift E×B when it appears. This result is the same as that found by Ouattara (2013)and Ouattara and Nanema (2014) by comparing the IRI-2007's and the IRI-2012's predictions respectively with Ouagadougou experimental data. But, Guibula et al. (2019)showed, by comparing IRI-2012's predictions with Korhogo experimental data, that URSI well presents the E×B drift during increasing and decreasing solar phases while CCIR does not reproduce it whatever the solar phase. On the other hand, at Dakar station, located on the crest of the equatorial zone, we observe that URSI does not reproduce it.
Quantitative analysis of both subroutines predictions proves that predictions are better by day than by night (precisely before 1900 LT at solar minimum and before 2000 LT for the other solar phases). Time interval during which model predictions are suitable is greater for URSI than for CCIR, except at solar maximum. Model predictions are better for URSI than for CCIR like as been already demonstrated by Guibula et al. (2019)at Korhogo Station. These results prove not only the importance to include the electrodynamic mechanisms of the Equatorial Ionization Anomaly region F2 layer in the IRI model's configuration parameters, but also taking into account the singularity of the equatorial region crest. Indeed, the upward drift being the equatorial zone characteristic phenomenon, it goes without saying that the IRI model, parameterized with characteristic phenomena in particular in the mid-latitude zone, cannot reproduce the E × B drift as well as possible. In addition, it is well known that at night, the predominant recombination processes in the F2 layer contribute to the drop in electron density; on other hand in high latitude regions this electron loss is compensated by the electron precipitation phenomena in the auroral zone. These high latitude regions electrodynamic phenomena could explain IRI-2016's poor prediction by night in equatorial zone.
CONCLUSION
This study shows that IRI-2016 model gives a good prediction of foF2 variation at Dakar Station, especially during day time. Model's peaks match those of observed foF2 data. In addition, model's subroutines do not express the signature of E×B when it appears. They show intense counter-electrojet at the place of high electrojet. Predictions are better during the minimum and ascending solar phases and they are poor during the maximum and decreasing solar phases. We suggest the integration of electrodynamic phenomena characteristic of low latitudes (E × B drift or electrojet, recombination processes, etc.) in the IRI model configuration parameters to improve its accuracy.
CONFLICT OF INTERESTS
The authors have not declared any conflict of interests.
ACKNOWLEDGEMENT
The authors thank Brest Telecom of Bretagne for providing Dakar ionosonde data. Many thanks to ISGI data center for providing data center. They alse thank Dr. Dieter Bilitza and the IRI-2016 web master for permitting model access and model run.
REFERENCES
|
Acharya R, Roy B, Sivaraman MR, Dasgupta A (2010). An empirical relation of daytime equatorial total electron content with equatorial electrojet in the Indian zone. Journal of Atmospheric and Solar-Terrestrial Physics 72:774-780. |
|
|
Acharya R, Roy B, Sivaraman MR, Dasgupta A (2011). On conformity of the EEJ based Ionospheric model to the Fountain effect and resulting improvements. Journal of Atmospheric and Solar-Terrestrial Physics 73:779-784. |
|
|
Adewale AO, Oyeyemi EO, Ofuase UD (2010). Comparison between observed ionospheric foF2 and IRI-2001 predictions over periods of severe geomagnetic activities at Grahamstown, South Africa. Advances in Space Research 45:368-373. |
|
|
Anderson DN, Mendillo M, Herniter B (1987). A semiâ€empirical lowâ€latitude ionospheric model. Radio Science 22:292-306. |
|
|
Bertoni F, Sahai Y, Lima WLC, Fagundes PR, Pillat VG, Becker-Guedes F, Abalde JR (2006). IRI-2001 model predictions compared with ionospheric data observed at Brazilian low latitude stations. pp. 2191-2200. |
|
|
Bhuyan PK, Chamua M, Bhuyan K, Subrahmanyam P, Garg SC (2003). Diurnal, seasonal and latitudinal variation of electron density in the topside F-region of the Indian zone ionosphere at solar minimum and comparison with the IRI. Journal of Atmospheric and Solar-Terrestrial Physics 65:359-368. |
|
|
Bilitza D, Altadill D, Zhang Y, Mertens C, Truhlik V, Richards P, McKinnell LA, Reinisch B (2014). The International Reference Ionosphere 2012-a model of international collaboration. Journal of Space Weather and Space Climate 4:1-12. |
|
|
Bilitza D, Altadill D, Truhlik V, Shubin V, Galkin I, Reinisch B, Huang X (2017). International Reference Ionosphere 2016: From ionospheric climate to realâ€time weather predictions. Space Weather 15:418-429. |
|
|
Chakraborty M, Kumar S, De BK, Guha A (2014). Latitudinal characteristics of GPS derived ionospheric TEC: a comparative study with IRI 2012 model. |
|
|
Dunford E (1967). The relationship between the ionospheric equatorial anomaly and the E-region current system. Journal of Atmospheric and Solar-Terrestrial Physics 29:1489-1498. |
|
|
Faynot JM, Vila P (1979). F region strata at the Magnetic Equator. Annales Geophysicae 35:1-9,. |
|
|
Gnabahou DA, Ouattara F (2012). Ionosphere variability from 1957 to 1981 at Djibouti station. European Journal of Scientific Research 73:382-390. |
|
|
Guibula K, Zerbo JL, Kaboré M, Ouattara F (2019). Critical Frequency foF2 Variations at Korhogo Station from 1992 to 2001 Prediction with IRI-2012. International Journal of Geophysics 2019. |
|
|
Gulyaeva TL (2012). Empirical model of ionospheric storm effects on the F2 layer peak height associated with changes of peak electron density. Journal of Geophysical Research Space Physics 117. |
|
|
Kumar S, Tan EL, Razul SG, See CMS, Siingh D (2014). Validation of the IRI-2012 model with GPS-based ground observation over a low-latitude Singapore station. Earth Planets Space 66:17. |
|
|
Liu L, Wan W, Ning B, Zhang ML, He M, Yue X (2010). Longitudinal behaviors of the IRI-B parameters of the equatorial electron density profiles retrieved from FORMOSAT-3/COSMIC radio occultation measurements. Advances in Space Research 46:1064-1069. |
|
|
Mayaud PN (1971). Une mesure planétaire d'activité magnétique basée sur deux observatoires antipodaux. Annales Geophysicae 27:67-70. |
|
|
Mayaud PN (1972). The aa indices: A 100â€year series characterizing the magnetic activity. Journal of Geophysical Research 77:6870-6874. |
|
|
Mayaud PN (1973). A hundred year series of geomagnetic data, 1868-1967: indices aa, storm sudden commencements. IAGA Bull. 33:256. |
|
|
Mayaud PN (1980). Derivation, meaning, and use of geomagnetic indices. Wash. DC Am. Geophys. Union Geophysical Monograph Series 22. |
|
|
Nanema E, Gnabahou DA, Zoundi C, Ouattara F (2018). Modeling the Ionosphere during Quiet Time Variation at Ouagadougou in West Africa. International Journal of Astronomy and Astrophysics 8:163. |
|
|
Nanéma E, Ouattara F (2013). HmF2 quiet time variations at Ouagadougou and comparison with IRI-2012 and TIEGCM predictions during solar minimum and maximum. Archives of Applied Science Research 5:55-61. |
|
|
Ouattara F (2009). Relationship between geomagnetic classes' activity phases and their occurrence during the sunspot cycle. Annales Geophysicae 52:107-116. |
|
|
Ouattara F (2013). IRI-2007 foF2 predictions at Ouagadougou station during quiet time periods from 1985 to 1995. Archives of Physics Research 4:12-18. |
|
|
Ouattara F, Amory-Mazaudier C (2009). Solar-geomagnetic activity and Aa indices toward a standard classification Journal of Atmospheric and Solar-Terrestrial Physics 71:1736-1748. |
|
|
Ouattara F, Nanéma E (2014). Quiet Time foF2 Variation at Ouagadougou Station and Comparison with TIEGCM and IRI-2012 Predictions for 1985 and 1990. Physical Science International Journal 892-902. |
|
|
Ouattara F, Zerbo JL (2011). Ouagadougou station F2 layer parameters, yearly and seasonal variations during severe geomagnetic storms generated by coronal mass ejections (CMEs) and fluctuating wind streams. International Journal of Physical Sciences 6:4854-4860. |
|
|
Oyeyemi EO, Poole AWV, McKinnell L (2005). On the global model for foF2 using neural networks. Radio Science 40:1-15. |
|
|
Rawer K, Bilitza D, Ramakrishnan S (1978). Goals and status of the International Reference Ionosphere. Reviews of Geophysics 16:177-181. |
|
|
Sethi NK, Mahajan KK (2002). The bottomside parameters B0, B1 obtained from incoherent scatter measurements during a solar maximum and their comparisons with the IRI-2001 model. pp. 817-822. |
|
|
Sethi NK, Dabas RS, Das RM (2007). Diurnal and seasonal variation of B0, B1 parameters during high solar activity period at low mid-latitude and their comparisons with IRI-2001 model. Journal of Atmospheric and Solar-Terrestrial Physics 69:767-774. |
|
|
Svalgaard L (1977). Geomagnetic activity: dependence on solar wind parameters. (STANFORD UNIV CALIF INST FOR PLASMA RESEARCH). |
|
|
Vassal J (1982a). Electrojet, contre-électrojet et région F à Sarh (Tchad). Géophysique 3-9. |
|
|
Vassal J (1982b). La variation du champ magnétique et ses relations avec I'électrojet équatorial au Sénégal Oriental. Annals of Geophysics 38:347-355. |
|
|
Zerbo JL, Ouattara F, Zoundi C, Gyébré AMF (2011). Solar cycle 23 and geomagnetic activity since 1868. La Revue CAMES: La Série A 12:255-262. |
|
|
Zerbo JL, Amory Mazaudier C, Ouattara F, Richardson JD (2012). Solar wind and geomagnetism: toward a standard classification of geomagnetic activity from 1868 to 2009. Annals of Geophysics 30:421-426. |
|
|
Zhang DH, Xiao Z, Hao YQ, Ridley AJ, Moldwin M (2011). Modeling ionospheric foF2 by using empirical orthogonal function analysis. (Copernicus GmbH) pp. 1501-1515. |
|
|
Zhang Y, Paxton LJ, Bilitza D, Doe R (2010). Near real-time assimilation in IRI of auroral peak E-region density and equatorward boundary. Advances in Space Research 46:1055-1063. |
|
Copyright © 2024 Author(s) retain the copyright of this article.
This article is published under the terms of the Creative Commons Attribution License 4.0


