ABSTRACT
Studies have been done on the variability of cosmic rays flux during solar quiet days at mid and high latitudes. By using the 5 quietest days for each month, the monthly mean diurnal variation of cosmic ray anisotropy have been derived for the period 1981 to 2007, which covers part of cycles 21, 22 and 23. These quiet days are days during which the sun is relatively magnetically quiet, leading to less anisotropic behaviour in the diurnal flux of cosmic rays measured on the earth surface. Four stations (Rome, Oulu, Inuvik and Thule) were used in this study to understand the important features of the high latitude and mid-latitude diurnal wave, and how solar and geomagnetic activity may be influencing the wave characteristics. Cosmic ray wave characteristics were obtained by discrete Fourier transform (DFT). The mean, diurnal amplitude, phase and dispersion for each month's diurnal wave were calculated and profiled. There was clear indication that the terrestrial effect on the variability of the monthly mean of Cosmic ray count rates was more associated with geomagnetic activity rather than rigidity of the cosmic rays. Correlation of the time series of these wave characteristics (that is, amplitude and phase) with solar and geomagnetic activity index showed better association with solar activity.
Key words: Cosmic rays, Fourier Transformation, solar quiet day, geomagnetic activity solar activity.
Cosmic rays (CR) are high-energy charged particles originating majorly from the outer space. Their variability is a complex phenomenon which occurs all over the heliosphere and depends on many factors. No single solar index, however sophisticated can account for cosmic ray variations (Helen and Evangelos, 2012). Different scientists proposed empirical relations describing the long-term cosmic ray variations based on the joint use of solar and/or heliospheric indices. At first, solar indices such as sunspot number and solar flares were used; later Belov et al. (1999) proposed a multi-parametric description of long-term cosmic ray variations. The flux (count rate) of cosmic rays incident on the earth’s upper atmosphere is varied by two processes; solar wind and earth’s magnetic field. Solar wind purges out magnetized plasma generated by the sun, which decelerates incoming particles as well as excluding some of the particles with energies below about 1 GeV.
The solar wind is not constant due to changes in solar activities; hence the level of variation changes with solar activity. Earth’s magnetic field deflects some of the cosmic rays, giving rise to the observation that the intensity of cosmic radiation is dependent on latitude, longitude and azimuth angle. The geomagnetic field modulates the CR flux through the vertical geomagnetic cut-off rigidity (Pc) which can be adequately described by Stormer’s equation (taking the field to be a dipole):

where ð‘€ is the geomagnetic field dipole moment (in 7.96 Am2), and ðœ†G is the geomagnetic latitude. Cosmic rays play an important role in the solar system and galactic astrophysics. Many researchers have tried to understand the variability of cosmic ray because of their possible effects on geophysical processes. Since cosmic ray (CR) count rates measured on Earth are affected by heliospheric and geomagnetic modulation in addition to atmospheric effects on the flux arriving from outside the heliosphere, the diurnal variation of cosmic rays is the result of a complex combination of the effects of the interplanetary magnetic field (IMF) and geomagnetic field in addition to latitude and altitude of the location of detection on Earth.
The variability of cosmic ray flux on long term and short term basis has been studied extensively by quite a number of authors (Singer, 1952; Pomerantz and Duggal, 1971; Ananth et al., 1993; Okpala and Okeke, 2011; Bazilevskaya et al., 1995; Usoskin and Kalevi, 2001; Kudela et al., 2008; Sabbah and Kudela, 2011; Singh and Badruddin, 2015). The diurnal variation of CR can be characterized by the maximal value (amplitude) and phase (time of the maximal amplitude) in addition to the mean dispersion of the diurnal flux from the harmonic signatures. Simple harmonic analysis has been applied by many authors (Agarwal and Mishra, 2008; Kudela et al., 2008; Kane, 2009; Sabbah and Kudela, 2011; Okpala and Okeke, 2011; Singh and Badruddin, 2015) to understand the nature of diurnal variation of cosmic rays flux. Their statistical association with different possible drivers have also been investigated. Important findings on the solar modulation of cosmic rays are described next.
SOLAR MODULATION OF COSMIC RAYS
As expected, the sun is a dominant contributor to diurnal cosmic ray flux and atmospheric effects are expected to play significant role in the seasonal variation (Pomerantz and Duggal, 1971). Bazilevskaya et al. (1995) studied the relationship between the galactic cosmic ray intensity and the sunspot distribution. A satisfactory relationship was found between a solar activity index (that is, É³Φ index) and the galactic cosmic ray (GCR) intensity over more than three solar cycles. This product of the number of sunspot groups ɳ and their mean heliolatitude Φ (that is, É³Φ index) also describe the GCR behavior rather well. The good correlation between the time dependence of the heliolatitude (Φ) and the HCS tilt during 1983 to 1988 enabled Bazilevskaya et al. (1995) to infer that these parameters are controlled by the large-scale solar magnetic field.
Tiwari et al. (2011) studied the relationship of cosmic rays with solar activities. They suggested that the modulation of galactic cosmic rays should have a significant component controlled by the state of the interplanetary magnetic fields as they are transported out from the sun and hence there should be a solar cycle effect on the drift of the cosmic rays in the heliosphere. This was corroborated recently by many other studies (Chillingarian and Mailyan, 2009; Okpala et al., 2015; Kudela and Sabbah, 2016). Recently, Thomas et al. (2017) studied the diurnal variation of cosmic rays using decadal data. They observed common polarity effects in the amplitude of the diurnal variation for all neutron monitors used in their study.
Cosmic ray variability
Kudela et al. (2008) studied long term behaviour of the diurnal wave of cosmic ray anisotropy in relation with interplanetary magnetic field. Attempts to understand the cause and effects of the relationship between cosmic ray diurnal wave anisotropy and geomagnetic/interplanetary fields is still an active area of research (Sabbah and Kudela, 2011). Singh and Badruddin (2015) studied the short term oscillations (≤ 1 solar cycle rotation) of the solar wind parameters, galactic cosmic rays and geomagnetic indices during the solar minimum between cycles 22/23 and 23/24. They reported 7.1 days, 5.5 days, 4.4 days and 3.3 days oscillations in solar wind parameters (IMF, Bz and Ey) and geomagnetic disturbance proxies (Dst and AE) during relatively quiet periods.
These quasi periodicities are likely related to the period of solar wind structures bounded with the solar magnetic field polarity, IMF and solar wind characteristics were earlier reported by Sabbah (2007). The complexity of the spatial structure of the interplanetary magnetic field (IMF) and its evolution within the heliosphere, in addition to the changes in the geomagnetic field, causes variability in contribution to the quasi-periodic variations in cosmic ray. The solar activity and solar magnetic field cyclicities contribution to the quasi periodicity of signals in CR is particularly important for long term studies (Kudela and Sabbah, 2016). The different roles of the IMF on diurnal waves of cosmic rays during disturbed and quiet conditions are not well established. For instance, low energy galactic cosmic rays with energies below few tens of GeV move mostly along lines of IMF and their intensity should peak at time of best connections of solar magnetic field with geomagnetic field (Chillingarian and Mailyan, 2009).
During disturbed conditions, the evolution of the IMF is well studied and cosmic ray count rates are known to undergo established transient phenomena like ground level enhancements and Forbush effects. Studying the evolution of IMF during quiet condition is of importance for a better understanding of the effect of the IMF on the diurnal flux of cosmic rays. Firoz (2008) observed narrower distribution of IMF total magnetic field and its polarity during quiet days (when compared with disturbed days). In addition, the northward component of the IMF Bz tend to dominate during quiet period. This suggests that the quiet day distribution indicates periods of less powerful interplanetary shock waves as to affect the magnetic field of the earth.
The five international quiet days are believed to be better optimized for long term and short term studies of daily variation (Kumar et al., 1998). Firoz (2008) observed differences between days with low (quiet) and high (disturbed) diurnal waves of cosmic rays; the major difference being in the distribution of phase. According to Kudela et al. (2008), the amplitude to average ratio is a useful parameter for understanding the diurnal wave contribution to cosmic ray time signal on long term scales. However not much work has been done to understand the diurnal cosmic flux association with heliospheric forcing and geomagnetic activity. The purposes of this study therefore is to investigate the features of temporal and spatial variability of mid and high latitude cosmic ray flux during quiet geomagnetic conditions and determine solar activity dependent features of the amplitude and phase of cosmic rays diurnal variation.
The data used for this project was obtained from Space Physics Interactive Data Resource (SPIDR) (
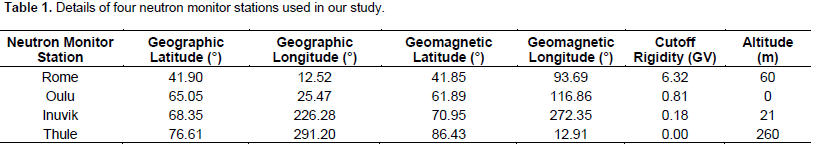
http://spidr.ngdc.noaa.gov/). Table 1 shows the details of four (4) cosmic ray Neutron Monitor (NM) stations used in this work. Data used in this work comprise cosmic ray count rate from four (4) Neutron Monitor stations (Rome, Oulu, Inuvik and Thule), solar and geomagnetic activity index. The sunspot number is used here as an index of solar activity. The aa index represents the geomagnetic activity level at an invariant magnetic latitude at about 50 degrees. The daily values of the aa index are obtained from an average of the 8 values (obtained from 3-hourly interval values).
Theory and method of data analysis
In this work, the five international quietest days were employed. These days are believed to experience the least geomagnetic disturbance in a month. It is assumed in this work, that using these quiet days has the advantage of eliminating transient variations of cosmic rays (Ground Level Enhancement and Forbush Decreases) from the study. The hourly means of the five (5) quietest days were used to obtain the diurnal profile for each month. Thus one-thousand, six hundred and twenty (1,620) quietest days were used to obtain the diurnal profile for 324 months (or 27 years) which were considered in this study. Equation 2 describes the intensity (I) of hourly means of the five (5) quietest days;
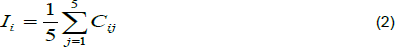
Ci is the raw cosmic ray count rate for a particular hour I, and
j = 1 to 5 refers to the 5 international quietest days.
The monthly mean count rate, diurnal amplitude, diurnal phase and dispersion of the quiet days cosmic ray count rate for the four stations were obtained from Discrete Fourier Transform (DFT) performed on the complex diurnal time series data. Cosmic ray intensity (CRI) at the time ti can be represented by the DFT equation (Equation 3).

where a0 is the monthly mean count rate, rn is the diurnal amplitude and ɸn is the phase of CR.
In this work, the first harmonic from our Discrete Fourier Transform was considered. Equation 4 is the dispersion relation; a measure of the fit of Equation 3.
where Ci, is the measured data point at time i, n = 24 (h).
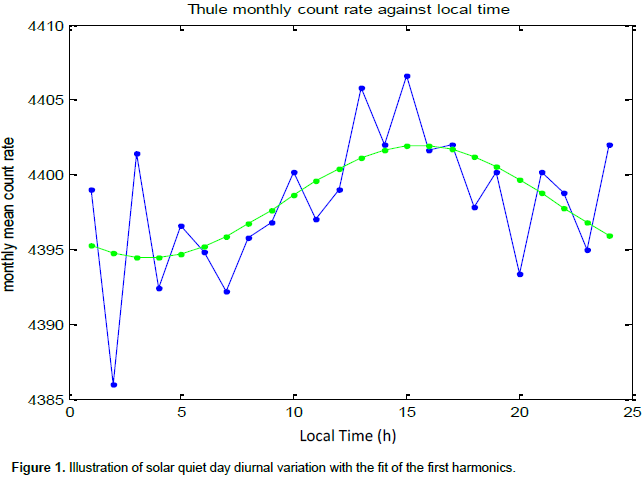
Equation 4 is a measure of quality of fit for Equation 3, and is important for investigating the diurnal deviations of cosmic ray intensity. Figure 1 illustrates the monthly square diurnal variation with the fit of the first harmonic. The count rates for all stations were normalized such that the value of the mean of October, 2007 was 100%. This is to reduce the effect of the differences in the instrument from one station to the other. The profile of the monthly mean count rates is shown in Figure 2. The monthly mean of the daily sunspot number and aa index were obtained, representing solar activity and geomagnetic activity, respectively.
Their linear correlations with the monthly mean count rate and amplitude were obtained. The correlation coefficient between two independent variables x and y is given by Equation 5.

Where: n is number of variables, = mean of x dataset (that is, x1, x2…..xn), = mean for y dataset (that is, y1, y2…..yn).
These correlations were obtained at 0.05 significance level. Student T-test (Equation 6) was carried out to determine the significance of the correlations.

= Mean of first dataset.
= Mean of second dataset.
S1 = Standard deviation of first dataset.
S2 = Standard deviation of second dataset.
n1 = Number of values in the first dataset.
n2 = Number of values on the second dataset.
The partial correlation between two variables x and y, when controlling for the effect of a third variable z is given by Equation 7.
Where rxy, rxz, and ryz are the respective correlation coefficients between x and y, x and z, and y and z.
To understand the solar cycle dependency of the phase of the quiet day diurnal flux, the period 1981 to 2007 was divided into 5 periods vis; Solar minimum 1 = phase hours of (1985 + 1986 + 1987); Solar minimum 2 = phase hours of (1995 + 1996 + 1997); Solar minimum 3 = phase hours of (2006 + 2007); Solar maximum 1 = phase hours of (1988 + 1989 + 1990); Solar maximum 2 = phase hours of (1999 + 2000 + 2001). It is expected that any solar cycle dependent variation in phase will show as a shift in the phase.

The time series plots of monthly percentage count rate and amplitude for each station are presented in Figures 2 and 3, respectively. Figure 4 shows the time series plot of the dispersion observed from the transformed data. The dispersion is a measure of how much the fit deviates from the complex wave form. The time series plot of sunspot number have been superimposed on the time series plot of Rome in Figure 2A. Tables 2, 3 and 4 show the inter-station correlation for mean, amplitude and dispersion, respectively. Tables 5 and 6 show the respective mean and amplitude correlation with sunspot number and aurora indices for all stations. The amplitude and phase of quiet time (monthly) mean of the diurnal wave of cosmic ray flux received at four neutron monitor stations has been analysed. The amplitude of the diurnal variation is the maximum displacement obtained after Fourier analysing the discrete dataset, t, while the phase refers to the particular hour of the maximum displacement.


The interest here is to study the trends and features of the cosmic ray solar quiet day variations and their associations with solar and geomagnetic activities. To achieve this, cosmic ray count rate data from the cosmic ray neutron monitor stations has been subjected to harmonic analysis and the time series of the monthly mean, amplitude and dispersion have been obtained. In addition, the phase distributions of the stations diurnal wave have been obtained and are discussed here.Figure 2 shows the monthly mean count rate (in percentage normalized to the value of October, 2007) of the four stations. The figure shows the classical inverse association of cosmic ray count rates with solar activity as can be seen in Figure 2A; low count rate during solar maxima (1988 to 1990, 1999 to 2001) and higher count rates during solar minima (1985 to 1987, 1995 to 1997, 2006 to 2007); which agrees with Balasubrahmanyan (1968).
The sharp peak followed by broad peak after eleven (11) year interval (1985 to 1995) is a validation of the method used and is consistent with the twenty-two (22) year solar activity cycles as reported in earlier works (Hester et al., 2002; Okpala and Okeke, 2011; Kudela and Sabbah, 2016). Figure 3 show strikingly similar temporal variations for all stations with mid-latitude and aurora region stations (Rome and Inuvik) showing more dramatic spatial variation during the solar maxima periods (6A and 6C). The troughs (solar maxima) are usually associated with multiple peaks. The peaks of aurora station (Inuvik) and mid-latitude station (Rome) during solar maxima are more intense than the peaks at Thule and Oulu. The Inuvik NM showed strong variability in the monthly mean profiles especially during the solar maximum period while retaining the general trend of decreases during solar maximum and increased count rate during solar minimums. The quiet time monthly mean values of the normalized CR flux for the four stations generally show similar trends which suggest a common source of modulation.
The amplitude of the diurnal variation did no show similar profiles for all the stations and certainly did not exhibit solar activity dependence. The reason for this could be related to different local forcing for the stations studied. Tables 2 and 3 show the inter-station correlation for the monthly mean count rate and amplitude. Very strong association was observed for the monthly mean count rate of the four stations, ranging from 0.96 to 0.99. We equally observed moderate correlations ranging from 0.47 to 0.70 for the inter-station amplitude correlation. These correlations were significant at 0.05 significant levels. Tables 5 show the correlation between the monthly mean count rate and sunspot number/geomagnetic activity, while Table 6 shows the correlation between amplitude and sunspot number/geomagnetic activity index (aa) for all stations. The geomagnetic activity index correlated negatively and fairly well with monthly mean count rate for all stations. Removing the effect of solar activity (SSN) on their association showed a decrease in the value of their correlation but it was not sufficient to infer that the original association was spurious.
The aa-index correlated weakly with the amplitude. The negative correlation between cosmic rays count rate and SSN has been well established and simply validates the method used in obtaining the parameters. Hence, the correlation obtained in Table 5 which is generally greater than 0.45 at 95% confidence, suggests that the geomagnetic activity affects the mean values of the count rates in spite of the solar activity modulation. There was no evidence to suggest that the cut off rigidity of the stations played a strong role in this consideration (comparing Thule and Rome correlation with aa index). The dispersion is a measure of how the NM count rate deviated from the transformed data. Figure 4 shows the time series plots of the dispersion for the four stations. It is evident that there is similarity between the profiles of Oulu and Rome stations; showing sharp dispersions close to 1989 and 2003. Inuvik and Thule showed lesser dispersion. Solar maxima periods are more dispersed. Inter-station dispersion correlation was poor.
Rome and Oulu showed greater dispersion correlation (with 0.41) as can be seen in Table 4. These observations may be an indication that the dispersion could be more affected by rigidity of the individual stations than earlier thought. However, more analysis is required to better understand these observations. In addition, it is suggested here that during high solar activity, the variation of the high latitude stations could be affected by the funnelling of low energy solar cosmic rays through the cusps to the surface. Charts showing the frequency of phase time (ɸn) for each station used are presented in Figure 5. Rome had a range of phase time between 12th to 16th h with the highest frequency of occurrence in the 14th h. Oulu similarly had varying phase time between 15th to 18th h with the highest frequency of occurrences in the 16th and 17th h. This was similar to our observation in Inuvik which had phase time between 13th to 18th h with the highest frequency of occurrences in the 16th and 17th h. Thule highest frequency of occurrences was in the 14th and 15th h.

To study the solar activity dependent features of the phase time, we grouped the years used in the study into solar maxima and minima periods. The frequencies of the phase time for the various stations are displayed in Figures 6 to 9. Summary of the profiles of the histograms in Figures 6 to 9 is presented in Table 7. From Table 7, comparing solar minima 1, 2 and 3, it was observed that solar minima 1 and 3 have very close phase time for all the stations. Solar minimum 2 phase time is earlier when compared to solar minima (1 and 3). The difference here could be because of the sharp and broad peak nature of these cycles caused primarily by pole reversal of the magnetic field of the sun. For solar maximum 1 and solar maximum 2; we observed that the phase time was quite close with solar maximum 2 coming slightly earlier than solar maximum 1. This shows that the phase time follows a twenty-two (22) year variability pattern thereby giving credence to the solar modulation of cosmic rays count rates.


.png)
.png)
In this work, we have studied the features and properties of cosmic ray (CR) diurnal wave on quiet days to identify their dependence on solar and geomagnetic activities. Four stations (one mid-latitude station, one high latitude station with two aurora region stations) have been employed for this work. The data used covered two and half (2½) solar cycles. The following conclusions were made from the results obtained in this study:
1) The cosmic ray monthly mean count rates in all four stations are highly correlated showing similar temporal variation with marked spatial differences during solar maximum.
2) Quiet-time monthly mean cosmic ray count rate are more associated with solar activity than with geomagnetic activity at both mid and high latitudes. The variability of the amplitude was not associated with either geomagnetic or solar activity in all stations.
3) There was more dispersion during solar maximum period. The diurnal waves of the higher latitude stations (with lesser rigidity) are less dispersive especially during solar active periods.
4) The phase variations tend to follow the twenty-two (22) year solar magnetic activity cycle. It is characterized by a 2 to 6 h change between periods of peak and minimum solar activity.
The authors have not declared any conflict of interests.
The authors are grateful to the two anonymous reviewers for their very helpful comments towards improvising this paper.
REFERENCES
|
Agarwal R, Mishra RK (2008). Modulation of cosmic rays at different cutoff rigidity. Braz. J. Phys. 38:108-116.
Crossref
|
|
|
|
Ananth AG, Vankatesan D, Pillai S (1993). Long term changes in cosmic ray diurnal anisotropy. Solar Phys. 143:187-196.
Crossref
|
|
|
|
|
Balasubrahmanyan VK (1968). Solar activity and the 11-year modulation of cosmic rays. Solar Phys. 7(1):39-45.
Crossref
|
|
|
|
|
Bazilevskaya BA, Krainev MB, Makhmutov VS, Stozhkov YI, Svirzhevskaya AK, Svirzhevsky NS (1995). The relationship between the galactic cosmic ray intensity and the sunspot distribution. Adv. Space Res. 16(9):221-225.
Crossref
|
|
|
|
|
Belov AV, Gushchina RT, Yanke VG (1999). The spectrum of cosmic rays variations during 19-22 solar cycles. Proc. 26th int. cosmic conf. 7:175-178.
|
|
|
|
|
Chillingarian A, Mailyan R (2009). Investigation of diurnal variation of cosmic ray flux in the Beginning of 24th Solar Activity Cycle, proceedings of the 31st ICRC, LODZ, 1-4.
|
|
|
|
|
Firoz KA (2008). On cosmic ray diurnal variations: Disturbed and Quiet days, WDS'08 proceedings of contributed papers, part II, 183-188.
|
|
|
|
|
Helen M, Evangelos P (2012). Long term cosmic ray variability and the CME-index. Adv. in Astron. pp. 1-8.
|
|
|
|
|
Hester J, David B, George B, Ronald G, Bradford S, Howard V, Gary W (2002). 21st Century Astronomy. New York NY: WW Norton & company inc. publishers.
|
|
|
|
|
Kane RP (2009). High amplitude anisotropic events (HAE) in cosmic ray diurnal variation during solar cycle 23. Indian J. Radio Space Phys. 38:189-196.
|
|
|
|
|
Kudela K, Firoz KA, Langer RD, Kollir V (2008). On diurnal variation of cosmic rays: statistical study of neutron monitor data including Lommicky slit. Proc. 21st Eur. cosmic ray conf. 374-378.
|
|
|
|
|
Kudela K, Sabbah I (2016). Quasi-periodic variations of low energy cosmic rays. Sci. China Tech. Sci. 59(4):547-557.
Crossref
|
|
|
|
|
Kumar S, Shrivastava SK, Dubey SK, Richaria MK, Gulati U (1998). Effect of solar poloidal magnetic field reversal on diurnal anisotropy of cosmic ray intensity on quiet days. Indian J. Radio Space Phys. 27:236-240.
|
|
|
|
|
Okpala KC, Okeke FN (2011). Investigation of diurnal and seasonal galactic cosmic ray variation on quite days in two mid latitude stations. Astropart. Phys. 34:878-885.
Crossref
|
|
|
|
|
Okpala KC, Okeke FN, Ugwoke AI (2015). Cosmic ray modulation in high and middle latitudes during solar cycles 22 and 23. Can. J. Phys. 93(1):100-104.
Crossref
|
|
|
|
|
Pomerantz MA, Duggal SP (1971). The cosmic ray solar diurnal anisotropy. Space Sci. Rev. 12:75-130.
Crossref
|
|
|
|
|
Sabbah I (2007). Twenty-seven day variation of galactic cosmic rays. Solar Phys. 245:207-217.
Crossref
|
|
|
|
|
Sabbah I, Kudela K (2011). Third harmonic of the 27 periodicity of galactic cosmic rays: coupling with interplanetary parameters. J. Geophys. Res. Space Phys. 116(A4):2156-2202.
Crossref
|
|
|
|
|
Singer SF (1952). Cosmic rays and the sun's magnetic field: Diurnal variation of cosmic rays and the sun's magnetic field. Nature 170:63-64.
Crossref
|
|
|
|
|
Singh Y, Badruddin P (2015). Solar rotational oscillation and its harmonics in the solar wind, geomagnetic and cosmic ray particles during the last two solar minima. Astrophys. Space Sci. 359:60.
Crossref
|
|
|
|
|
Thomas S, Owens M, Lockwood M, Owen C (2017). Decadal trends in the diurnal variation of galactic cosmic rays observed using neutron monitor data. Ann. Geophys. 35:825-838.
Crossref
|
|
|
|
|
Tiwari RK, Achyut P, Pankaj KS, Sushil KS (2011). Relationship of cosmic rays with solar and geomagnetic activity. Ind. J. Sci. Res. 2(4):15-19.
|
|
|
|
|
Usoskin IG, Kalevi M (2001). Heliospheric modulation of cosmic rays and solar activity during the maunder minimum. J. Geophys. Res. 106(A8):16039-16046.
Crossref
|
|

 The data used for this project was obtained from Space Physics Interactive Data Resource (SPIDR) (http://spidr.ngdc.noaa.gov/). Table 1 shows the details of four (4) cosmic ray Neutron Monitor (NM) stations used in this work. Data used in this work comprise cosmic ray count rate from four (4) Neutron Monitor stations (Rome, Oulu, Inuvik and Thule), solar and geomagnetic activity index. The sunspot number is used here as an index of solar activity. The aa index represents the geomagnetic activity level at an invariant magnetic latitude at about 50 degrees. The daily values of the aa index are obtained from an average of the 8 values (obtained from 3-hourly interval values).


.png)
.png)


