Full Length Research Paper

ABSTRACT
This study examines the effects of elevated humidity on stratospheric ozone content in the tropics, a case study of Nigeria. The specific stations in Nigeria studied with their co-ordinate include Makurdi (7.7°N 8.5°E), Maiduguri (11.9°N 13.2°E), Kano (12.0°N 8.5°E), Port-Harcourt (4.9°N 7.0°E) and Lagos (6.5°N 3.4°E). Using monthly mean stratospheric ozone data from Earth Probe Total Ozone Mass Spectroscopy (EPTOMS) together with humidity and temperature data from the Nigerian Meteorological Agency (NIMET), studies were carried out over the five stations for a period of fifteen years (1998-2012). The results show that elevated humidity cools the stratosphere, slowing down the rate of chemical reactions that destroy ozone, thereby resulting to more ozone amount. Ozone variation is latitude dependent with more variations in station observed in the north. Using Spearman’s Rank Correlation Coefficient analysis, it was equally observed that ozone and temperature are strongly anti-correlated in Port Harcourt, Makurdi and Lagos stations (r = -0.8531, -0.7832, and -0.8759, respectively); and positively correlated in Maiduguri and Kano stations (r = 0.3776 and 0.4965, respectively). The positive correlation may be attributed to the high dehydration of water vapor in those stations. Results also revealed that ozone and humidity are positively correlated (r = 0.9073, 0.9021, 0.7133, 0.7552, and 0.7692), for Port Harcourt, Makurdi, Maiduguri, Lagos, and Kano. Both ozone and humidity attain maximum during wet season and minimum during the dry season in Nigeria. The implication of more humidity in the wet season is due to the evaporation of raindrops and surface puddles. The implication of more ozone concentration in the wet season may be attributed to the transportation of ozone from the influence of Brewer-Dobson Circulation (BDC). Again it was found out that temperature and humidity are negatively correlated. Consequently, our findings show that, at elevated humidity, the surface temperature is low with more stratospheric ozone content.
Key words: Humidity, stratospheric ozone, temperature, rainfall.
INTRODUCTION
Several components of atmospheric phenomena have been identified in ozone observation and used in prior statistical analysis. Ozone (O3) triatomic oxygen is an atmospheric colorless gas that is found from 15 to 35 km above the earth’s surface. Ozone is classified into two based on altitude: as tropospheric ozone known as ‘bad ozone’ due to the air it pollutes and stratospheric ozone known as ‘good ozone’. The good ozone forms a shield to life on earth from the harmful ultraviolet radiation emitted by the sun. The natural shield has been gradually depleted by man-made chemicals like chloro-fluorocarbons (CFCs) emitted in the atmosphere. Ozone varies with location on time scales that range from daily to seasonal.
Humidity plays an important role in both weather and climate. Humidity is the amount of water vapor present in the atmosphere. Water bodies and plants are the sources of water vapor in the atmosphere through evaporation. The heat from the sun (sun’s rays) makes water evaporate from the surface of oceans, seas, and lakes into the air. The greater the water vapor contents in the air, the higher the humidity. Elevated humidity is the increment in the amount of water vapor present in the atmosphere. The maximum amount of water vapor held by the air (humidity) is dependent on the air temperature. Humidity indicates how likely to have precipitation and cloud; since both require water vapor to form. Humidity triggers convection currents that can lead to clouds. At high humidity, water molecules in the vapor combine with other particles like dust, and smoke, among others to form clouds. At low temperature, the water particles in clouds condense into liquid form resulting to precipitation (rain). Rain can make humidity to increase due to the evaporation of raindrops and surface puddles.
The atmospheric activities that cause ozone variations are photochemical processes and dynamical processes (Okoro, 2014). The photochemical processes refer to the production and destruction of ozone and are driven by solar ultraviolet (UV) photochemistry in the upper stratosphere. The dynamical processes refer to how ozone is transported from one location to another by winds and large scale circulation patterns in the atmosphere. Ozone in the stratosphere is created and destroyed by ultraviolet (UV) radiation from the sun. Thus, ozone is created by UV radiation striking molecular oxygen, splitting them into individual oxygen atom, the atomic oxygen then combines with another unbroken oxygen molecule (O2) to form ozone. The ozone molecule is unstable and when UV light hits ozone, it splits into a molecule of O2 and an individual atom of oxygen.
Akinyemi (2011) reviewed the effect of increased humidity on stratospheric ozone by comparing the ozone distribution profiles obtained from the EPTOMS satellite and the ground based Dobson Spectrophotometer at Lagos, Nigeria (lat 6.6°N, long 3.3°E) for the period 1997-2002. The result indicated through a significant positive correlation of 0.53 that as surface relative humidity increases, the total column ozone increases. Data from NIMET for 1980 to 2010 obtained by Salau (2016) provide the opportunity to study the variability in the temperature and relative humidity (RH) within Lagos State. It was proved that temperature and RT are strongly anti-correlated (-0.95). Richard et al. (2014) have reported through seasonal variation that stratospheric ozone varies more in northern tropics than in southern tropics. This is due to inter-hemispheric differences in both the magnitude and phase of seasonal variations in the upwelling and mixing. Furthermore, Evans et al. (Trends in stratospheric humidity and the sensitivity of ozone to these trends, submitted to Geophysical Research, 1998) have observed through a linear trend varying with altitude that increased stratospheric water vapor enhances the ozone increase in the mid stratosphere by approximately 1 to 2%.
Compositional change of water vapor (humidity) could change stratospheric ozone column. An increase in water vapor would increase HOx and thus cause decrease in ozone column in the upper and lower stratosphere (Bodcker and Waigh, 2003). Higher humidity make breathing more difficult particularly for people with asthma as the air get heavier with moisture (Mercola, 2014). Humidity has a major impact on the way planes fly. Elevated humidity decreases air density. Low air density impacts on aircraft performance by decreasing the aircraft lift force and engine thrust. Air density decreases due to elevated humidity, results in fewer oxygen molecules reaching the engine. This effect thus reduces the maximum power output of the engine, thrust created by the propeller, and fewer air molecules traveling across the wings; thereby reducing the maximum lift capability of the wings of the aircraft (Balicki et al., 2014).
Investigations on the effect of elevated humidity on stratospheric ozone content have been carried out only in Lagos, Nigeria due to non-availability of data. Therefore, in order to obtain a wider knowledge on the variation about the effect of elevated humidity on stratospheric ozone content from different stations in Nigeria makes this work becomes very necessary. The research work is carried out in the tropics, Nigeria as a case study where no much study have been done on the effects of elevated humidity on stratospheric ozone content. The specific areas in Nigeria studied include: Makurdi (7.7°N, 8.5°E), Maiduguri (11.9°N, 13.2°E), Kano (12.0°N, 8.5°E), Port-Harcourt (4.9°N, 7.0°E) and Lagos (6.5°N, 3.4°E); these were selected from different stations in Nigeria to ensure even distribution. This work will determine the seasonal variation of stratospheric ozone concentration in Nigeria and also the relationship between ozone variations to humidity/temperature.
METHODOLOGY
Sources of data
The monthly mean stratospheric ozone data for the stations were considered; Makurdi (7.7°N, 8.5°E), Maiduguri (11.9°N, 13.2°E), Kano (12.0°N, 8.5°E), Port-Harcourt (4.9°N, 7.0°E) and Lagos (6.5°N, 3.4°E) which are embedded in different zones in Nigeria, were obtained from Earth Probe Total Ozone Mass Spectroscopy (EPTOMS); this is obtained from a NASA public data: ftp://toms.gsfc.nasa.gov/pub/eptoms/data/zonal_means/ozone/. Humidity and temperature data were obtained from the Nigerian Meteorological Agency (NIMET). The data span is for 15 years (1998-2012).
Theory and method of data analysis
The obtained data were statistically analyzed using MATLAB and Microsoft EXCEL software. Matrix laboratory (MATLAB) software was use to obtain the monthly mean data of stratospheric ozone, humidity, temperature for each of the stations under study by a simple written program. Microsoft EXCEL software was used further for graphics. The yearly mean ozone value was compiled from the monthly values using Equation 1:
where n is the number of months in a year, Yo3 is the yearly values and Mo3i is monthly values.
The statistical analysis carried out was to investigate the relationship between ozone to humidity and temperature within the period of study. This was achieved using Spearman’s rank correlation coefficient (r) of two variables x and y given as:
where di is the difference between the ranks of the corresponding values of x and y, and n is the number of the values.
The percentage variability was calculated for ozone from the following equation:

Further, the significance in the existing relationship between ozone variation and humidity/temperature, and also humidity and temperature was investigated. This was carried out through T-test (testing for the significance of the correlation coefficient, r) which employs the t-distribution formula:
where r is the correlation coefficient, n is the number of the values/sample size, and n-2 is the degrees of freedom.
RESULTS AND DISCUSSION
Variability of stratospheric ozone
Figures 1 to 5 show the seasonal variation of stratospheric ozone in all the stations considered from the period of study (1998-2012).
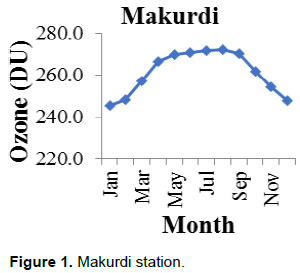
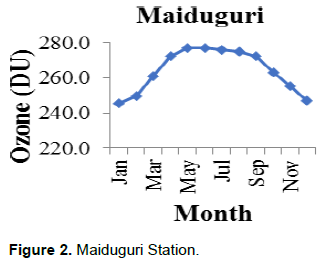
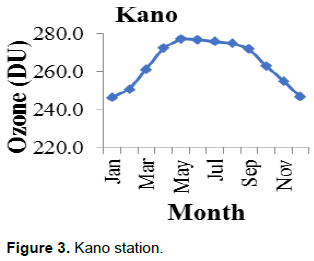
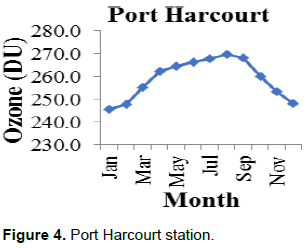
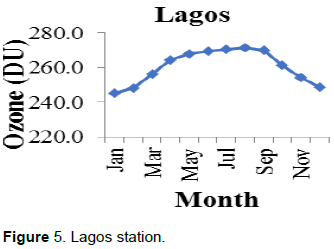
Figures 1 to 5 display the stratospheric ozone concentration over Nigeria. The ozone variation takes the same trend in all the years and stations. From Figures 1, 4 and 5, the monthly ozone amount is observed to peak around August while Figures 2 and 3 show that it peak values about May. Minimum ozone concentration generally is observed from November to January. These peak differences in stratospheric ozone variation coincided with wet and dry seasons observed in Nigeria. The maximum ozone concentration coincides with the tropical rainfall season in Nigeria, which peaks between May and September.
On the other hand, the minimum ozone concentration coincides with dry season in Nigeria, which peaks between November and February. During dry season, harmattan wind is on increase and serves as a significant factor in the transportation of ozone (Okoro, 2014). This could be because the atmospheric heat engine that drives the ETSP is high enough that it could transport stratospheric ozone rich air off the tropics (Nigeria) into the extra tropical region (Akinyemi and Uhuegbu, 2009). Ozone concentration is latitude dependent. Ozone varies more in the states in the northern part of Nigeria (with high latitude) than states in the south (with lower latitudes). This may amount for the average maximum and minimum values observed over Kano and Port Harcourt, respectively. This finding is in the agreement with Richard et al. (2014).
Relationship between stratospheric ozone and maximum temperature
Figures 6 to 10 illustrate the relationship between stratospheric ozone and maximum temperature for the stations considered within the period of study (1998-2012).
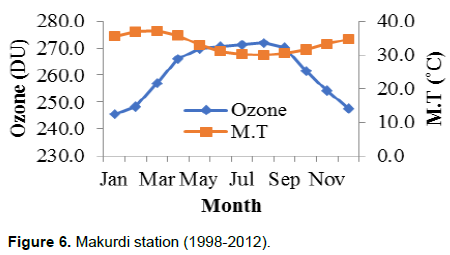
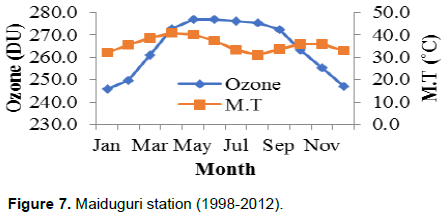
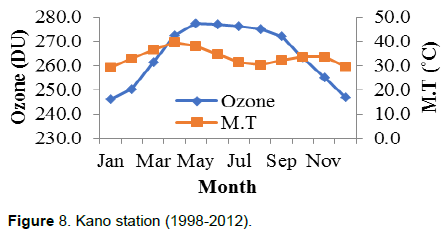
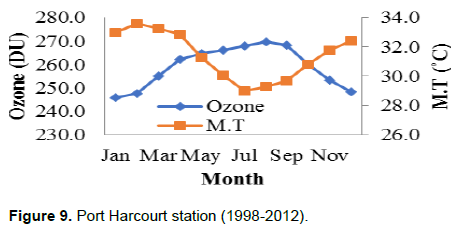
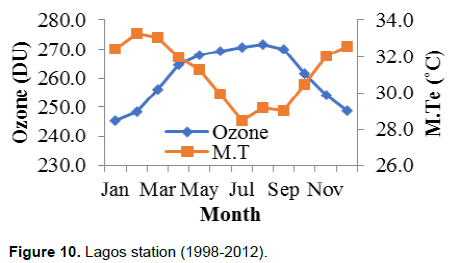
Figures 6 to 10 display the coupling of monthly mean variation of ozone and temperature derived by averaging the yearly values of the study period (1998-2012) for the different stations. From the figures, it is observed that when the temperature is high the ozone concentration is low in all the stations and vice versa; that is maximum temperature coincides with minimum ozone concentration. The variation between ozone concentration and temperature influences on the season obtained in Nigeria. The wet season in Nigeria is characterized by low temperature with high ozone concentration and dry season is characterized by high temperature with low ozone concentration (Akinyemi and Uhuegbu, 2009; Oluleye and Okogbue, 2013). It is inferred from Figure 6 that temperature increases with increase in ozone from January to March attaining a minimum value (29.9°C) in August. In Figures 7 and 8, temperature increases with increase in ozone from January to April attaining a minimum value of 31.1°C for Maiduguri and 30.3°C for Kano in August. Figures 9 and 10 show that temperature increases from January to February attaining a minimum value of 29.0°C for Port-Harcourt and 28.5°C for Lagos in July. It was observed that duration of dry season gets prolonged as one move farther north and away from the equator. Port-Harcourt and Lagos stations which are southern part of Nigeria that attain maximum temperature in February experience heavy and abundant rainfall on time more than Makurdi, Maiduguri and Kano stations found in northern part of Nigeria. This is because the wind (the tropical maritime air mass, MT) responsible for Nigeria’s rainy season enters the country (Nigeria) from February in the southern part of Nigeria and takes longer period to reach the northern part of Nigeria due to harmattan (the tropical continental air mass, CT). The northward prolongment is as a result of the sun’s northward shift from the tropic of Capricorn in the southern hemisphere to the tropic of cancer in the northern hemisphere where the sun is fully overhead (Wikipedia, 1996). During the period of maximum temperature and minimum ozone concentration (dry season in Nigeria), the solar ultraviolet radiation effects are expected to be strongest. The atmospheric heat engine that derives extra-tropical suction pump (ETSP) may be suggested to be at its peak performance in lifting stratospheric ozone off the tropics (Nigeria) towards the extra-tropical zone (in the middle and high latitude of the earth) about 30 and 60° latitude, thus reducing the O3 amount in the tropics (Isikwue and Okeke, 2009).
Relationship between stratospheric ozone and humidity
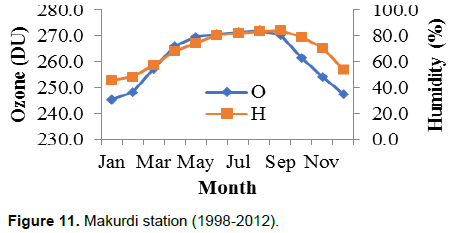
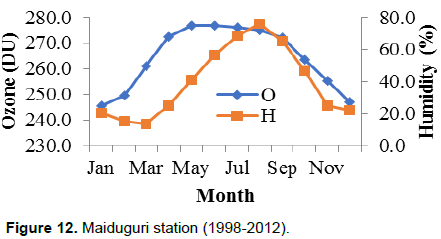
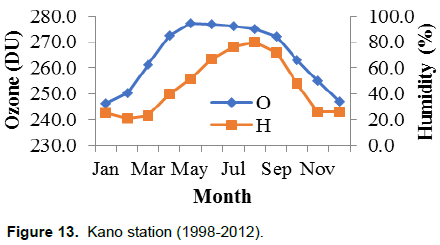
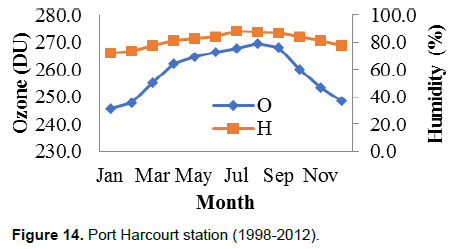
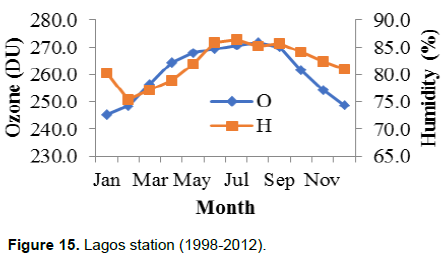
Figures 11 to 15 illustrate the relationship between stratospheric ozone and humidity for the stations considered within the period of study (1998-2012).
In Figures 11 and 14, humidity and ozone amount follow the same trends. Humidity increases with increase in stratospheric ozone and peaks in September and July, respectively. In Figures 12 and 13, humidity increases with increase in ozone concentration from April attaining a maximum value (75.9 and 80.1%) in August. Again, in Figure 15, there is a noticeable increase in humidity from March to July and decrease in August. It also increases in September and then begins to decrease with ozone. The curves have maximum amplitude in wet season with peak in July through September and minimum variations in dry season of Nigeria. Thus, there seems to exist a very strong relationship between humidity pattern and stratospheric ozone variability in Nigeria. The increase of humidity with stratospheric ozone from April to August for Kano and Maiduguri stations indicates that the stations have shorter rainy season period because of the high dehydration of water vapor. Humidity remains higher in the south because of the influence of the sea (Adedayo, 2016). The stations close to the equator are more humid in tropics. This is because the warmer oceans closer to the equator evaporate more, and put more water vapor into the atmosphere (Farlabs, 2013). Elevated humidity in stratosphere occurs mostly in wet season with high ozone concentration when water vapor is high. The implication of more humidity in the wet season is due to the evaporation of raindrops and surface puddles. Previous study by Okoro and Okeke (2017) has shown that the more ozone concentration in the wet season may be attributed to the transportation of ozone from the influence of Brewer-Dobson circulation (BDC). During wet season, the strength of BDC that is responsible for the transportation of ozone rich air from tropical stratosphere into high and mid latitudinal region (extratropical region) is reduced, leading to more ozone concentration (Hu et al., 2017). During the dry season, humidity is very low.
Relationship between temperature and humidity
The relationship between temperature and humidity in all the stations considered in Nigeria for the period of study (1998-2012) was examined using Figures 16 to 20.
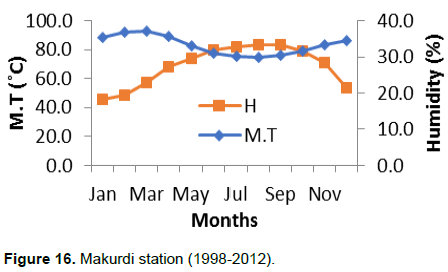
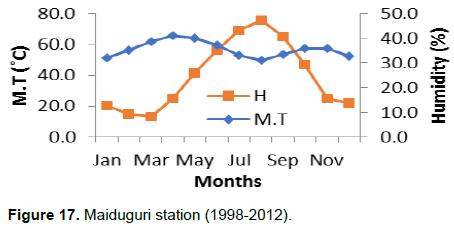
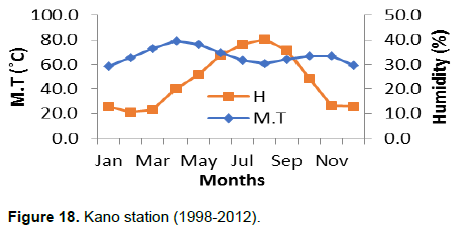
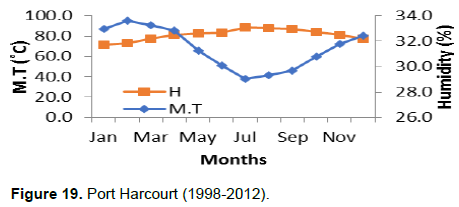
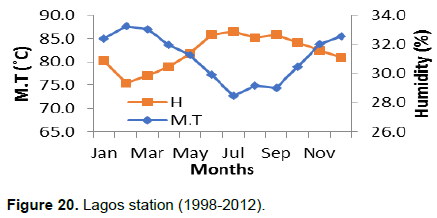
The maximum and minimum monthly mean values of humidity for all the station occur in July through September and January through March, respectively while the temperature is February through April and July through August, respectively. This indicates that when humidity increases the temperature decreases and vice versa. This finding is in agreement with Salau (2016). At elevated humidity, the surface temperature is low with more stratospheric O3 concentration. This occurs during the wet season. Temperature affects humidity, which in turn affects the potential for precipitation. At elevated humidity, water molecules in the vapor combine with other particles like dust and smoke, among others to form clouds (Pelley, 2016). The cloud cover acts as a blockage to sun’s ray during rainy season. This in turn makes the land and the winds above the ground to remain cool. This resulted into low temperature and the water particles in clouds condense into liquid form which resulted into precipitation (rain). This finding is in agreement with Tian et al. (2009) and Shindell (2001).
Analysis of stratospheric ozone
Table 1 shows the yearly mean ozone concentration, maximum and minimum values of the ozone amount, and percentage variability of ozone variation in different stations under study. The average percentage variability of monthly mean ozone concentration for all stations considered throughout the year under study (1998-2012) was 13.58%. This reveals a relatively low concentration in the stratospheric ozone in the atmosphere. It was observed that the maximum monthly mean ozone concentration was recorded in May through August and the minimum monthly mean ozone concentration was recorded during December through February. Among all the stations analyzed, Kano had the most frequent highest average ozone value with particular maximum value of 283.8 DU observed in May 2012, and Maiduguri and Lagos only have the highest ozone value (281.9 and 276.8 DU) in the years 2000 and 2009, respectively. Port-Harcourt had the most frequent lowest average ozone value in 1998, 2000, 2001, 2003, 2007, 2009, 2010 and 2011; while Kano and Maiduguri shared the remaining years under study.
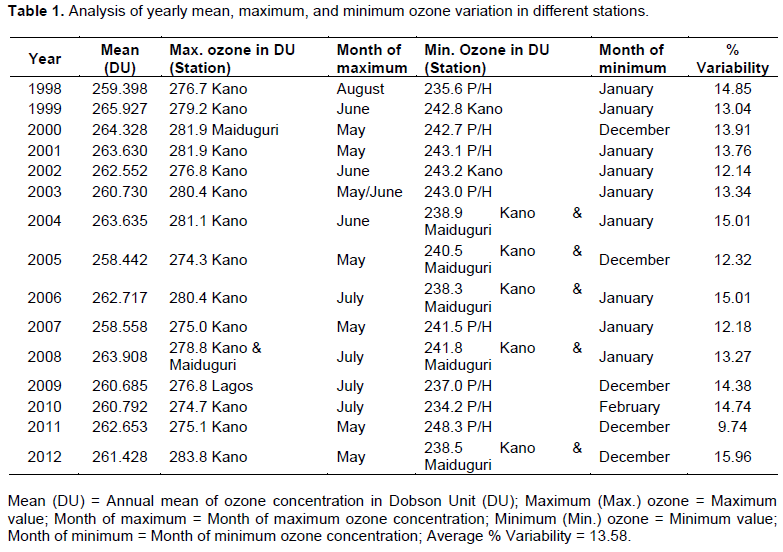
Also, the actual least ozone value 234.2 DU was observed at Port-Harcourt in February 2010. Thus, Kano having the maximum value of ozone concentration shows that ozone concentration is latitude dependent. Station with higher latitude had more ozone concentration than station with lower latitude. The farther away a station is located from the equator, the more the ozone concentration (Okoro and Okeke, 2017). This is due to reduction in the strength of extra-tropical suction pump (ETSP) (Akinyemi, 2007). Also, increase in stratospheric water vapor enhances the ozone increase (Evans et al., 1998; Richard et al., 2014). This could be the reasons why Kano had the average maximum ozone amounts. On the other hand, the minimum ozone concentration that occur in Port-Harcourt shows that the station loose more of the stratospheric ozone to the extra-tropical region through continuous activities of ETSP. This may be attributed to the ETSP being strongest over stations closest to the equator (Akinyemi, 2007). As the solar ultraviolet radiation effects are expected to be strongest to stations closer to the equator (Harris, 2018), the atmospheric heat engine that derives ETSP may be suggested to be at its peak performance in lifting stratospheric ozone off the tropics (Nigeria) towards the extra-tropical zone, thus reducing the O3 amount in the tropics (Isikwue and Okeke, 2009).
Regression analyses
Spearman’s Rank Correlation Coefficient (r) analysis was carried out to investigate the relationship between ozone to humidity and temperature within the period of study as shown in Table 2. For ozone and temperature, we observed a very strong negative correlation coefficient (r = -0.8531, -0.7832 and -0.8759) for Port-Harcourt, Makurdi and Lagos stations, and positive correlation coefficients (r = 0.3776 and 0.4965) for Maiduguri and Kano stations. From the t-test analysis, t-values (t = -5.1706, -3.9833, and -5.7407) for Port-Harcourt, Makurdi and Lagos show that ozone and temperature are significant as the t-value is greater than the critical value  at significant level ρ of 0.05 (5%) and confidence significant level φ of 0.95 (95%). Also t-values (t = 1.2895 and 1.8088) for Maiduguri and Kano show that, ozone and temperature are non-significant. It was observed that negative correlation implies that the ozone concentration increases as the temperature decreases and vice versa. The positive correlation may be attributed to high dehydration of water vapor in those stations. Also, the positive correlation is as a result of minimal atmospheric dynamics occurrences over the stations. This finding is following Huang et al. (2014).
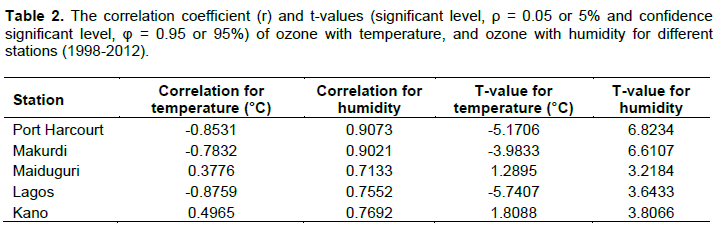
For ozone and humidity, we observed a very strong positive correlation coefficient (r = 0.9073, 0.9021, 0.7133, 0.7552, and 0.7692) and t-value (t = 6.8234, 6.6107, 3.2184, 3.6433, and 3.8066) for Port-Harcourt, Makurdi, Maiduguri, Lagos and Kano, respectively as depicts in Table 2. This implies that the ozone concentration increases as the humidity increases. Hence, ozone and humidity are significant. They follow the same trends. The variation between ozone and humidity influences on the season observed in Nigeria, as rainy season is characterized when ozone and humidity are at maximum and dry season is when the ozone and humidity are at minimum. Though water vapor breaks down in the stratosphere, releasing reactive hydrogen oxide molecules that destroy ozone; elevated humidity cool the stratosphere, slowing down the rates of chemical reactions that destroy ozone. This effect could amount to more ozone. This finding is in agreement with the works of Shindell (2001) and Akinyemi (2011).
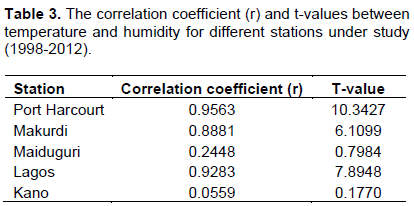
Table 3 depicts a negative correlation coefficient (r = -0.9563, -0.8881, -0.2448, -0.9283, and -0.0559) for Port-Harcourt, Makurdi, Maiduguri, Lagos, and Kano, respectively which implies that the temperature increases as humidity decreases. Again, temperature and humidity are significant with t-value (t = -10.3427, -6.1099, and -7.8948) for Port-Harcourt, Makurdi and Lagos; and also non-significant with t-value (t = -0.7984 and -0.1770) for Maiduguri and Kano.
CONCLUSION
Fifteen years data from 1998 to 2012 were used to investigate the effect of elevated humidity on ozone content in some Nigerian cities. It was observed that the maximum and minimum ozone concentration coincides with the wet and dry seasons in Nigeria, respectively. It was found that ozone is latitude dependent because ozone varies more in the stations in the northern part of Nigeria with higher latitude than stations in the Southern part of Nigeria with lower latitude.
The result revealed that variation in surface air temperatures and humidity has relationship with stratospheric ozone content in tropics (Nigeria). Ozone and temperature are strongly anti-correlated in Port-Harcourt, Makurdi and Lagos stations; and positively correlated in Maiduguri and Kano stations. The positive correlation is attributed to high dehydration of water vapor in those stations. Humidity and temperature are anti-correlated.
On the other hand, ozone and humidity are positively correlated, which implies that humidity increases as ozone concentration increases. Both ozone and humidity attain maximum during wet season and minimum during the dry season in Nigeria. The implication of more humidity in the wet season is due to the evaporation of raindrops and surface puddles. The implication of more ozone concentration in the wet season may be attributed to the transportation of ozone from the influence of Brewer-Dobson Circulation (BDC).
Thus, since elevated humidity cool the stratosphere; slowing down the rates of chemical reactions that destroy ozone which resulted to more ozone concentration, we therefore, conclude that elevated humidity has an influence on stratospheric ozone content across all the stations considered within the period of study (1998-2012).
CONFLICT OF INTERESTS
The authors have not declared any conflict of interests.
ACKNOWLEDGEMENT
The authors wish to express their profound gratitude to Dr. Audu Moses who made the data available from Earth Probe Total Mass Spectroscopy (EPTOMS) for ozone and Nigerian Meteorological Agency (NIMET) for humidity and temperature.
REFERENCES
|
Adedayo KD (2016). Statisticasl Analysis of the Effects of Relative Humidity and Temperature on Radio Refractivity over Nigeria using Satellite Data. African Journal of Environmental Science and Technology 10(7):221-229. |
|
|
Akinyemi ML (2007). The Influence of some Atmospheric Phenomena on Total Ozone Concentration over the Tropics. Australian Journal of Basic and Applied Sciences 1(4):497-505. |
|
|
Akinyemi ML (2011). Comparative Analysis of Total Ozone Data from Satellite EPTOMS and Ground-Based Dobson Instrument at Lagos-Nigeria. Journal of Innovative Research in Engineering and Science 2(3):162-172. ISSN: 2141-8225. |
|
|
Akinyemi MI, Uhuegbu CC (2009). The Interconnectivity of Weather System and Ozone Concentration over West Africa. Journal of Science and Technology 29(3):52-59. |
|
|
Balicki W, Glowacki P, Szczecinski S, Chachurski R, Szczecinski J (2014). Effect of the Atmosphere on the performances of Aviation Turbine Engines pp. 70-73. |
|
|
Bodcker GE, Waigh DW (2003). The Ozone Layer in the 21st Century. 6(6.8):6.1-6.43. |
|
|
Evans SJ, Toumi R, Harries JE, Chipperfield MP, Russel JM (1998). Trends in Stratospheric Humidity and the Sensitivity of Ozone to those Trends. Journal of Geophysical Research 103(D8):8715-8725. |
|
|
Farlabs (2013). The Sun Temperature and Humidity. |
|
|
Harris A (2018). Sun Intensity VS Angle. |
|
|
Hu D, Guo Y, Wang F, Xu Q, Li Y, Sang W, Wang X, Liu M (2017). Brewer-Dobson Circulation: Recent-Past and Near-Future Trends Simulated by Chemistry-Climate Models. 1-13. |
|
|
Huang FT, Mayr HG, Russell JM, Mlynczak MG (2014). Ozone and Temperature Decadal Trends in the Stratosphere, Mesosphere and Lower Thermosphere, Based on Measurements from SABER on TIMED. Annales Geophysicae 32:936-949. |
|
|
Isikwue BC, Okeke FN (2009). Effects of some Atmospheric Parameters on the Dynamics of Lower Stratospheric Ozone in the Low Latitude. The Pacific Journal of Science and Technology 10(1):686-692 |
|
|
Mercola J (2014). Effects of Lower Humidity on Health. |
|
|
Okoro EC (2014). The Significant Effect of Geomagnetic Storm and Contribution of Zonal Wind to Ozone Variation Over the Six Geopolitical Zones of Nigeria. A Ph.D Thesis in the Department of Physics and Astronomy, University of Nigeria, Nsukka 13-85. |
|
|
Okoro EC, Okeke FN (2017). Effects of Zonal Wind on Stratosphric Ozone Variations over Nigeria. International Journal of Remote Sensing 38(6):1665-1681. |
|
|
Oluleye A, Okogbue EC (2013). Analysis of Temporal and Spatial Variability of Total Column Ozone over West Africa using daily Toms Measurements. Atmospheric Pollution Research 4:387-397. |
|
|
Pelley J (2016). Does Cloud Seeding really Work. 22(94):18-21. |
|
|
Richard SS, Darryn WW, Lei W, Luke DO, Anne RD, Paul AN (2014). Seasonal Variation of Ozone in the tropical lower Stratosphere: Southern Tropics are Different from Northern Tropics. Journal of Geophysical Research: Atmospheres. 6196-6206. |
|
|
Salau OR (2016). The Changes in Temperature and Relative Humidity in Lagos State, Nigeria. World Scientific News (WSN) 49(2):295-306. EISSN 2392-2192. |
|
|
Shindell D (2001). Reaction of Ozone and Climate to Increasing Stratospheric Water Vapor. Geophysical Research Letters, NASA- National Aeronautics and Space Administration Goddaard Institute for Space Studies 28:1551-1554. |
|
|
Tian W, Martyn PC, Daren LU (2009). Impact of Increasing Stratospheric Water Vapor on Ozone Depletion and Temperature Change. Advances in Atmospheric Sciences 26(3):423-437. |
|
|
Wikipedia (1996). Geography of Nigeria. |
|
Copyright © 2024 Author(s) retain the copyright of this article.
This article is published under the terms of the Creative Commons Attribution License 4.0


