Full Length Research Paper

ABSTRACT
The anti-microbial efficiency of a composite material formulated from a scrap metal-based (iron (III) sulphate) coagulant and indigenous salt (NaCl) activated biomaterials (coconut shell carbon and counter wood) were evaluated by using the composite materials as coagulant and disinfectant adsorbent by treating borehole water and river samples at point-of-use. The results of the microbial analysis of the untreated and treated ABW, FBW, ERWA, and EBRW samples revealed a 75, 75, 80, and 66.6% bacteria genera removal was obtained during rainy season while there was 100, 66.6, 80, and 100% bacteria genera removal during rainy and dry seasons, respectively. Over 500 isolates of Escherichia coli, Pseudomonas species, Salmonella species and Vibrio cholera; Pseudomonas spp., E. coli, Bacillus species and Salmonella spp.; Shigella species, E. coli, Pseudomonas spp., Salmonella spp. and Staphylococcus species; E. coli, Salmonella spp. and Pseudomonas spp. bacteria genera were identified each in the untreated ABW, FBW, ERWA and EBRW samples during the rainy season, while Bacillus spp. and Citrobacter freundi; Klebsiella pneumoniae, E. coli and Pseudomonas spp.; E. coli, Salmonella spp., Shigella spp., K. pneumonia and Staphylococcus spp.; E. coli and E. faecium bacteria genera were identified during the dry season, respectively. After treatment, 3 and 2 genera of bacteria each were present in 48 and 9 isolates during rainy and dry seasons, respectively. The means of the aerobic bacteria count (ABC) during the two seasons showed no significant variations at p ˃ 0.05 confidence limit.
Key words: Anti-microbial activity, disinfection, coagulant, activated biomaterials.
INTRODUCTION
Water is inevitably essential for the existence and sustenance of life, and human health is directly a function of the potability and access to drinking water. Apart from drinking, human beings use water for domestic, recreational, agriculture and for industrial purposes. It has been estimated that about 75 to 80% of human ill-health is as a result of drinking polluted water (Haseena et al., 2017), and according to 2017 Multiple Indicator Cluster Survey (MICS) reported by Premium Times Daily Newspaper (2020), about 69 million Nigerians have no access to safe drinking water. The Federal Ministry of Water Resources, in 2004, estimated that about 150,000 to 200,000 children die of diarrhea related diseases each year; cholera, typhoid, paratyphoid, bilharzias, and schistosomiasis are all common nationwide (Onwughara et al., 2011).
Among the major pollutants that cause water borne diseases is the pathogenic microorganisms (protozoa, virus and bacteria) (John and Mark, 2013; Akpoveta et al., 2011). Water purification arises from the need to totally remove pollutants and make it potable. Several water disinfection methods in literature include physical processes such as boiling, solar disinfection, adsorption and filtration using powdered or granulated activated carbon, and chemical processes such as coagulation and chlorination (Zhang, 2011; Francis and Amos, 2009).
The use of activated biomaterials (AB) has been an emerging useful technique in the disinfection and adsorption of microorganisms in the drinking water (Nuhu et al., 2018; Misihairabgwi et al., 2014; Okoroigwe et al., 2013). The mechanism of disinfection has been attributed to the van der Waals forces despite the repulsion between the negatively charged surfaces of the AB and that of the microorganisms (Nuhu, et al., 2018). However, positive charge modification of the surface of the biomaterial could results in removal of bacteria by electrostatic interaction between the negative cell surface of the bacteria and the positive charge surface of the biomaterial (Bos et al., 1999). In addition, the modification of biomaterial surface with chemical agents containing titanium oxide could impact antimicrobial activity on the biomaterial (Amin et al., 2014). It could also be through adsorption onto the micropores of the AB.
Water is municipally treated through pre-chlorination, alum coagulation with hydraulic flocculation, sedimentation, dual anthracite, sand filtration and post chlorination (Ahmed et al., 2004). The use of these techniques has gone a long way in reducing water-related diseases in many developing countries. Yet, there is still lack of sustainable provision for municipally treated water and lack of organizational frame work as a result of complexity in operation, inadequate treatment, under-equipped water treatment plants, lack of maintenance culture, and inability to carry out post treatment analyses. As a result of inaccessibility to potable drinking water, people resort to sourcing their drinking water from boreholes, hand dug wells, streams and rivers (Ani et al., 2016; Igwenyi and Aja, 2014; Ami et al., 2012). During rainy season, the overloaded flow and leaching of the decomposed refuse pollute streams and rivers, there is a possible online contamination such as re-growth or ingress of pathogens due to leakage along the distribution pipelines (Nancy et al., 2007).
In many developing countries, drinking water is treated at point-of-use (POU) to mitigate the scarcity of reticulated potable water with a commercial product, “PuR sachet” popularly called WaterGuard, which may contain a mixture of powdered alum and hypochlorite, or only hypochlorite (Sojobi et al., 2015). Many households, especially in the remote communities, due to poverty, do not treat their water before drinking while a handful of households use the waterguard. The alum serves as a coagulant while the hypochlorite acts as a disinfectant. Though the use of waterguard may be cost effective, however, it is not easily accessible to the economically less privileged households in the rural areas. Furthermore, the hypochlorite content reacts with dissolved organic compounds (DOCs) in the water to form disinfection by-products (DBPs) (Nikolaou et al., 2004) such as trihalomethanes which cause bladder cancer, children born small for gestational age, and miscarriages (Xing-Fang et al., 2018). These affect the breast in women as they build up in the fatty tissue, liver, kidney, spleen, and stomach, as well as the nervous, circulatory, reproductive, immune, cardiovascular and respiratory systems (Acra et al., 1988). They may also affect the cognitive abilities, balance and coordination (EPA, 2007). Chloramine, an alternative to chlorine however, forms cyanogens which is also harmful (Bull and Kopfler, 1991). Therefore, this study evaluated the anti-microbial efficiency of prepared iron (III) sulphate coagulant (ISC) and indigenous salt, sodium chloride (NaCl) granulated activated coconut shell carbon (GACSC) and granulated activated counter wood carbon (GACWC) for point-of-use water treatment during rainy and dry seasons.
MATERIALS AND METHODS
Surface water samples were collected at Ebonyi River at Mgbo axis in Abakaliki and Eziyiaku River at Ndiachi Akaeze, Ivo local government area, all in Ebonyi State, while borehole samples were collected at Alex Ekwueme Federal University, Ndufu-Alike Ikwo premises and Assemblies of God Church Avenue, Abakaliki in September, 2018 and early March, 2019 representing rainy and dry seasons, respectively.
Study area
The study area, Abakaliki, AEFUNAI Ikwo, and Akaeze are in Ebonyi North, Central, and South Senatorial zones of Ebonyi State. Mgbo lies on Longitude 8° 15I E and Latitude 6° 22I N, Assemblies of God Church Avenue lies on Longitude 8° 10I E and Latitude 6° 20I N, AE-FUNAI lies on Longitude 8° 17I E and Latitude 6° 8I N, while Ndiachi, Akaeze lies on Longitude 7° 45I E and Latitude 5° 55I N (Figure 1). Two main seasons define the study areas: the dry season which starts from the month of November to March and the rainy season which begins from April to October (Andrew-Oha et al., 2017; Ande et al., 2016; Aghamelu et al., 2013). The peak of the rainy season is between July and September.
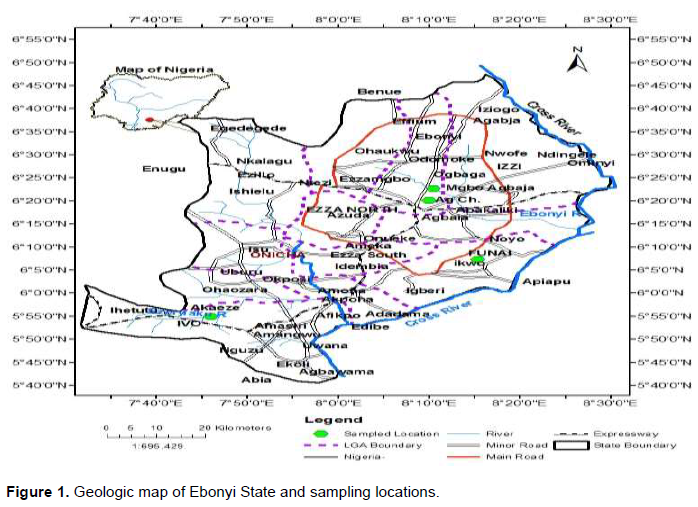
The Ebonyi River, a tributary of the Cross River System, flows through Abakaliki. Ebonyi River serves for domestic purposes for the rural communities and for municipal water treatment and reticulation. Furthermore, manual and motorized borehole water, also serves as sources of drinking water in Ikwo axis and Abakaliki urban. The Ezeiyiaku River traverses all the communities of Akaeze (e.g., Umobor, Ihenta, Iyioji, Akaezeukwu and Mgbede) and is a source for drinking water mainly during the dry season. Bathing, laundry and swimming activities take place in the river during dry season and early rainy season.
Availability of groundwater in Abakaliki and Ikwo is poor due to the underlying shale or aquiclude as the groundwater recharge is not extensive. Okeke et al. (2016) pointed out that the geology of Abakaliki basin is characterized by compression tectonic stresses, and hence, poor primary porosity which suggests very poor movement and storage capabilities. The transmission and storage depend on the thickness and structure of rock formation-shales of the Esu River Formation. Generally, Esu River facies are known to be poor in groundwater recharge (Eyankware et al., 2016). Out of Esu River, Eze-Aku, Agwum Nkporo, and Mamu formations that make up Cross River basin, only Eze-Aku and Agwu formations, are good aquifers (Mgbeojedo et al., 2018).
Sample collection
Collection of water samples followed standard methods (Erin et al., 2018). Plastic bottles (1 L) were washed with warm liquid soap and were thoroughly rinsed with warm de-ionized water. They were then autoclaved at 121°C for 15 min. Stopper with the neck of the bottle was protected with thin aluminium foil and taken to the sampling sites in ice box where they were washed with warm liquid soap and were thoroughly rinsed with warm de-ionized water. They were then autoclaved at 121°C for 15 min. Stopper with the neck of the bottle was protected with thin aluminium foil and taken to the sampling sites in ice box where they were uncovered. In order to obtain representative samples, the tap of the motorized borehole was allowed to run for 5 min after which the bottles were rinsed 3 to 4 times before collecting three replicate samples by 7:20 am. At the sampling point, the river was agitated with the sample bottle, uncapped and dipped about 30 cm below the surface of the water in inverted position. The containers were filled and capped under water and against the direction of the flow. The pH of the water samples were measured in-situ, while the other physicochemical parameters of the water samples including turbidity and electrical conductivity were measured at the laboratory prior to analysis within 48 h and stored in the refrigerator at 4°C prior to treatment. The sampling was carried out during rainy season (September, 2018) and dry season (March, 2019).
Preparations of activated carbon from biomaterials and iron (III) sulphate coagulant from scrap iron
Carbonization and modification of coconut shell and counter wood
The carbonization and activation of the coconut shell (CS) and counter wood (CW) (Cocos nucifera and Afzelia africana) were carried out by adapting the methods of Ami et al. (2012). CS and CW were broken and sieved with Sieve Number 12 (ASTM E 11-87) to obtain 1 to 3 mm particle sizes, and then dried in the oven at 110°C for 4 h. Different ratios of impregnation (1:1, 2:1, 3:1 and 3:2) of the biomaterials were then carried out by boiling separately with 10, 20, 30, 40, 50, 60, 70 and 80% concentrated solutions of indigenous sodium chloride salt (an unrefined local salt prepared by evaporating brine from Uburu salt lake in Ebonyi State into solid state, until the mixtures became pasty). The pasty materials were dried at 110°C for 2 h in the oven, allowed to cool and repeatedly washed with de-ionized water in order to remove traces of activating agent. They were once again dried in the oven at 110°C for another 2 h, and were separately carbonized in a muffle furnace at 450°C for 3 h. The activated biomaterials, after cooling, were separately rinsed with de-ionized water to a neutral pH solution and then dried in oven at 110°C for 3 h.
Synthesis of iron (III) sulphate coagulant
The ISC was prepared by adapting the method of Kakio and Tsukamoto (2012). About 50 kg of degreased and washed scrap iron metal was soaked with enough quantity of 40% concentrated tetraoxosulphate (VI) acid and left to react for 24 h in a capped amber bottle. The resulting ferrous sulphate crystals were removed, washed with enough distilled water and crushed to fine size. Oxidization of the iron (II) sulphate was done by heating the fine crystals with H2O2 solution at 80°C in 500 ml beaker using temperature, and time regulated magnetic hot-plate stirrer until a brownish yellow paste was formed. The iron (III) sulphate paste was then dried in the oven at 120°C for 2 h. Iron (III) sulphate lump formed was later ground into anhydrous powder.
Characterization of the granulated activated biomaterials
Determination of specific surface area (SBET) of granulated activated biomaterials
The composite materials were characterized by nitrogen gas (N2) adsorption at 77°K and surface charge to obtain the pore size distribution, proximate composition and surface charges. The Brunauer, Emmett, and Teller (BET) method was adapted in the assessment of the total surface area of the GACSC and GACWC. Analysis was done using a Micromeritics ASAP 2020 Surface Area and Porosity Analyzer: Norcross, GA 30093-2901, U.S.A. Before the gas adsorption, 0.1 g of each sample was degassed at a constant temperature of 120°C in a vacuum condition for a period of 1.5 h. Nitrogen adsorption isotherms were then measured between a relative pressure (P/P0) range of 0.001 to 1.000.
1/x[(P0/P)-1] = (c -1)(P/P0)/(xmc)+1/(xmc) (1)
where P0 = saturation pressure of the modified biomaterials; P = equilibrium pressure of the modified biomaterials; x = volume of gas adsorbed; xm = volume of the gas adsorbed by the monolayer; c = BET constant given by exp (EI - EL/RT); EI = heat of adsorption for the first layer; EL=heat of adsorption for higher layers.
BET surface areas of the GACSC and GACWC samples were calculated using the BET equation in Equation 1 based on the assumption that the surface area occupied by each physisorped nitrogen molecule was 0.146 nm2 (Ilomuanya et al., 2017).
ST = (xmNs)/v (2)
SBET = (xmNs)/(vw) (3)
Pore size was calculated by using
rp = 2Vliq / SBET (4)
A plot of 1/x[(P0/P) - 1] against (P/P0) gave the slope and intercept used to calculate the mono – layer adsorbed gas quantity, xm and c. The total and specific surface areas, ST and SBET, of the samples were obtained by using Equations 2 and 3, respectively (Lowell et al., 2004).
Determination of proximate composition of granulated activated biomaterials (GAB)
Subhaashree (2011) method was adapted in determining the moisture content, volatile matter, ash content and fixed carbon of the precursor biomaterials.
{(weight before drying in oven – weight after drying) / weight before drying} × 100% (5)
(wt. before carbonization – wt. after carbonization) / wt. before carbonization × 100 (6)
wt. of biomaterials after carbonization / wt. of dried precursor × 100 (7)
The weight percent of water content in the original biomaterials was given by Equation 5 while the percentage weight (wt.) of the volatile matter which escaped during pyrolysis in the improvised furnace was determined using Equation 6. The mass of fixed carbon or carbon yield was calculated using Equation 7.
Determination of surface charges of GAB and prepared coagulant
Ekpete and Horsfall (2011) method was adapted in the determination of surface charges of the GAB and prepared coagulant. Seventeen sets of 100 ml beaker containing 50 ml of 0.1 M potassium chloride (KCl) solution with initial pH values ranging from 2.00 to 10.00 were prepared with 0.1 M NaOH and HCl solutions. A 0.150 ± 0.002 g of adsorbents and coagulant were separately soaked in the initial pH of KCl solutions and allowed to attain equilibrium in 48 h. After the 2 days, the final pH values of the separate content of the beakers were measured.
Determination of surface functional groups of the granulated activated biomaterials
The surface functional characters were also determined by Boehm titration method, Bingzheng (2012). Boehm titration was proposed by Boehm in 1966. It has been generally accepted as a standard wet method for the characterization of surface oxygen complexes on the surface of AB. The method is based on acid-base titration theory that acid and base in aqueous solution react with various basic and acidic sites of AB (Bingzheng, 2012).
Media preparation, biochemical identification, and Gram staining (Gram reaction)
Preparation of the various media (nutrient, mannitol, macconkey and simmons’ citrate agar) used in this study was according to the manufacturer’s instruction and Faria et al. (2017). Bacteria isolated from the water samples were tested in order to identify and confirm the unknown microbes by subjecting the samples to different types of biochemical tests (Tashfia, 2018). Biochemical test including citrate, glucose, lactose and mannitol utilization tests, catalase, oxidase, indole, utilization and motility tests were used to identify the isolates according to the method previously described by Cheesbrough (2006). The results were compared with Berge’s Manual of Determinative Bacteriology (Holt et al., 1994).
Bacteriological analysis of the water sample
Glass wares and stainless part of the filtration apparatus used in the bacteriological analysis were sterilized in hot air oven at 170°C for 1 h. The media used (Macconkey agar and nutrient agar) were prepared according to manufacturer’s guide. It was sterilized by autoclaving at 121°C for 15 min. The media were allowed to cool to around 45°C before transferring into 20 ml sterile Petri dishes, and were also allowed to set before inoculation. The samples were then thoroughly shaken to mix after which two sets of 100 ml of each sample were measured and separately filtered using sterile membrane filters of 0.45 µm. The filters were separately placed on mac Conkey and nutrient agar with the grid side facing upward. Then the agar plates were incubated at 35°C for 24 h after which plates having total colonies ≤200 were selected and counted. The result was recorded as total viable count and total coliform count.
Sedimentation beaker test of prepared coagulant and determination of dose optimization of activated granulated biomaterials
Mbaeze et al. (2017) method was modified in the sedimentation beaker test. A 0.005, 0.010, 0.015, 0.020, 0.025 and 0.030 g of the prepared ISC were separately added to 250 ml, 86.4 nephelometric turbidity unit (NTU) of Ebonyi River water (EBRW) sample in 250 ml beakers during rainy season. The same masses of ISC were used to batch agitate 250 ml, 99.0 NTU of Ezeiyiaku River water, Akaeze (ERWA) sample during dry season. Each of the mixtures was mechanically stirred for 60 min at the water sample’s ambient pH, and allowed to sediment for a period of 60 min. They were then filtered with a cloth (cotton) strainer, and after which the turbidity of the filtrates was measured using Labtech digital turbidity meter (probe). The sedimentation beaker test was aimed at accessing the optimum dose of the coagulant which when used to treat the water samples at POU would give the least values of turbidity.
Evaluation of degree of disinfection of the water samples
Assessment of the disinfection capacity of the developed composite materials was carried out by batch treating the water samples at POU. Five set of doses of GACSC, GACWC and ISC (1.0, 1.5, and 0.025 g), (1.5, 2.0, and 0.025 g), (2.0, 2.5, and 0.025 g), (2.5, 3.0, and 0.025 g) and (3.0, 3.5, and 0.025 g), respectively were separately added to 250 ml of Iyi-udele stream samples (a stream in Abakaliki which receives runoffs of domestic effluents) and were mechanically stirred for 60 min. After settling for another 1 h, they were filtered with prewashed and dried filter cloths. Both the treated and untreated stream samples were analyzed using membrane filtration techniques (APHA et al., 2005).
Total coliform colonies / 100 ml = (coliform colonies counted) (100 ml of sample filtered) (7)
Unit is in colony-forming units (CFU) per 100 ml of original sample (http://www.water.usgs.gov/.../Ch7_1.4pdf).
The Iyi-udele stream samples were used as control samples in order to determine the degree of disinfection and efficacy of the developed composite materials. The optimal doses obtained were then used to batch disinfect the river and borehole water samples at POU. About 20 to 80 or a maximum of 250 colonies of total coliform per membrane was reported using Equation 7.

Percent removal in the mean frequency of occurrence of microorganisms in the water samples was calculated using Equation 8.
RESULTS
Nitrogen adsorption-desorption isotherm and total surface area of activated biomaterial
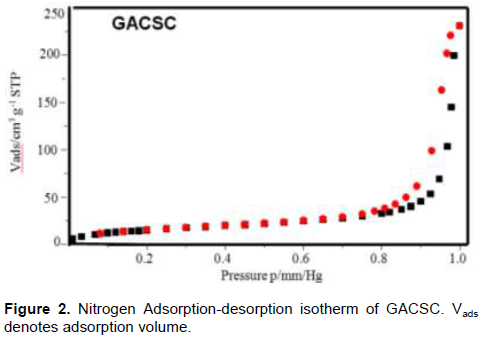
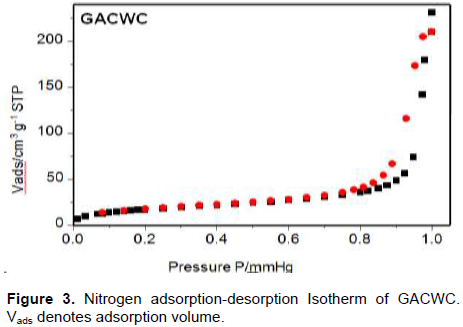
Figures 2 and 3 show the nitrogen adsorption-desorption isotherm of the activated biomaterials at 77°K while the pore/total surface areas and pore size distributions of GACSC and GACWC derived from the standard BET equation at a relative pressure in the range of 0.0 to 1.0 were 52.11 m2/g and 27.37 nm, and 46.26 m2/g and 21.69 nm, respectively.
The results of the proximate analysis of the carbonized biomaterials, coconut shell carbon (CSC) and counter wood carbon (CWC) are presented in Table 1.
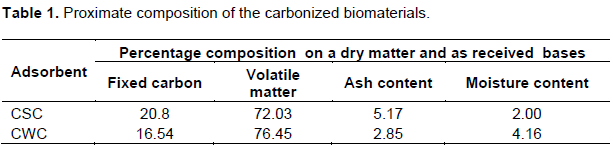
The result of the proximate analysis presented in Table 1 shows that the CSC and CWC recorded percentage fixed carbon, volatile matter, ash content and moisture content of 20.8 and 16.54%, 72.03 and 76.45%, 5.17 and 2.85%, and 2.00 and 4.16%, respectively.
Figure 4 shows the values for the points of zero charge (pHpzc) of GACSC, GACWC and the prepared ISC. The pHpzc of GACSC, GACSC and ICS were recorded at pH 7.0, 7.0 and 2.5, respectively.
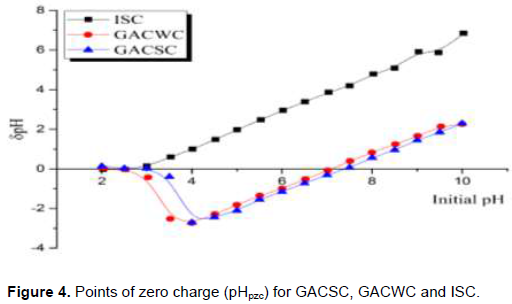
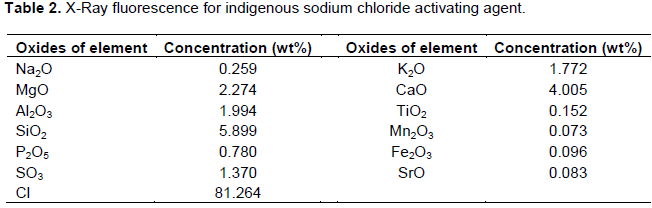
Table 2 shows the x-ray fluorescence of local sodium chloride modifying agent used in the present work. There were 13 different chemical species identified in the local NaCl salt of which chlorine had the highest weight percent of 81.264 wt% while the chemical species with the least concentration, 0.073 wt%, was Mn2O3.
The acidic and basic functional groups on the surfaces of the AB determined by Boehm’s titration method are presented in Table 3.
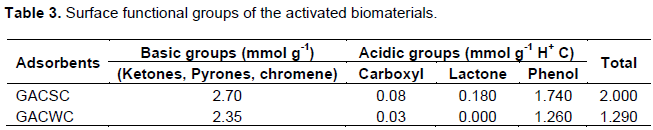
The results showed that total basic and acidic groups on the surface of GACSC were 2.70 and mmol g-1, respectively, while on the surface of GACWC, the total amounts of basic and acidic functional groups were 2.35 and 1.29 mmol g-1. Furthermore, the acidic groups in GACSC and GACWC indicate the presence of carboxyl, lactone and phenol groups with values 0.08, 0.18 and 1.74 mmol g-1, respectively.
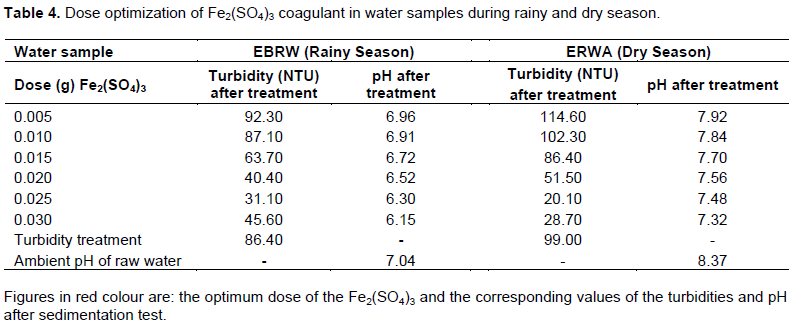
Effect of dose optimization of prepared iron (III) sulphate coagulant
The results obtained for the ISC dose optimization by sedimentation tests during the rainy and dry seasons are presented in Table 4 and Figure 5. For both seasons, the lowest residual turbidities of 31.1 and 20.1 NTU for EBRW and ERWA water samples, respectively, were obtained using 0.025 g of ISC. The maximum percentage reductions in turbidity of the water samples during rainy and dry seasons were consequently recorded to be 64.0 and 79.7 using 0.025 g ISC.
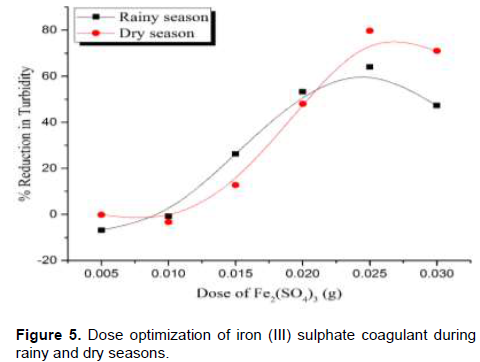
The results obtained for the ISC dose optimization by sedimentation tests during the rainy and dry seasons were presented in Table 4. For both seasons, the lowest residual turbidities of 31.1 NTU and 20.1 NTU for EBRW and ERWA water samples, respectively, were obtained using 0.025 g of ISC. The maximum percentage reductions in turbidity of the water samples during rainy and dry seasons were consequently observed to be 64.0 and 79.7 using 0.025 g ISC.
Electrical conductivity of the water samples
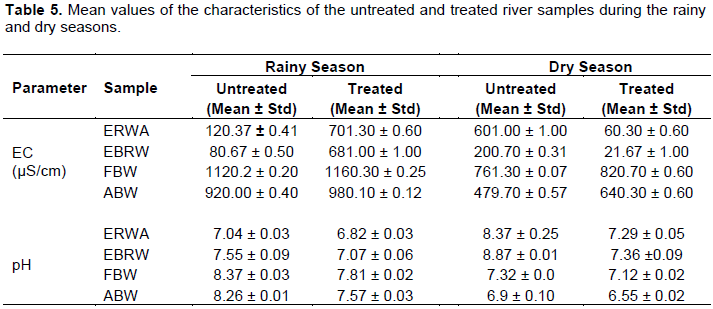
Table 5 presents the EC of both the untreated and treated water samples. The results showed that the FBW samples recorded the highest mean EC values of 1120.2 ± 0.20 and 761.30 ± 0.07 µS/cm for the untreated samples during both seasons. The least mean EC values of 80.67 ± 0.50 and 200.70 ± 0.31 µS/cm were recorded from EBRW samples during both seasons. After the disinfection of the water samples at POU, the highest and lowest mean EC values obtained during the rainy and dry seasons were also observed from FBW and EBRW samples, respectively. The observed mean EC values were 1160.3 ± 0.25 and 820.70 ± 0.6 µS/cm (FBW), and 681.00 ± 1.00 and 21.67 ± 1.00 (EBRW). The highest mean pH values of 8.37 ± 0.03 and 8.87 ± 0.01 were obtained from the untreated FBW and EBRW samples during rainy and dry seasons, respectively. The lowest mean pH values obtained during the rainy and dry seasons, respectively, were observed from ERWA (7.04 ± 0.03) and ABW (6.9 ± 0.10). The mean pH values obtained after treatment at POU during rainy season was the highest from sample FBW (7.81 ± 0.02) while it was the lowest from ERWA (6.82 ± 0.03). At dry season, it was observed to be the highest from EBRW sample (7.36 ± 0.09) while the mean pH value of 6.55 ± 0.02 recorded from sample ABW was observed to be the least.
Effect of disinfection of water samples
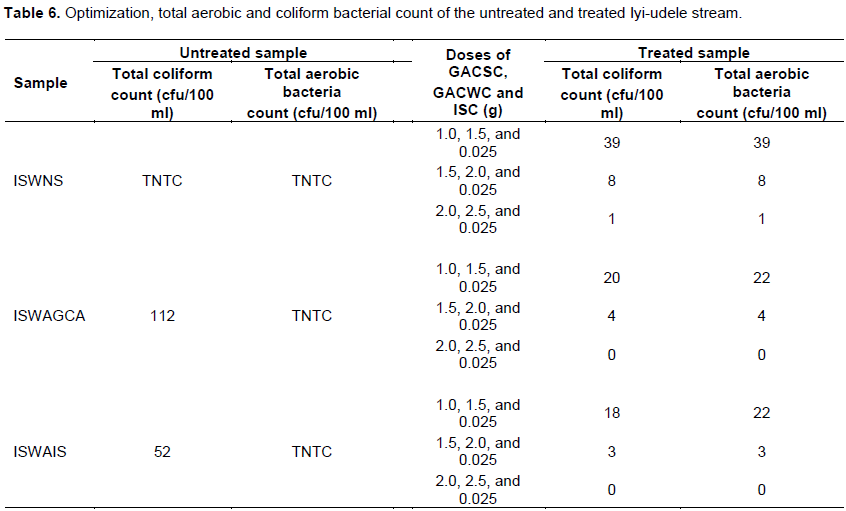
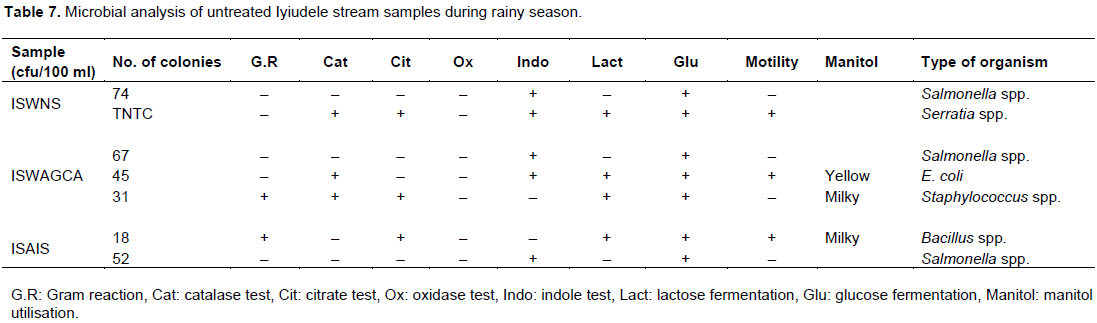
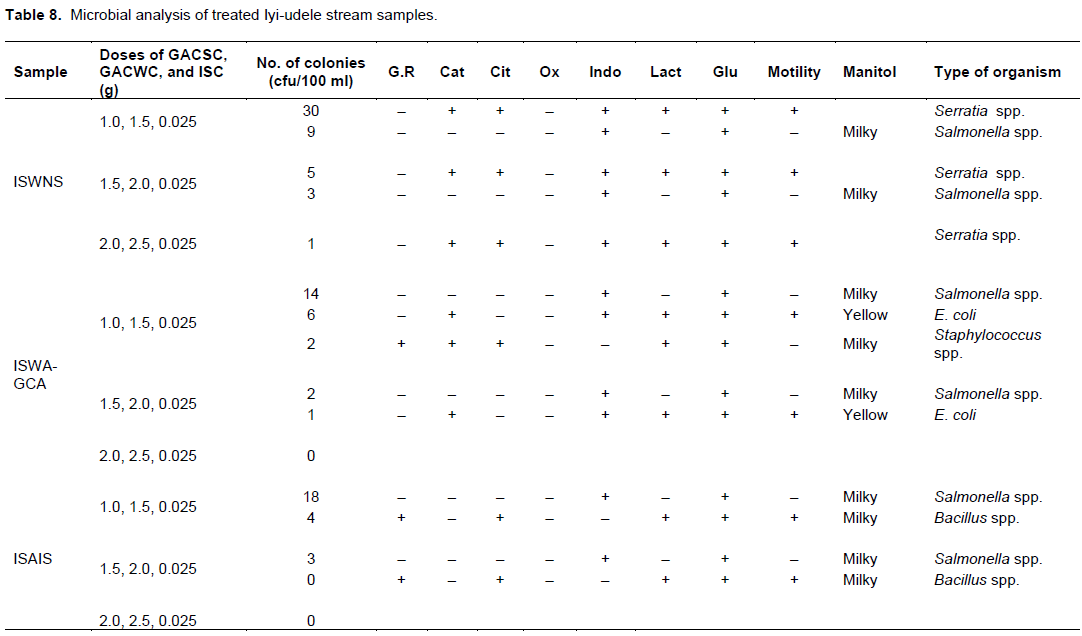
After batch treatments of Iyi-udele stream samples, the results of the microbial reductions obtained are presented in Tables 6 and 7. Table 6 shows that over 500 isolates were obtained from the three Iyi-udele stream samples (ISNS, ISAGCA, ISAS) before treatment. Out of these isolates, 2 bacteria genera identified were Bacillus and Staphylococcus species with number of colonies of 18 and 31 cfu/100 ml, while three other bacteria genera isolated were Salmonella species, Serratia species, and Escherichia coli with number of colonies ranging from 45 to TNTC cfu/100 ml (Table 7). After the control treatment to assess the efficacy of the composite materials to disinfect water sample, results obtained (Table 8) indicate that the frequencies of occurrence of the pathogenic microorganisms reduced from TNTC - 0.01 × 10², 1.43 × 10² - 0, and from 0.7 × 10² - 0 cfu/100 ml in Iyiudele stream sample, Nna street (ISNS), Iyiudele stream sample, Assemblies of God Church Avenue (ISWAGCA), and Iyiudele stream, Aguiyi Ironsi street (ISAIS) samples, respectively, with optimal doses of 2.0, 2.5, and 0.025 g of GACSC, GACWC, and ISC. Hence, 2.0, 2.5, and 0.025 g of GACSC, GACWC, and ISC were used as the optimized doses to disinfect the river and borehole water samples at POU.
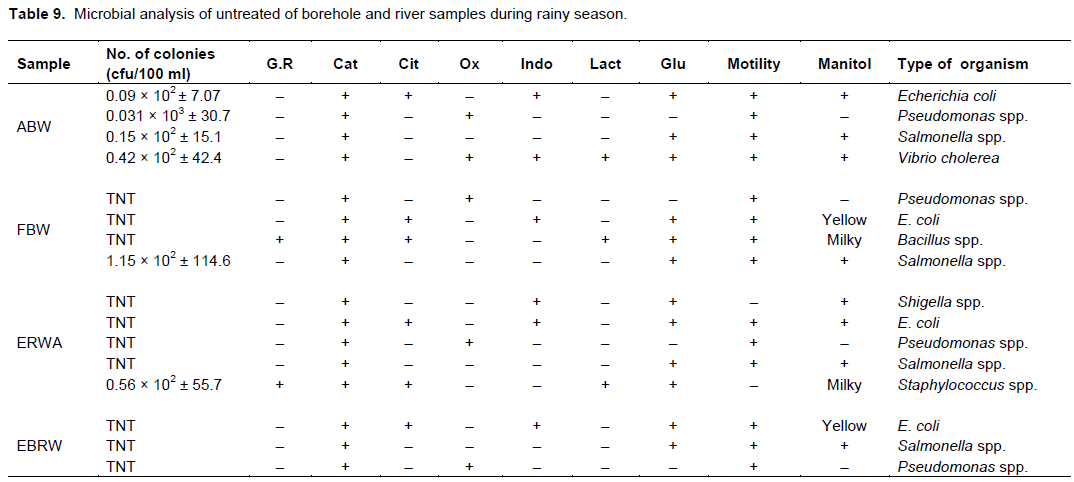
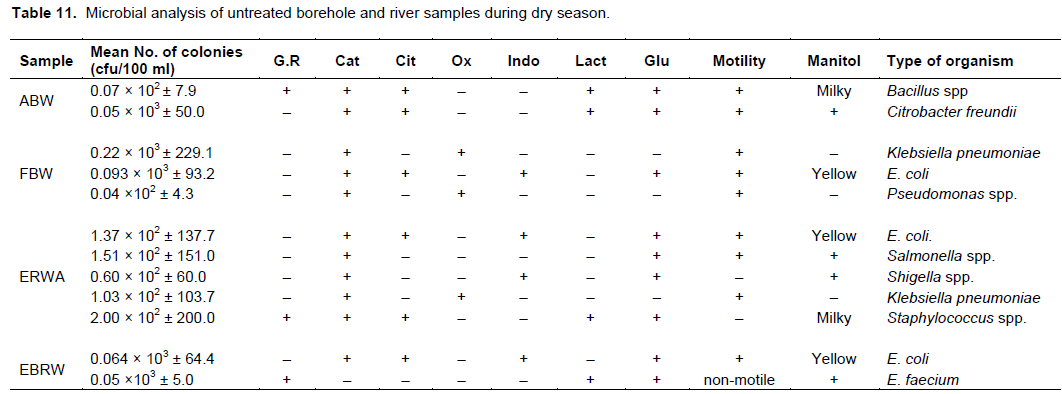
More than 750 and 1,750 isolates were obtained in the untreated borehole [Assemblies of God Church Avenue borehole water (ABW), Federal University, Ndufu Alike Ikwo borehole water (FBW), and river water (ERWA and EBRW) samples, respectively, during rainy season (Table 9), while about 374 and 765 isolates were observed in untreated borehole and river water samples, respectively during the dry seasons (Table 11). There were 7 and 11 bacteria genera identified in the water samples during the rainy and dry seasons. A 5 bacteria genus was identified in both the borehole and river water samples during the rainy season while 5 and 6 bacteria genera were identified in the borehole and river samples, respectively during the dry season. These include E. coli, Pseudomonas species, Salmonella spp., Vibrio cholerea, Bacillus spp., Shigella species and Staphylococcus spp., Citrobacter freundii, Klebsiella pneumonia and Enterococcus faecium. Total coliform bacteria count (TCBC) obtained in the untreated borehole and river water samples ranged from 9 to too numerous to count (TNTC), and TNTC, respectively, while the total aerobic bacteria counts (TABC) for both types of water samples were TNTC, and 56 - TNTC, respectively. On the other hand, the total coliform count obtained in the untreated borehole and river water samples were 363 and 565, respectively. The total aerobic bacteria counts for the borehole and river samples were 370 and 765.
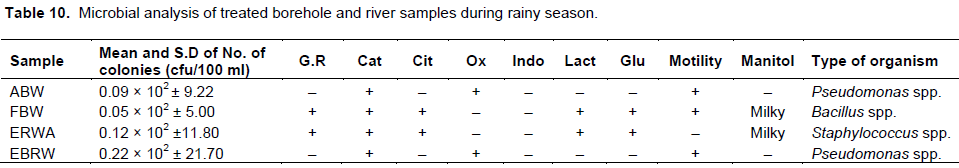
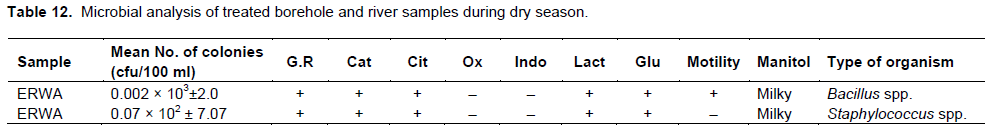
After the disinfection treatment at POU, the results obtained (Tables 10 and 12) showed one bacterium genera each isolated in the water samples, which was not a coliform bacteria. The reduction in the frequencies of occurrence of Pseudomonas spp. in ABW was from 0.031 × 10³ - 0.09 × 10², Bacillus spp. in FBW from TNT - 0.05 × 10², Staphylococcus spp. in ERWA from 0.56 × 10² - 0.12 × 10², and Pseudomonas spp. in EBRW from TNT - 0.22 × 10². It was only in FBW and ERWA samples, the presence of bacteria genera was isolated during the dry season (Table 11) with a reduction in the frequencies of occurrence of Bacillus spp. from 0.07 × 10² - 0.02 × 10², and of Staphylococcus spp. from 2.00 × 10² - 0.07 × 10².
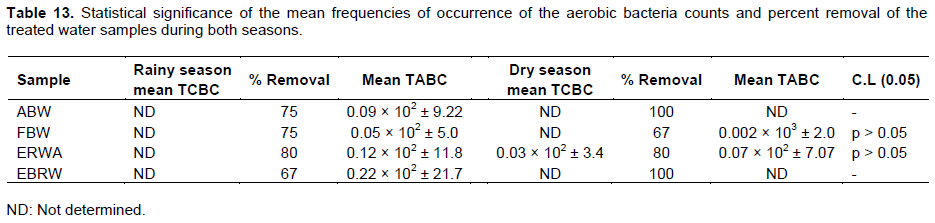
Microorganisms isolated from the untreated and treated samples were identified based on their cultural, morphological and biochemical properties. Table 13 presents the statistical significance of the mean frequencies of occurrence of the aerobic bacteria counts and the % removal of the treated water samples during both seasons.
DISCUSSION
The results of the microbial count and isolated microorganisms in Table 6 showed that the untreated Iyiudele stream (IS) was heavily polluted with pathogenic microorganisms; coliform and non-coliform bacteria, which belong to the genera E. coli, Salmonella spp., Serratia spp., Staphylococcus spp., and Bacillus spp. The results obtained were above WHO maximum permissible limit of 0 cfu/100 ml of water sample (Gwimbi et al., 2019; WHO, 2011).
From the results obtained after the treatment of the IS samples (Table 10), it was observed that the pathogenic bacteria initially present in the untreated IS samples, including Salmonella spp., E. coli, Staphylococcus spp. and Bacillus spp. were completely removed on treating with 2.0, 2.5, and 0.025 g of GACSC, GACWC, and ISC, respectively at POU. However, in the treated ISWNS sample, there was a residual bacterium, Serratia spp. It is a fecal coliform which has not been implicated to cause gastrointestinal infection through water ingestion. This result therefore demonstrates that the prepared composite materials, GACSC/GACWC/ISC, was effective in removing the microbial loads in water sources.
The results of the microbiological quality of the water samples obtained indicated that there was more microbial load in the untreated borehole samples during the rainy season than at dry season. This may be due to influx from pathogen contaminated uplands or agricultural lands, and seepage from nearby septic tanks into the groundwater (Azuonwu et al., 2020; Pandey et al., 2014). Sample from ERWA recorded the highest isolated TCBC during both seasons while samples from ABW, FBW, and EBRW had equal amount of isolated TCBC at rainy season. During dry season, samples from ABW and EBRW recorded the same amount of TCBC. The untreated ABW, FBW, ERWA, and EBRW samples showed predominance of high level of fecal coliforms namely, E. coli, Pseudomonas spp., and Salmonella spp. during rainy season, while at dry season all the samples but ABW were predominated with E. coli indicating possible fecal pollution of the water samples (Sophie, 2013).
The frequencies of occurrence of these coliform bacteria were above the WHO (2011) conformity category of 0 cfu/100 ml of sample. According to Gwimbi et al. (2019) WHO recommends the health risk categories of coliform bacteria counts in drinking water to be 0 cfu/100 ml (conformity), 1 - 10 cfu/100 ml (low risk), 10 - 100 cfu/100 ml (intermediate risk), 100 - 1000 cfu/100 ml (high risk), and > 1000 cfu/100 ml (very high risk). Hence, the untreated ABW, FBW, ERWA, and EBRW samples with frequencies of occurrence of coliform bacteria 0.97 × 10², TNTC, TNTC, and TNTC during the rainy season and 0.05 × 10³, 3.17 × 10², 4.51 × 10², and 0.69 × 10² during the dry season, respectively had risk level that ranged from low health risk to very high health risk. It was evident that all the untreated sources of drinking water did not meet the criteria for drinking during both seasons. There are several factors that may have caused the high values in the mean frequency of occurrence of microbial loads in the borehole samples especially during the rainy season. The seepage or percolation of pathogens into the groundwater occurs mostly during precipitation as groundwater recharges. This increases the risk of groundwater pollution especially in areas where the aquifer is fractured or there is existence of cracks in the soil strata (Wang et al., 2014; Moyo, 2013). Based on the high values of the electrical conductivity of the boreholes sampled (FBW and ABW), it could be possible that this may have resulted in the corrosion of the distribution pipes thus giving way for re-growth of microbes into the water (Ibe et al., 2002). The transport of bacteria is also influenced by the solution chemistry, soil properties, temperature and association of bacteria with soil (Pandey et al., 2014).
After the disinfection at POU using 2.0, 2.5, and 0.025 g of GACSC/GACWC/ISC composite materials (optimal doses), it was observed that samples from ABW, FBW, ERWA, and EBRW showed a 75, 75, 80, and 66.6% reduction in the frequency of occurrence of the TCBC during rainy season while there was 100, 66.6, 80, and 100% removal in the frequency of occurrence of TCBC at dry season, respectively. From the present study, it was observed that during both seasons the prepared composite materials was effective in disinfecting the borehole and river samples, thereby making them potable for drinking purposes. This was evident in the elimination of all the fecal coliforms from the treated water samples. However, the treatment material was more effective during the dry season based on the observed % removal. The effectiveness of this novel adsorbent in eliminating bacteria pathogens in the water may be attributed to the hydrogen bonds formed between the water molecules adsorbed on the metal oxide surfaces (ash contents) and the lipopolysaccharides outer surface of the bacteria (Rivera-Utrilla et al., 2001). It may also be attributed to the TiO2 present in the activated biomaterial which has antimicrobial activity (Amin et al., 2014). Though there may be less attraction between cell surfaces of the bacteria (Gross et al., 2001) and the activated biomaterials (Figures 2 and 3 and Table 3), which had amphoteric nature, however, the action of the coagulant (Fe2SO4)3 drastically reduced the electrostatic repulsions between the negatively charged bacterial cell surface and the biomaterials thus allowing van der Waal’s interaction to supersede the force of repulsion due to its high ionic strength and thereby favouring coagulant adsorption (Rivera-Utrilla et al., 2001). It could also be attributable to the neutralization of the negative charges on the microbes surface by the positively charged coagulant, attachment of the microorganisms concurrently to the iron (III) hydroxide precipitate (heamophilicity) and onto the surfaces of the activated biomaterials according to Allan and Hall (2017) and Brice et al. (2005).
The inability of the prepared composite materials to completely remove the bacteria, P. aeruginosa, could be due to formation of biofilm in the treated water which played a protective role for the bacteria, providing its increased resistance to the disinfectants and chemical coagulant (Wingender, 2011; Wingender and Flemming, 2004). There was lack of evidence implicating the residual non-coliform bacteria – Pseudomonas spp., Bacillus spp., and Staphylococcus spp. – isolated in the treated ABW, FBW, ERWA, and EBRW samples with water-borne diseases (Bédard et al., 2016; Wingender and Flemming, 2004). The student t-test on the mean frequencies of occurrence of total aerobic bacteria counts during both seasons showed no significant variations from FBW and ERWA samples at p ? 0.05. Absence of significant variations observed after treating the water samples during the two seasons could be due to the high ionic strength of the ISC used which may have reduced the repulsive interaction between the negative surfaces of the bacteria and the carbons thereby resulting in similar degree of the bacteria removal during both seasons.
CONCLUSION AND RECOMMENDATIONS
The results of the microbial qualities of the water samples obtained during the rainy and dry seasons indicated that the untreated ABW, FBW, ERWA, and EBRW samples with frequencies of occurrence of coliform bacteria 0.97 × 10², TNTC, TNTC, and TNTC during the rainy season and 0.05 × 10³, 3.17 × 10², 4.51 × 10², and 0.69 × 10² during the dry season, respectively, had risk level that ranged from low health - very high health risk. This implied that during both seasons the different water sources were not suitable for drinking. However, after disinfecting the ABW, FBW, ERWA, and EBRW samples with the prepared composite materials, a 75, 75, 80, and 66.6% of the microbial load removal was obtained during rainy season while there was 100, 66.6, 80, and 100% of microbial load removal was achieved at dry season, respectively. There were no significant variations (p ? 0.05) in the total aerobic bacteria counts from all the water samples thus depicting the effectiveness of the composite materials at both seasons.
Therefore, based on the findings of the present study, it is recommended that the developed composite material can be considered as a good alternative/replacement to the commercial WaterGuard in disinfecting water at POU at rainy and dry seasons.
CONFLICT OF INTERESTS
The authors have not declared any conflict of interests.
ACKNOWLEDGMENTS
The authors thank Prof. J. N. Afiukwa and Dr. F. I. Nwabue for their assistance with the study, staff of International Institute of Tropical Agriculture (IITA), Ibadan; National Research Institute for Chemical Technology (NARICT), Zaria; Department of Chemical Engineering, Ahmadu Bello University, Zaria; Department of Chemical Engineering, University of Illorin; and Applied Microbiology Department, Ebonyi State University, Abakaliki for offering the opportunity of using their laboratories for the relevant analyses and assisting in the experimental.
REFERENCES
|
Acra A, Ashkar A and Raffoul Z (1988). Environmental health conditions. In: Armenian HK Zuruyk HC (ed). Beirut 1984. A population and health profile. American University of Beirut, Beirut, Lebanon: pp. 69-90. |
|
|
Aghamelu OP, Ezeh HN, Obasi AI (2013). Groundwater exploration in Abakaliki metropolis (southeastern Nigeria): issues and challenges. African Journal of Environmental Science and Technology 7(11):10-1027. |
|
|
Ahmed ER, Namasivayam C, Kadirvelu K (2004). Coirpith, an agricultural waste by-product, for the treatment of dyeing wastewater. BioResource Technology 48(1):79-81. |
|
|
Akpoveta OV, Okoh BE, Osakwe SE (2011). Quality assessment of borehole waters used in the vicinity of Benin, Edo State and Agbor, Delta State of Nigeria. Current Research in Chemistry 3(1):62-69. |
|
|
Allan PS, Hall WS (2016). Principles of fermentation technology (3rd Ed.). Butterworth - Heinemann Publishing. |
|
|
Ami C, Mikell W, Edwin PM, Steven C (2012). Low-tech coconut shell activated charcoal production. International Journal for Service Learning in Engineering 7(1):93-104. |
|
|
Amin MT, Alazba AA, Manzoor U (2014). A review of removal of pollutants from water/wastewater using different types of nanomaterials. Hindawi Publishing Corporation. Advances in Materials Science and Engineering Vol. 2014, Article ID 825910, 24 pages. |
|
|
Ande OT, Ojo OA, Adeyolanu OD, Are SK, Adelana A, Oke A, Adetayo AA, Oluwatosin GA (2016). Digital soil mapping and morphogenetic characterization of soils of Ebonyi formation in southeastern Nigeria. Earth Science Research 5(1):1- |
|
|
Andrew OI, Mosto OK, Sunday DS (2017). Contrasting styles of lead-zinc - barium mineralisation in the lower Benue trough, southeastern Nigeria. Earth Science Research Journal 21(1):7-16. |
|
|
Ani C, Okogwu OI, Nwonumara GN, Nwani CD, Nwinyimagu AJ (2016). Evaluation of physicochemical parameters of selected rivers in Ebonyi State, southeast Nigeria. Greener Journal of Biological Sciences 6(2):34-41. |
|
|
APHA, AWWA, WEF (2005). American Public Health Association, American Water Works Agency, and Water Environment Federation. Standard methods for the examination of water and wastewter, 21st edition, Washington, D. C. |
|
|
Azuonwu O, Ihua N, Ohwondah G (2020). Bacteriological risk assessment of borehole sources of drinking water in ssome part of PortHarcourt metropolis of Niger Delta, Nigeria. Journal of Scientific and Technical Research 24(4):18477-18487. |
|
|
Bédard E, Prévost M, Déziel E (2016). Pseudomonas aeruginosa in premise plumbing of large buildings. Microbiologyopen 5(6):937-956. |
|
|
Bingzheng L (2012). Characterization of pore structure and surface chemistry of activated carbons-A review. Edited by Dr. Salih Salih. Fourier transform-materials analysis. Publisher InTech 8:165-181. |
|
|
Brice MRA, Yanez C, Jorand F, Jean CB (2005). Advantage provided by iron for Escherichia coli growth and cultivability in drinking water. Applied and Environmental Microbiology 71(9):5621-5623. |
|
|
Bos R, van der Mei HC, Henk JB (1999). Physico-chemistry of initial microbial adhesive interactions - its mechanisms and methods for study. FEMS Microbiology Reviews 23(2):179-229. |
|
|
Bull R, Kopfler J (1991). Chloramines by-product profiles. In health effects of disinfectants and disinfection by-products. Prepared for the American Water Works Association Research Foundation, Denver, CO: 36. |
|
|
Cheesbrough M (2006). District laboratory practice in tropical countries. 2nd Edn., Cambridge University Press, Cambridge, UK. |
|
|
Ekpete OA, Horsfall M (2011). Preparation and characterization of activated carbon derived from fluted pumpkin stem waste (Telfairia Occidentalis Hook F). Research Journal of Chemical Science 1(3):10-17. |
|
|
EPA (2007). Stage 2 disinfectants and disinfection by-product rule (stage 2 DBP rule). |
|
|
Erin S, Kathy H, Chambers VY, Chandler J, Cuddeback J, Kones K (2018). Sampling, laboratory and data considerations for microbial data collected in the field. United States Environmental Protection Agency EPA/600/R-18/164. |
|
|
Eyankware MO, Nnabo PN, Omo IOO, Selemo OL (2016). Assessment of anthropogenic activities on hydrogeochemical quality of water resources of Ekaeru Inyimagu and its environs, Ebonyi State, SE. Nigeria. Sky Journal of Soil Science and Environmental Management 5(5):99-114. |
|
|
Faria YA, Shafkat SR, Hossain MM (2017). A study on the microbiological status of mineral drinking water. Open Microbiology Journal 28(11):31-44. |
|
|
Francis KA, Amos B (2009) Effectiveness of Moringa oleifera seed as coagulant for water purification. African Journal of Agricultural Research 4(1):119-123. |
|
|
Gross M, Cramton SE, Gotz F, Peschel A (2001). Key role of teichoic acid net charge in Staphylococcus aureus colonization of artificial surfaces. Infection and Immunity 69(5):3423-3426. |
|
|
Gwimbi P, Maeti G, Motena R (2019). Bacterial contamination of drinking water sources in rural villages of Mohale basin, Lesotho: Exposures through neighbourhood sanitation and hygiene practices. Environmental Health and Preventive Medicine 24(33):1-7. |
|
|
Haseena M, Malik MF, Javed A, Arshad S, Asif N, Zulfiqar S, Hanif J (2017). Water pollution and human health. Environmental Risk Assessment and Remediation 1(3):16-19. |
|
|
Holt JG, Krieg NR, Sneath PHA, Staley JT, Williams ST (1994). Bergey's manual of determinative bacteriology, 9th edn. Baltimore: Williams and Wilkins. |
|
|
Ibe SR, Egereonu UU, Sowa AHO (2002). The impact of hand pumped corrosion on water quality in rural areas of West African sub-region. Environmental Monitoring Assessment 78(1):31-43. |
|
|
Igwenyi IO, Aja O (2014). Physicochemical properties and heavy metal analysis of major water sources in ohaozara, Ebonyi State, Nigeria. IOSR Journal of Environmental Science, Toxicology and Food Technology 8:41-44. |
|
|
Ilomuanya MO, Nashiru B, Ifudu ND, Igwilo CI (2017). Effect of pore size and morphology of activated charcoal prepared from midribs of Elaeis guineensis on adsorption of poisons using metronidazole and Escherichia coli O157:H7 as a case study. Journal of Microscopy and Ultrastructure 5:32-38. |
|
|
John F, Mark JN (2013). Contaminants in drinking water. Environmental Pollution and Health 68(1):199-208. |
|
|
Kakio T, Tsukamoto T (2012). Method for the manufacture of ferric sulfate solution and a water treatment agent using the same EP 1067095 B1. FreePatentsOnline.com. |
|
|
Lowell S, Shields JE, Thomas MA, Thommes M (2005). Characterization of porous solids and powders: surface area, pore size and density. (Quantachrome Instruments, Boynton Beach), J. E. Shields (C. W. Post Campus of Long Island University), M. A. Thomas, and M. Thommes (Quantachrome In-struments). Kluwer academic publisher: Dordrecht, The Netherlands. 2004. xiv + 348 pp. $159.00. ISBN 1-4020-2302-2. |
|
|
Mbaeze MC, Agbazue VE, Orjioke NM (2017). Comparative assessment of performance of aluminium sulphate (alum) and ferrous sulphate as coagulants in water treatment. Modern Chemistry and Applications 5(4):1-14. |
|
|
Mgbeojedo TI, Al-Naimi LS (2018). Hydrogeochemical and physico - chemical studies of the groundwater within Afikpo and Abakaliki, southeastern Nigeria. Geoscience 8(2):32-43. |
|
|
Misihairabgwi JM, Abisha K, Peter A, Colin CJ, Tanya PA, Ignatius N (2014). Adsorption of heavy metals by agroforestry waste derived activated carbons applied to aqueous solutions. African Journal of Biotechnology 13(14):1579-1587. |
|
|
Moyo NAG (2013). An analysis of the chemical and microbiological quality of groundwater from boreholes and shallow wells in Zimbabwe. Physics and Chemistry of the Earth 66:27-32. |
|
|
Nancy J, Gunno R, Gunner J (2007). The study of water supply and traditional water purification knowledge in selected rural villages in Tanzania. Tribes and Tribals, Special 1:111-120. |
|
|
Nikolaou AD, Golfinopoulos SK, Lekkas TD, Kostopoulou M (2004). DBP levels in chlorinated drinking water: effect of humic substances. Environmental Monitoring and Assessment 93(1-3):301-319. |
|
|
Nuhu AA, Omali ICP, Clifford OC (2018). Antibacterial activity of agricultural waste - based activated carbons and silver-impregnated activated carbon against pathogenic Staphylococcus aureus and Pseudomonas aeruginosa. American Journal of Engineering Research 7(1):269-275. |
|
|
Onwughara NI, Umeobika UC, Obianuko PN, Iloamaeke IM (2011) Emphasis on effects of storm runoff in mobilizing the heavy metals from leachate on waste deposit to contaminate Nigerian waters: improved water quality standards. International Journal of Environmental Science and Development 2(1):55-63. |
|
|
Okeke OC, Dioha EC, Umeorizu IB, Mmerole MC, Nwakwasi NI (2016). Physico-chemical and bacteriological characteristics and quality assessment of groundwater from shallow aquifer in Abakaliki town, southeastern Nigeria. International Journal of Advanced Academic Research/Sciences, Technology and Engineering 2(12):60-73. |
|
|
Okoroigwe EC, Ofomatah AC, Oparaku NF and Unachukwu GO (2013). Production and evaluation of activated carbon from palm kernels shells (PKS) for economic and environmental sustainability. International Journal of Physical Sciences 8(19):1036-1041. |
|
|
Pandey PK, Kass PH, Soupir, ML, Biswas S, Singh VP (2014). Contamination of water Resources by Pathogenic Bacteria. AMB Express 4 (51):1-16. |
|
|
Premium Times, Saturday, April 18, 2020. Amidst coronavirus crisis, millions of Nigerians lack access to potable water. Edited by Nike Adebowale. |
|
|
Rivera UJ, Bautista TI, Ferro GMA, Moreno CC (2001). Activated carbon surface modifications by adsorption of bacteria and their effect on aqueous lead adsorption. Journal of Chemical Technology and Biotechnology 76(12):1209-1215. |
|
|
Sojobi AO, Dahunsi SI, Afolayan AO (2015). Assessment of the efficiency of disinfection method for improving water quality. Nigerian Journal of Technology 34(4):907-915. |
|
|
Sophie V (2013). Understanding microbial indicators for drinking water assessment: interpretation of test results and public health significance. National Collaborating Centre for Environmental Health. |
|
|
Subhaashree P (2011). A project on production and charaterization of activated charcoal produced from a suitable industrial sludge. A report submitted in partial fulfillment of the requirements for the degree of bachelor of technology (chemical engineering) to the Department of Chemical Engineering, National Institute of Technology Rourkela. |
|
|
Tashfia A (2018). Determination of prevalence and antibiotic susceptibility pattern of bacteria isolated from household and restaurant kitchen utensils of Dhaka, Bangladesh. A dissertation submitted to Brac University in partial fulfillment of the requirements for the degree of bachelor of science in microbiology. Microbiology Program Department of Mathematics and Natural Sciences BRAC University Dhaka, Bangladesh. |
|
|
Wang Y, Bradford SA, Simunek J (2014). Estimation and upscaling of dual-permeability model parameters for the transport of E. coli D21g in soils with preferential flow. Journal of contaminant hydrology 159:57-66. |
|
|
World Health Organization (WHO) (2011). Guideline for drinking water quality. 4th edition, World Health Organization, Geneva. |
|
|
Wingender J (2011). Hygienically relevant microorganisms in biofilms of man?made water systems: in biofilm highlights, Flemming HC, Wingender J, Szewzyk U (editors), (pp. 189-238). Berlin, Germany: Springer Berlin Heidelberg. |
|
|
Wingender J, Flemming HC (2004). Contamination potential of drinking water distribution network biofilms. Water Science and Technology 49(11-12):277-286. |
|
|
Zhang JY, Huan J, Ke X (2011). Effect of physicochemical characteristics of activated carbon on the adsorption of organic pollutants in natural water. Article in Chinese 32(2):494-500. |
|
Copyright © 2024 Author(s) retain the copyright of this article.
This article is published under the terms of the Creative Commons Attribution License 4.0


