Full Length Research Paper

ABSTRACT
An integrated geoelectrical study combining electrical resistivity tomography (ERT) and induced polarization (IP) have been used to delineate potential zones of Lead-Zinc mineralization in Umuobuna, Uburu, Ohaozara local government area, southeastern Nigeria. The wenner array configuration was used to acquire resistivity and induced polarization data sets along three traverses of approximate length of 1 km each and spacing of 5 to 25 m, using ABEM Terrameter SAS 1000. The profiles were inverted using RES2DINV software for 2D imaging to delineate possible zones of Pb-Zn mineralization and the geological structures at selected locations in the study area. The ERT surveys were carried out along the IP lines for comparison of anomalies across the profiles. The potential zones of Pb-Zn mineralization display contrasting values of resistivity and chargeability along the traverses. Resistivity values ranging from 7.53 to 7525 ?m and corresponding chargeability values of between -15.6 and 354 ms, respectively were encountered at some intervals along the traverses. These zones occur at width range 19.5 to 74.5 m and depths of between 0.9 and 15.5 m. Having a low to moderate resistivity and a corresponding high chargeability values at similar width range may be suggestive of Pb-Zn mineralization and test drilling is needed at the anomalous sites for confirmation.
Key words: Pb-Zn, ERT, IP, resistivity, chargeability, mineralization.
INTRODUCTION
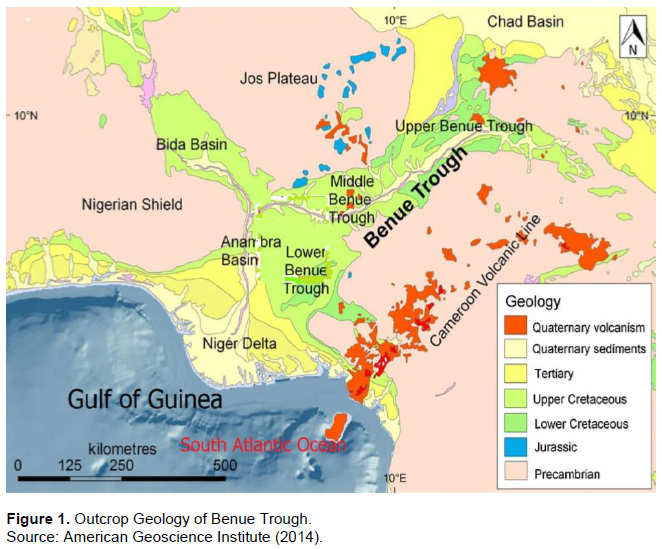
Lead-zinc mineralization occurs in almost the entire length of the Benue Trough in association with saline water intrusion and/or with fractures/shear zones and it is believed to be hydrothermal in origin (Benkelil, 1989; Bolarinwa et al., 2022). The Pb-Zn mineralization is mainly composed of sphalerite and galena. Calcite, pyrite, marcasite, chalcopyrite, and oxides of lead and zinc may also be present. The Nigerian lead-zinc field is estimated to extend for about 560 km in a narrow belt of approximately 30 to 50 km wide from Ishiagu in the Lower Benue Trough, through Azara in the Middle Benue Trough, to Gidan Dari in the Upper Benue Trough (Cratchley and Jones, 1965; Fatoye et al., 2014). Many occurrences of lead-zinc are known, such as those at Enyigba, Ameki, Ameri (near Abakaliki), Wanikande, Wanakom, Gabu, and Oshina all in the Lower Benue Trough and at Keana, Aloshi, Akiri, Wuse, Akwana, Arufu, Faya, Shata, Chiata, Gbande, Gboko, Sardauna, Karim Lamido, Yoro, Lau, Wukari, and Ibi in the Middle Benue Trough, there are also deposits of the Lead-Zinc found at Isimiya, Diji, Gidan Dari, Alkaleri and Gwana in the Upper Benue Trough (Figure 1). The ore deposits occur in veins on the anticlinal structures which trend NE-SW (Akpunonu et al., 2021).
Applications of resistivity and induced polarization to Lead-Zinc exploration have been demonstrated in many studies by several authors (Ward, 1990; White et al., 2001). Electrical Resistivity Tomography (ERT) is commonly used for imaging of subsurface features and mapping of geological variations (Loke and Barker, 1996; Dusabemariya et al., 2020). The geological structures of occurrence of sulfide minerals show low resistivity and high chargeability (Langore et al., 1989; Yoshioka and Zhdanov, 2005). High chargeability and high resistivity anomalies have also been attributed to the presence of disseminated sulfides (Sono et al., 2021). The IP can detect information of small conductive rocks lost in the resistivity models. It can also detect sulfide in the presence of disseminated mineral deposits (Olowofela et al., 2008). Geophysical methods in the form of resistivity, induced polarization (IP) and self-potential (SP) methods have also been successfully applied in the exploration and confirmation of sulphide deposit occurrences in the Lower Benue Trough (Obasi et al., 2020; Adejuwon et al., 2021; Elem and Anakwuba, 2022).
The purpose of this research is to use 2D electrical resistivity tomography (ERT) in conjunction with induced polarization (IP) data inversion to identify and characterize potential zones of Lead-Zinc mineralization and depth to the anomalous bodies in Uburu area of Ebonyi State, Nigeria.
Location and geology of the study area
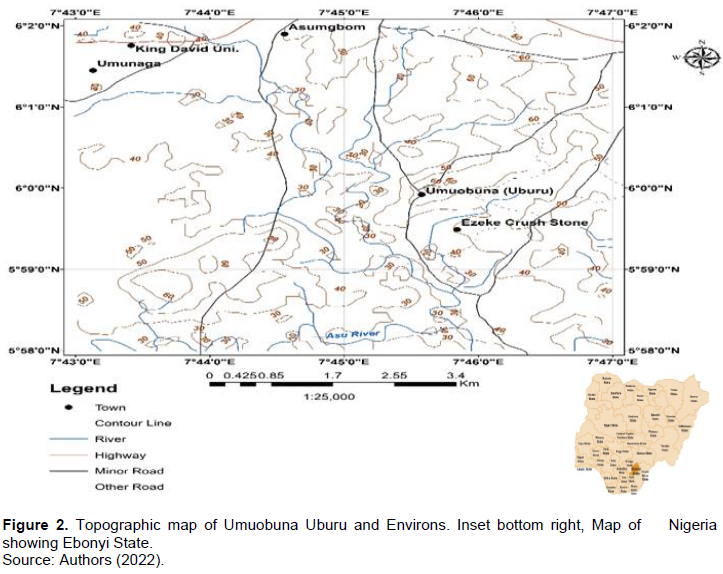
The study area (Uburu) falls within latitudes 5?59'55.3" - 6?2'0"N and longitudes 7?45'34.6" - 7?47'0"E, covering Umuobuna Uburu, Ohaozara local government area of Ebonyi State with an area extent of about 17.2 km2 and elevation of about 154 m above sea level. The area is accessible through a network of tarred roads and several extensive footpaths (Figure 2). The major road within the study area is the Nnenwe-Oduma-Mpu-Ebonyi Road.
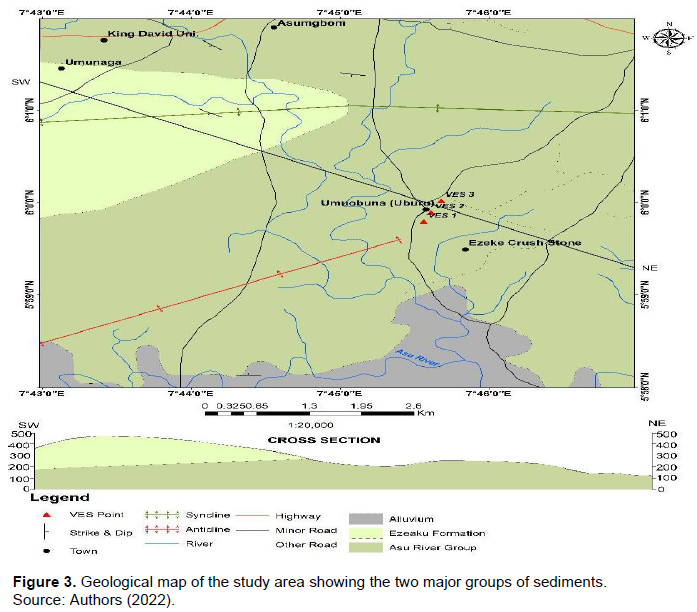
The study area is generally underlain by the Asu River Group of sediments. The Abakaliki shale of lower Cretaceous age is also well exposed near the area (Figure 3). The Asu River Group was described as the initial clastic fill of the Lower Benue Trough (Petters and Ekweozor, 1982) and occupies the core of the Abakaliki anticlinorium and consists of about 3,000 m thick basal arkosic sandstones and middle marine shales.
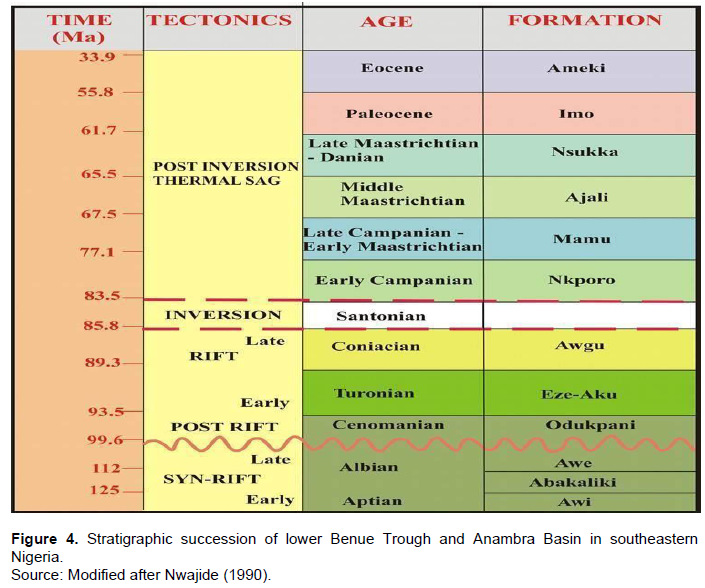
The type section is the Asu River near Abakaliki (Reyment, 1965). These sediments vary in thickness from about 1500 m in the Southern Benue Trough to over 3000 m in the middle Benue Trough (Offodile, 1976; Benkelil, 1989; Obaje et al., 2004) (Figure 1). Basically, the group comprises of greyish to bluish-black shale with subordinate sandstones, siltstones and limestones (Arinze and Emedo, 2020). The dark carbonaceous shales, which appear indurated in some places, are accompanied by a mixture of weathered shale and lateritic mudstone at the top most part. The group is sub-divided into three formations which from bottom to top are Mamfe/Awi, Abakaliki and Awe formation (Figure 4). The formation of the Abakaliki anticlinorium was adversely affected by the folding episode which occurred during the Santonian times (Obiora et al., 2016).
METHODOLOGY
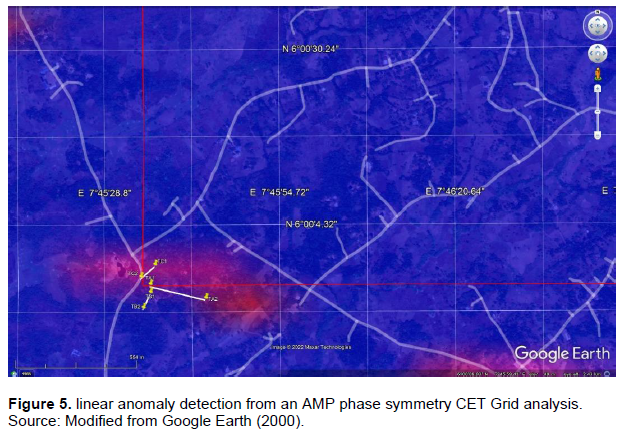
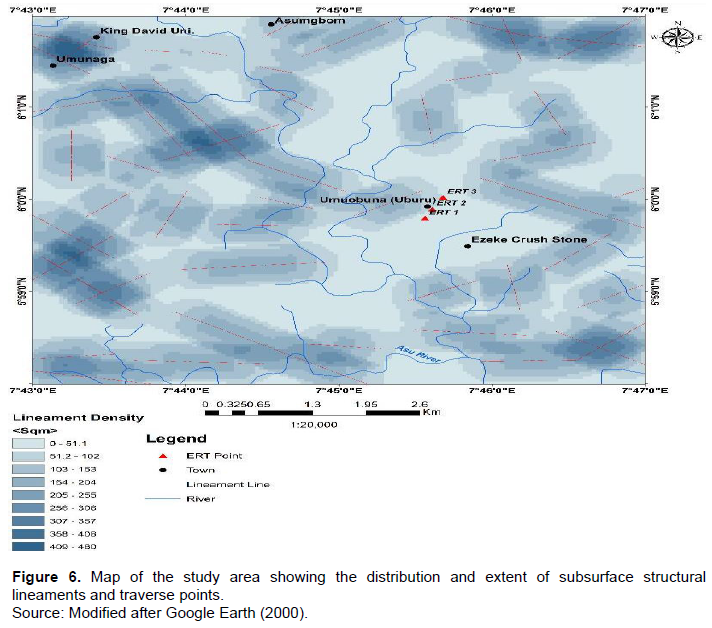
The Wenner array configuration was adopted throughout the survey. Resistivity and induced polarization data sets were acquired along three traverses of approximate length of 1 km each and spacing of 5 to 25 m, using ABEM Terrameter SAS 1000. The transverse lines were chosen to run North-East/South-West, perpendicular to the major fracture lines as indicated on Center for Exploration Targeting (CET) Grid analysis map (Figure 5) and lineament map (Figure 6).
The acquired resistivity and IP data were then processed to generate 2-D pseudo sections showing the variation of the resistivity and IP chargeability, using RES2DINV software for 2D imaging.
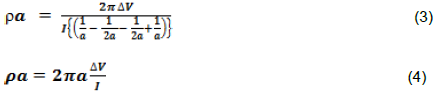
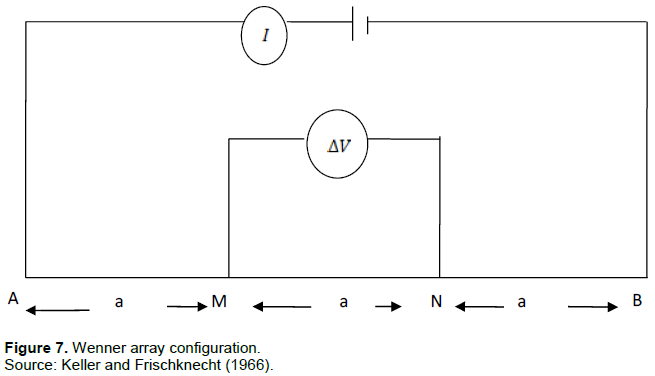
The Wenner array consists of four collinear, equally spaced electrodes. The outer two electrodes are typically the current (source) electrodes and the inner two electrodes are the potential (receiver) electrodes. Current ( I ) is transmitted into the ground with two electrodes (A, B), while the difference of potential  produced by the circulation of this current into the geological layers is measured with two other electrodes (M, N). The survey is carried out by increasing the separation distance, a, but keeping the distances between the electrodes in the array equal. The apparent resistivity ρa of the ground is defined by the relation:

where K is a geometrical coefficient which depends on the separations between the A, B, M, and N electrodes:
K = 2 π / (AM-1 – AN-1 – MB-1 + NB-1) (2)
Since the spacing "a” between the adjacent electrodes in Wenner configuration is the same (Figure 7), the inter-electrode distances are: AM = NB = a, and AN = MB = 2a. Substituting these values into Equation 1 gives the apparent resistivity for the Wenner configuration:
RESULTS AND DISCUSSION
Figures 8 to 10 are pseudo sections showing resistivity and chargeability variations of the subsurface along the traverses at different depths. Red colour indicates high resistivity and high chargeability zones while the blue colour indicates low resistivity and chargeability zones. High chargeability indicates possible mineralize zones (lead-zinc mineralization) while high resistivity indicates highly resistive units. The high chargeability zones represent areas of interest.
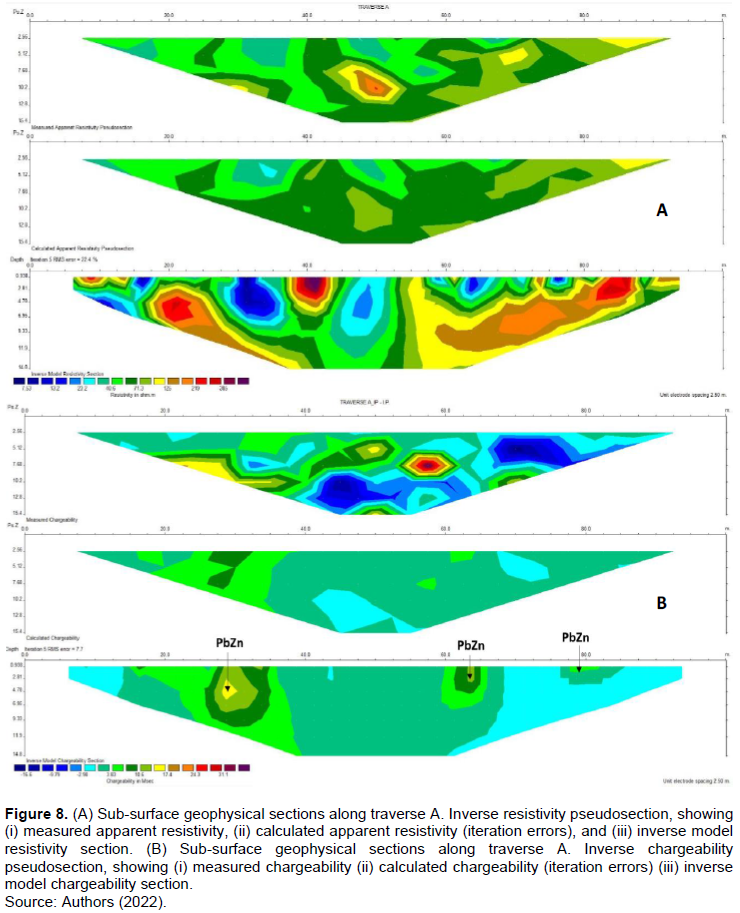
Traverse A
Traverse A with a total spread length of about 100 m is located at the eastern part of Uburu Ogbu-Enu Obiagu Umuobuna existing mine sit (Figure 8a and b). The pseudo section displays the resistivity and IP trace of the sub-surface geology down to a depth of about 15.4 m. The section shows a major shallow body in the three inverted sections of measured, and calculated apparent resistivity and iteration error, with its center at 40 m. There are also series of disseminated patches at 20, 60 and 80 m intervals (Figure 8). These bodies are associated with moderate to high resistivity values ranging from 40.6 to 385 Ωm (Figure 8a) within a contrasting resistivity background. These resistivity values are associated with high chargeability signatures (3.83 to 31.1 ms) (Figure 8b), which suggests that the bodies are not artifacts but an indication of conductive materials related to Pb-Zn sulphide mineralization in the vicinity of the shales.
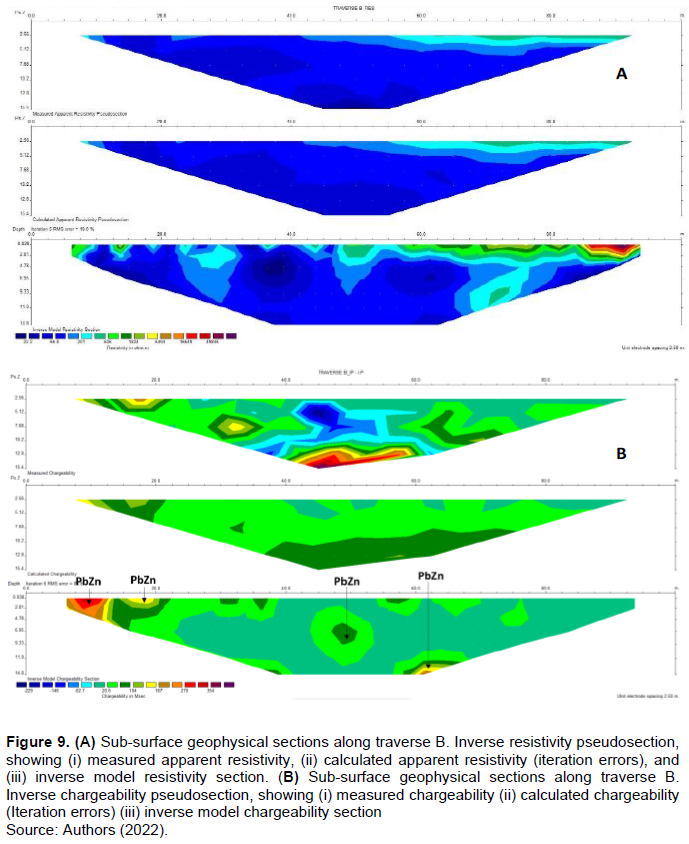
Traverse B
Traverse B was drawn perpendicular to traverse A, this pseudo section shows gradual increase in resistivity distribution from low (22.2 to 66.6 ?m) through moderate (201 to 606 ?m) to high resistivity of above 1000 ?m as shown in the color bar (Figure 9a). The IP pseudo section shows corresponding increase in chargeability within the same width range, first at a shallow depth of about 2.56 to 6.95 m and a distance of about 10 to 22 m and the second at a depth of about 15 m and a distance of 45 to 68 m. These structures display high chargeability values of between 270 and 370 ms and moderate chargeability values 104 and 187 ms (Figure 9b) which also suggest that the Pb-Zn minerals occur in disseminated form within the ore body.
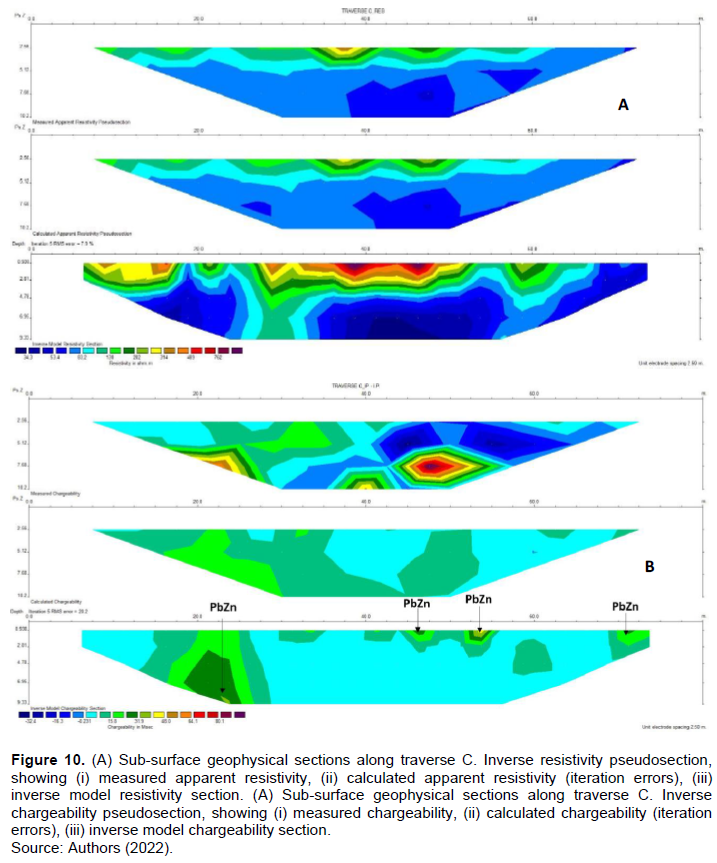
Traverse C
Traverse C was conducted along NE-SW direction, some distance away from a mine site (Figure 10a). The pseudo sections show resistivity values ranging from 314 to 762 Ωm at shallow depth of 2.8 m and low resistivity values of between 34.3 and 63.2 Ωm at a width range of 40 to 55 m and depth of about 8 m. The IP pseudo section shows low chargeability values of -0.231 ms of the surrounding host rock and a moderately high chargeability value of 15.8 to 48 ms of the suspected ore body (Figure 10b). The non-conductive zones characterized by light and dark blue coloration, and a deep blue background on the resistivity and chargeability sections, respectively, is indicative of the shale host rock.
CONCLUSIONS
2D imaging of the resistivity and IP data have been used to characterize conductive lodes and possible areas of Pb-Zn mineralization in the study area. The CET Grid analysis map (Figure 5) and Lineament map (Figure 6) depicts NE-SW as the principal trend direction of the mineralized veins with subordinates in the E-W, N-S and NW-SE directions. The resistivity and induced polarization pseudo sections (Figures 8 to 10) show disseminated patches of conductive (low to moderate resistivity) and high chargeability anomalous bodies occurring close to the earth’s surface. These anomalies are suspected to be sulphide (Pb-Zn) mineralized zones and their shallow depth makes the area suitable for exploitation.
CONFLICT OF INTERESTS
The authors have not declares any conflict of interests.
REFERENCES
|
Adejuwon BB, Obasi AI, Anthony Andah Salami AA (2021). Integrated geophysical study for mapping Pb-Zn sulfide deposits in Asu River Group shales in Nkpuma-Ekwoku, Abakaliki area, southeastern Nigeria. Arabian Journal of Geosciences 14:1385 |
|
|
Akpunonu EO, Offor C, Omeokachie AI, Aigbadon GO, Okeke SE (2021). Application of Self- Potential Geophysical Method in Delineation of Lead-Zinc Sulphide (Pb-Zns) Ore Veins In Enyigba Area, Part of Lower Benue Trough, South Eastern Nigeria. Global Journal of Applied Sciences and Technology 3(1):1-6 |
|
|
American Geoscience Institute. (2014). Outcrop Geology of Benue Trough. Geological Age, |
|
|
Arinze I, Emedo C (2020). Integrated geophysical Investigation for shallow - Scale massive (Pb-Zn) sulphide and barite Exploration in Abakaliki and Obubra mining Districtrs (AOMD), southeastern Nigeria. Mining, metallurgy and Exporaton 38(1):381-395. |
|
|
Benkelil J (1989). The origin and evolution of the cretaceous Benue Trough (Nigeria), Journal of African Earth Sciences 8(2-4):251-282. |
|
|
Bolarinwa AT, Faloyen O, Idakwo SO (2022). Geochemical Studies of Shales from Asu River Group, Lower Benue Trough: Implications for Provenance and Paleo-environment Reconstruction. Solid Earth Sciences 7(1):5-18. |
|
|
Cratchley CR, Jones HM (1965). An Interpretation of the Geology and Gravity Anomalies of the Benue Valley, Nigeria. Overseas Geological Surveys Geophysical paper 1:1-26 |
|
|
Dusabemariya C, Qian W, Bagaragaza R, Faruwa A, Ali M (2020). Some Experiences of Resistivity and Induced Polarization Methods on the Exploration of Sulfide: A Review. Journal of Geosciences and Environment Protection 8:68-92 |
|
|
Elem CJ, Anakwuba EK (2022). Application of Ground Magnetics and Geoelectrical Methods in Delineating Sulphide Deposit in Oshiri Area, Southeastern Nigeria. Global Journal of Geological Sciences 20:69-82 |
|
|
Fatoye FB, Ibitomi MA, Omada JI (2014). Lead-Zinz- Barites mineralization in the Benue Trough, Nigeria: Their geology, occurrences and economic prospective. Advances in Applied Science Research 5(2):86-92. |
|
|
Keller GV, Frischknecht FC (1966). Electrical methods in geophysical prospecting, Pergamon press Oxford. New York 517 p. |
|
|
Langore L, Alikaj, P, Gjovreku D (1989). Achievements in Copper Sulphide Exploration in Albania with IP and EM Methods. Geophysical Prospecting 37:975-991. |
|
|
Loke MH, Barker RD (1996). Rapid least-squares inversion of apparent resistivity pseudosections using a quasi-Newton method. Geophysical Prospecting 44:131-152. |
|
|
Nwajide CS (1990). Cretaceous Sedimentation and Paleogeography of the Central Benue Trough, Nigeria. In: Ofoegbu CO (Ed.). The Benue Trough Structure and Evolution. Friedr Vieweg, and Sohn, Braunschweig, Weisbaden pp. 19-38. |
|
|
Obaje NG, Wehner H, Scheeder G, Abubakar MB, Jauro A (2004). Hydrocarbon prospectivity of Nigeria's inland basin from a view point of organic geochemistry and organic petrology, AAPG Bulletin 88(3):325-353. |
|
|
Obiora SC, Chukwu A, Toteu SF, Davies TC (2016). Assessment of heavy metal contamination in soils around lead (Pb)-zinc (Zn) mining areas in Enyigba, southeastern Nigeria. Journal of Geological Society of India 87(4):453-462. |
|
|
Offodile ME (1976). The Geology of the Middle Benue, Nigeria. Palaentological Institute, University Uppsala, Special Publication 4: 1-166. |
|
|
Olowofela JA, Ajani OO, Oladunjoye MA (2008). Application of Induced Polarization Method to Delineate Sulphide Ore Deposit in Osina Area of Benue State, Nigeria. Ife Journal of Science 10(1):137-150 |
|
|
Petters SW, Ekweozor CM (1982). Petrolum Geology of the Benue Trough and Southeastern Chad Basin, Nigeria. American Association of Petrolum Geologists Bulletin 66:1141-1149. |
|
|
Reyment RA (1965). Aspects of the Geology of Nigeria. Ibadan University Press 133 p. |
|
|
Sono P, Nthaba B, Shemang EM, Kgosidintsi B, Seane T (2021). An integrated use of induced polarization and electrical resistivity imaging methods to delineate zones of potential gold mineralization in the Phitshane Molopo area, Southeast Botswana. Journal of African Earth Sciences 174:104060 |
|
|
Ward SH (1990). Resistivity and Induced Polarization Methods. In S. H. Ward (Ed.), Geotechnical and Environmental Geophysics (pp. 147-190). Investigations in Geophysics No.5 in SEG. |
|
|
White RMS, Collins S, Denne R, Hee R, Brown P (2001). A New Survey Design for 3D IP Inversion Modelling at Copper Hill. Exploration Geophysics 32(4):152-155. |
|
|
Yoshioka K, Zhdanov MS (2005). Three-Dimensional Nonlinear Regularized Inversion of the Induced Polarization Data Based on the Cole-Cole Model. Physics of the Earth and Planetary Interiors 150(1-3):29-43. |
|
Copyright © 2024 Author(s) retain the copyright of this article.
This article is published under the terms of the Creative Commons Attribution License 4.0


