Full Length Research Paper

ABSTRACT
This paper presents the Total Electron Content variability, during the solar cycle 23 maximum under geomagnetic fluctuating activity conditions from 2000 to 2002 at Niamey station (lat. :13°28’N ; long : 2°10’E) in Niger. A comparative study of TEC profiles variation under quiet and fluctuating geomagnetic activity conditions allowed us to analyze the effects of fluctuations in solar wind on equatorial ionosphere. Our investigation argues on that the solar cycle 23 maximum is mostly characterized by a non-effect of fluctuating winds on the ionosphere for equatorial region.
Key words: Seasonal variability, total electron content, fluctuating activity.
INTRODUCTION
The ionosphere is the upper ionized part of the Earth's atmosphere. The effect of ionospheric refraction on signals emitted by GPS satellites depends on the total electron content (TEC), that is, the number of free electrons encountered by these signals as they travel through the ionosphere; the concentration of free electrons depends, among other things, on solar activity (Boutiouta et al., 2006). Strictly speaking, TEC is the total number of electrons integrated along the path from receiver to each GPS satellite. Solar activity was organized, for the first time, into four classes of geomagnetic activity by Legrand and Simon (1989). They used a diagram constructed from aa geomagnetic index data calculated by Mayaud (1973): (1) Quiet activity days are days when aa < 20 nT. The three other classes (shock activity, recurrent activity and fluctuating activity) constitute the disturbed geomagnetic activity classes which occur on days when aa ≥ 20 nT. These classes are distinguished as follows: (2) Recurrent (stream) activity corresponds to days where aa ≥ 40 and repeated at the same solar longitude for at least two consecutive solar rotations without SSC. (3) Shock activity: days of ssc where aa ≥ 40 nT. (4) Fluctuating activity days not included in the three previous classes. Other works validated and improved the first classification of geomagnetic activity (Richardson et al., 2000; Richardson and Cane, 2002; Ouattara and Amory-Mazaudier, 2009; Zerbo et al., 2012, 2013).
The variability of ionospheric parameters such as TEC, in the equatorial region, has already been reviewed by different authors (Ouattara, 2009; Dabas et al., 2003; Zoundi et al., 2013; Suranya et al., 2015; Hajra et al., 2016; D’ujanga et al., 2017; Ouattara et al., 2017; Patel et al., 2017; Ogwala et al., 2018). Ouattara (2009), Zoundi et al. (2013) and Ouattara et al. (2017) have investigated TEC variability at Niamey station during various solar events. Interesting results were reported as follows: CODG TEC only showed dome profile. The electron density is higher between 1400UTC and 1700UTC with the maximum around 1400UTC. Ionization follows the solar cycle and exhibits a semi-annual variation. CODG TEC shows equinoctial asymmetry during calm and disturbed periods.
The present investigation is on TEC variability during solar cycle 23 maximum, at Niamey station, through fluctuating activity period. This work is aimed at analyzing the impact of fluctuating winds on the ionosphere electron density during the maximum of the solar cycle phase 23 by comparing TEC of fluctuating days and quiet days.
DATA AND METHODOLOGY
TEC data used here is CODG TEC, from IGS, that is, International GNSS (Global Navigation Satellite Systems) Service database (http://igscb.jpl.nasa.gov). The data covered the years 2000, 2001 and 2002 of the solar cycle 23 maximum phase.
To select the fluctuating days as well as quiet days of the years concerned by our study, we used the pixel diagram method (Legrand and Simon, 1989; Ouattara and Amory-Mazaudier, 2009; Zerbo et al., 2012).
Figure 1 shows an example of a pixel diagram for the year 2002.
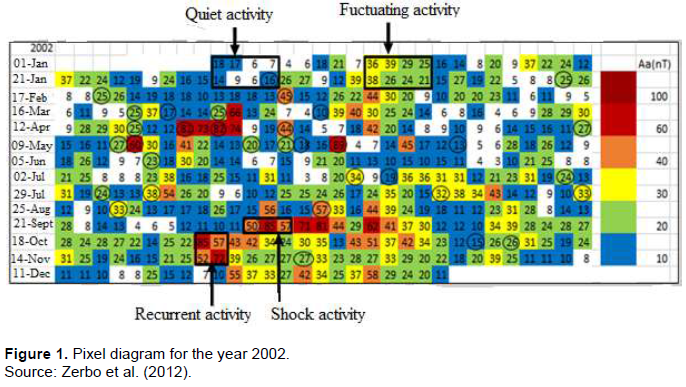
The geomagnetic indices Aa as well as the dates of the SSC used for the construction of the pixel diagrams come from the site: http://isgi.unistra.fr/data_download.php.
To select fluctuating and quiet days, we used the classification criteria given by Legrand and Simon 1(989). Thus, we obtained: one hundred and fifty-three (153) fluctuating days for the year 2000, one hundred and thirty-one (131) fluctuating days for the year 2001 and one hundred and sixty-three (163) fluctuating days for the year 2002, implying a total of four hundred and forty-seven (447) fluctuating days for all three years.
We found one hundred and seventy-nine (179) quiet days for the year 2000, two hundred and twelve (212) quiet days for the year 2001 and one hundred and eighty-three (183) quiet days for the year 2002, that is, a total of five hundred and seventy-four (574) quiet days for all three years of the maximum of solar cycle 23.
In this study, four seasons were considered as follows: Winter (December-January-February), Spring (March-April-May), Summer (June-July-August) and Autumn (September-October-November).
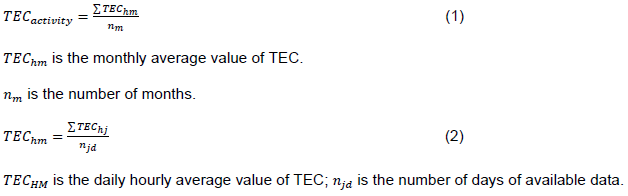
The solar phase classification criteria of Ouattara (2009) helped us in the choice of the three years of the maximum of cycle 23. For determination of the average of TEC values, we used the following equations :
RESULTS
Figures 2 to 4 show profiles of diurnal variabilities of TEC under fluctuating activity and quiet activity respectively during the year 2000, 2001 and 2002 for each season. Figure 5 presents profiles of diurnal variabilities of the mean TEC for these three years.
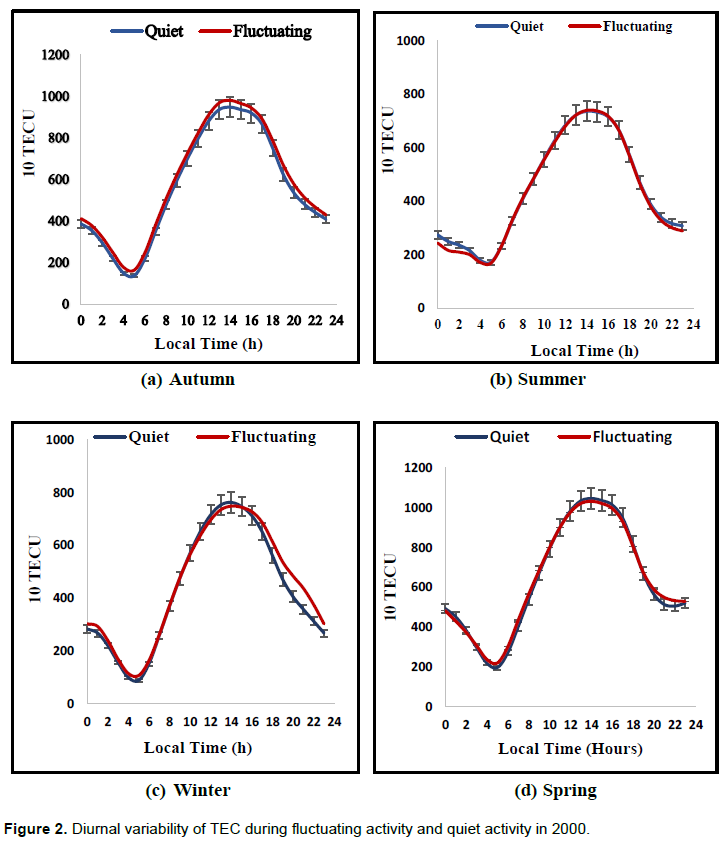
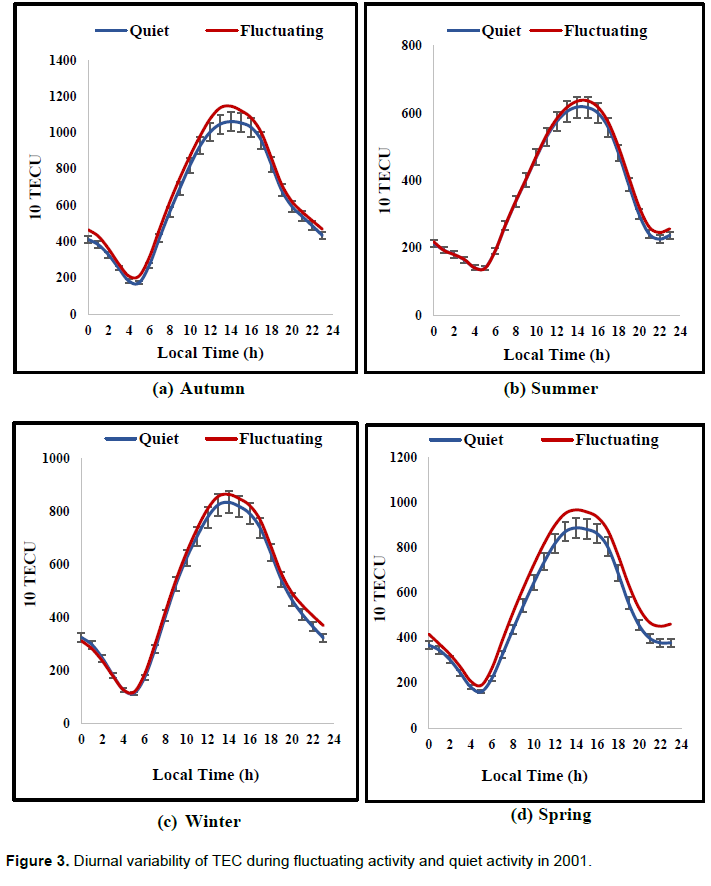
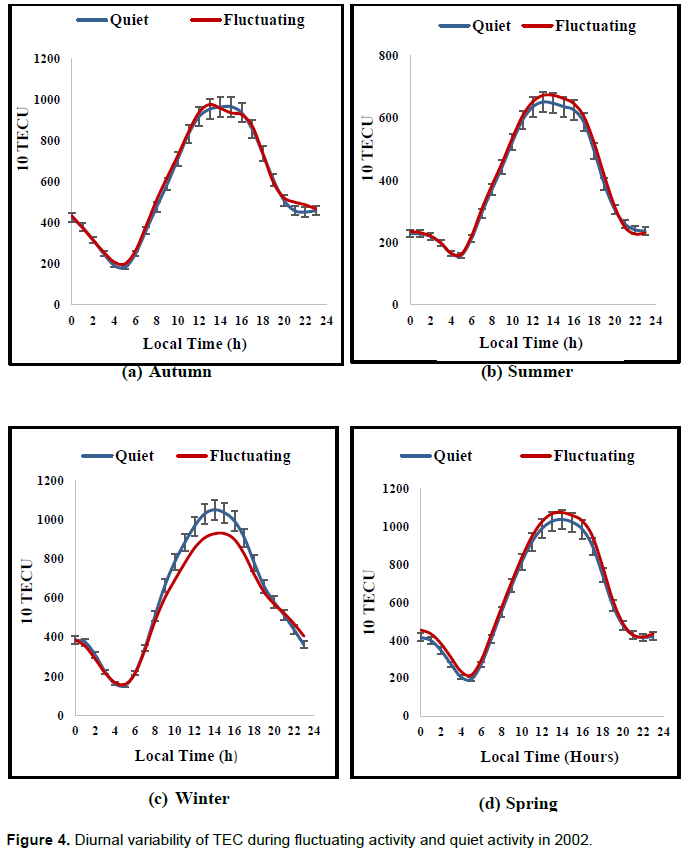
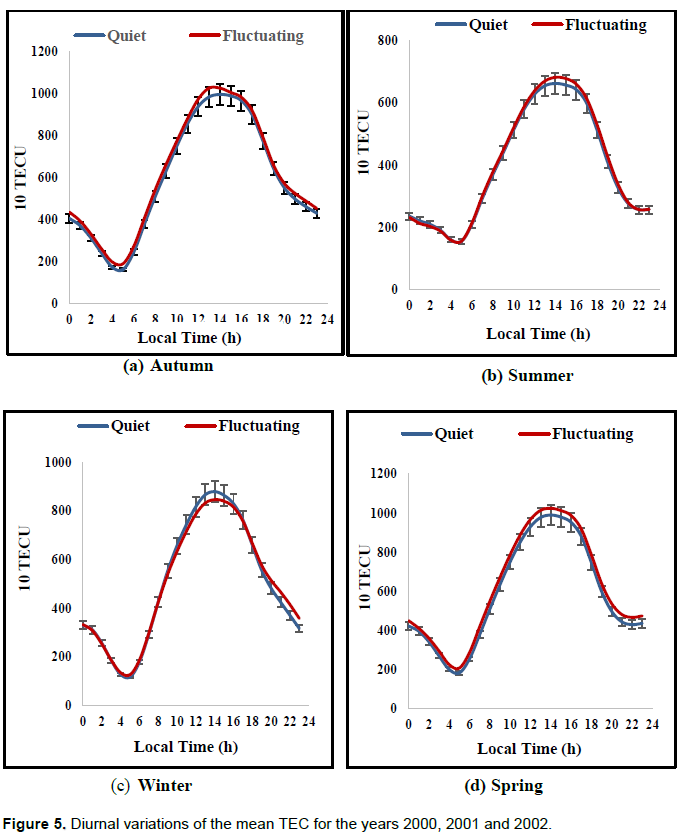
The red graphs show the TEC daily variability during fluctuating activity and the blue one the TEC variability during quiet period during (a) Autumn, (b) Summer, (c) Winter, and (d) Spring.
DISCUSSION
The graphs in Figures 2 to 5 generally have the same morphology. A rapid decrease were observed from 0000LT to 0500LT, a growth from 0500LT to 1400LT and a further decrease between 1400LT to 2400LT.
For the year 2000, the two graphs (quiet TEC and fluctuating TEC) as shown in Figure 2 (a, b and d), are almost the same. Here, TEC variability during fluctuating activity is closed to those of quiet activity for Autumn, Summer and Spring seasons in 2000.
For winter, this assimilation occurs between 0000LT and 1800LT. On the other hand, from 1800LT to 2400LT, the graph of fluctuating activity is above that of quiet activity. This could characterize the effect of fluctuating activity on TEC.
For the year 2001, Figure 3(b and c) show global similarity between profiles during fluctuating activity and quiet activity respectively in summer and winter. The positions of the graphs for autumn, between 1000LT and 1500LT, could reflect the effect of fluctuating activity on the TEC. In Spring, the TEC graphs are distinct during the two geomagnetic activity. This could reflect a diurnal effect of fluctuating activity on TEC.
Figure 4 (a, b and d), show TEC profile during Autumn, Summer and Spring for fluctuating activity and quiet activity respectively for the year 2002. The positions of the graphs relating to Winter, between 900TL and 1700TL, could reflect the negative effect of fluctuating activity on the TEC.
Panels a, b, c and d of Figure 5 (a, b, c and d), reflecting the average diurnal variabilities of the TEC for the year 2000, 2001 and 2002, are very close most of the time. These graphs hide the individual differences and testify the similarity between TEC profile for fluctuating and quiet activities most of the time.
From the electron density results, three phenomena (Warnant, 1996; Sammuneh, 2003):
i) the photo ionization which depends on the intensity of the incident ultraviolet radiation which is itself a function of local time, altitude, season and solar activity,
ii) the recombination: positive ions and free electrons resulting from photoionization recombine, thus forming neutral atoms and molecules,
iii) the capture: free electrons combine with atoms and neutral molecules to give negative ions.
Therefore, the trough observed at dawn reflects a decrease in photoionization at night and an increase in recombination phenomena for both the fluctuating period and the quiet period.
The diurnal variability of the TEC then shows an increase in the total electron content with a sunrise around 0500 LT and a peak observed around 1300 LT-1400 LT at the Niamey station under the two activities.
Patel et al. (2017) studied the variability of TEC-GPS under the northern crest of the Indian equatorial ionization anomaly region and obtained a trough around 0500 LT-0600 LT. They also found an increase in Total Electron Content with sunrise, a peak observed around the local afternoon between 1300LT and 1600LT and a gradual decrease after sunset. Ogwala et al. (2018) also observed the peak around local afternoon but the trough around 0400LT at the Birnin-Kebbi GPS station in northern Nigeria. Our investigations at the Niamey station are in agreement with the results presented by all these authors. However, small differences are observed in the times of occurrence of troughs and peaks at these different stations. The abrupt increase in TEC observed at sunrise is related to Extreme UltraViolet (EUV) radiation and the upward vertical drift E × B (Dabas et al., 2003; Hajra et al., 2016; Patel et al., 2017).
In Suranya et al. (2015), this increase is attributed to the southern winds. Due to the similarity observed between the variability of TEC under the two activities, we suggest that whatever the cause of the increase in TEC at sunrise, its impact on the ionosphere is almost the same during quiet activity and fluctuating activity at Niamey station at the solar maximum of cycle 23.
Ouattara (2009) and Ouattara et al. (2017) showed that fluctuating activity is generally predominant in the ascending phase of the sunspot cycle. Analyzing the sources of the equinoctial asymmetry of 1999 (year of ascending phase) and those of the equinoctial asymmetry of 2001 (year of maximum phase) at Niamey station, they achieved the following results: (1) the asymmetry of 1999 is the result of intense fluctuating activity, (2) the 2001 asymmetry is the result of intense shock activity. Therefore, we believe that the impact of fluctuating activity on the ionosphere would depend on its occurrence.
CONCLUSION
The study of the variability of the Total Electron Content (TEC) under fluctuating activity, from 2000 to 2002, at Niamey station, has shown that the influence of fluctuating activity is practically similar to that of quiet activity at the maximum of solar cycle 23 for the seasons. This allows us to think that the action of fluctuating activity on the ionosphere is very weak at the solar maximum.
CONFLICT OF INTERESTS
The authors have not declared any conflict of interests.
ACKNOWLEDGEMENT
The authors thank Rolland Fleury from IMT Bretagne,Technopole, Brest Iroise, France for his cooperation by providing Niamey CODG TEC data.
REFERENCES
|
Boutiouta S, Belbachir AH, Dekkiche H (2006). Contrôle de l'activité ionosphérique à partir des données GPS. Télédétection 5(4):325-338. |
|
|
D'ujanga FM, Opio P, Twinomugisha F (2017). Variation of total electron content with solar activity during the ascending phase of solar cycle 24 observed at Makerere University, Kampala. American Geophysical Union. In book: Ionospheric Space Weather 145-154 |
|
|
Dabas RS, Singh L, Lakshmi DR, Subramanyam P., Chopra P, Garg SC (2003). Evolution and dynamics of equatorial plasma bubbles: relationships to E × B drifts, post-sunset total electron content enhancements, and equatorial electrojet strength. Radio sciences 38 (4) : 1075 |
|
|
Hajra R, Chakraborty SK, Tsurutani BT, DasGupa A, E cher E, Brum CGM, Gonzalez WD, and Sobral JHA (2016). An empirical model of ionospheric total electron content (TEC) near the crest of the equatorial ionization anomaly. Journal of Space Weather and Space Climate 6 : A29. |
|
|
Legrand JP, Simon PA (1989). Solar cycle and geomagnetic activity : A review for geophysicists. Part I. The contributions to geomagnetic activity of shock waves and of the solar wind. Annales Geophysicae 7(6):565-578. |
|
|
Mayaud PN (1973). A hundred year series of geomagnetic data, 1868-1967, indices Aa, Storm sudden commencements. International Association of Geomagnetism and Aeronomy (IAGA) Bulletin (33). |
|
|
Ogwala A, Somoye E O, Ogunmodimu O, Adoniji-Adèle R A, Onori EO, Oyedokun O, Iheonu E (2018). Variation of Total Electron Content with sunspot number during the ascending and maximum phases of solar cycle 24 at Birnin-Kebbi. Annales Geophysicae Discussion 2018-95. |
|
|
Ouattara F (2009). Contribution à l'étude des relations entre les deux composantes du champ magnétique solaire et l'ionosphère équatoriale. Thèse de Doctorat d'Etat présentée à l'Université Cheikh Anta Diop de Dakar. |
|
|
Ouattara F, Amory-Mazaudier C (2009). "Solar-Geomagnetic Activity and Aa Indices toward a Standard." Journal of Atmospheric and Solar-Terrestrial Physics 71(17-18):1736-1748. |
|
|
Ouattara F, Zerbo JL, Kaboré M, Fleury R (2017). Investigation on equinoctial asymmetry observed in Niamey Station Center for Orbit Determination in Europe Total Electron Content (CODG TEC) variation during solar cycle 23. International Journal of Physical Sciences 12(22):308-321. |
|
|
Patel NC, Karia SP, and Pathak KN (2017). GPS-TEC Variation during Low to High Solar Activity Period (2010-2014) under the Northern Crest of Indian Equatorial Ionization Anomaly Region. Positioning 8(2):13-35. |
|
|
Richardson IG, Cane HV (2002). Sources of geomagnetic activity during nearly three solar cycles (1972-2000). Journal of Geophysical research 107(A8):1187. |
|
|
Richardson IG, Cliver EW, Cane HV (2000). Sources of geomagnetic activity over the solar cycle: Relative importance of coronal mass ejections, high-speed streams, and slow solar wind. Journal of Geophysical research A8:200-213. |
|
|
Sammuneh MA (2003). Contribution au positionnement en temps reel par GPS. Prédiction de la correction ionosphérique. Thèse de l'Observatoire de Paris en Dynamiques des Systèmes Gravitationnels. |
|
|
Suranya PL, Prasad DSVVD, Niranjan K, Rama Rao PSV (2015). Short term variability in foF2 and TEC over low latitude stations in the Indian sector. Indian Journal of Radio and Space Physics 44:14-27. |
|
|
Warnant R (1996). Etude du comportement du contenu électronique total et de ses irrégularités dans une région de latitude moyenne. Application aux calculs de positions relatives par GPS. Thèse de Doctorat, Observatoire Royal de Belgique. |
|
|
Zerbo JL, Amory Mazaudier C, Ouattara F, Richardson JD (2012). Solar wind and geomagnetism: toward a standard classification of geomagnetic activity from 1868 to 2009. In Annales Geophysicae 30(2):421-426). |
|
|
Zerbo JL, Ouattara F, Amory-Mazaudier C, Legrand JP, Richardson JD (2013). Solar Activity, Solar Wind and Geomagnetic Signatures. Atmospheric and Climate Sciences 3:610-617. |
|
|
Zoundi C, Ouattara F, Nanema E, Fleury R, Zougmore F (2013). CODG TEC variation during solar maximum and minimum over Niamey. European Scientific Journal 9(27):74-80. |
|
Copyright © 2024 Author(s) retain the copyright of this article.
This article is published under the terms of the Creative Commons Attribution License 4.0


