Full Length Research Paper

ABSTRACT
2D electrical resistivity imaging technique has been used to investigate the nature and dimensions of the fracture prone zones in Isu-Awaa, Enugu State, Nigeria. The study area lies within Latitude 06° 14I 0II N to 06° 17I 0II N and Longitudes 007° 23I 0II E to 007° 28I 0II E, with an area extent of about 51 Km2. The area is underlain by three main geological units (Enugu Shale, Owelli Sandstone and Mamu Formation). The study area is topographically undulating with high ridges surrounding the area. 2D electrical resistivity data was acquired with Wenner configuration, employing the roll-along technique to image the subsurface. A total of four (4) number 2D electrical resistivity imaging traverses were carried out. Data was processed and interpreted using RES2DINV. Measured and calculated apparent resistivity pseudo sections were convolved to generate the inverse model resistivity section, which was the diagnostic interpretative model used. Discontinuities in the layering are possible fracture zones. Major discontinuities were observed at distances of 48 and 87, 52.5, 106, 8.0 and 26 m at traverses A, B, C and D respectively. Fracture trend azimuth rose diagram, shows pre-dominant trend to the SE direction with minority to the SW and NW, and relicts to the NE directions. This conforms to the regional lineaments map of Nigeria. The use of 2D electrical resistivity imaging tool has proved useful in the mapping of fracture prone zones in the study area.
Key words: Electrical resistivity imaging, fracture lineaments, Rose diagram.
INTRODUCTION
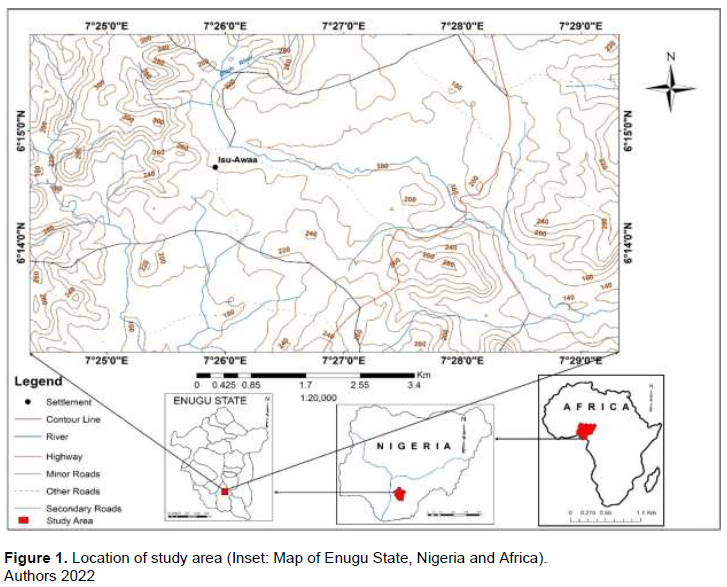
Isu-Awaa is located in Nkanu-west local government area in Enugu State (Figure 1). It lies within latitude 06° 14I 00II N to 06° 17I 00II N and longitude 007° 23I 00II E to 007° 28I 00II E with an area extent of about 51 km2.
Subsurface dynamics is complex with differential forces which tends to be tensional, compressional and coupling (Billings, 2001). These differential forces cause resultant stress (Griggs, et al., 1960) in the rock bodies which may lead to fracturing. Fracturing/fracture makes the subsurface susceptible to geoharzards and slope failures, which affect the construction of shallow and deep earthworks. Isu-Awaa is a community known for construction of high buildings with complex dimension. 2D Electrical Resistivity Imaging (ERI) as a veritable geophysical tool has proved useful in understanding these subsurface dynamics before constructing shallow and deep earthworks. Several authors have adopted 2D ERI technique to detect fractures (Charvez et al., 2014), cracks (Al-Zubedi, 2016), cavities and sinkholes (Schoor, 2002; Zhou et al., 2002; Thabit and Al-Zubedi, 2015; Amini and Ramazi, 2017). The present study hopes to image the lithological variation with depth, with the view of assessing the fracture lineaments and distribution, for the suitability of constructing high rise buildings, shallow and deep earthworks.
Physiography
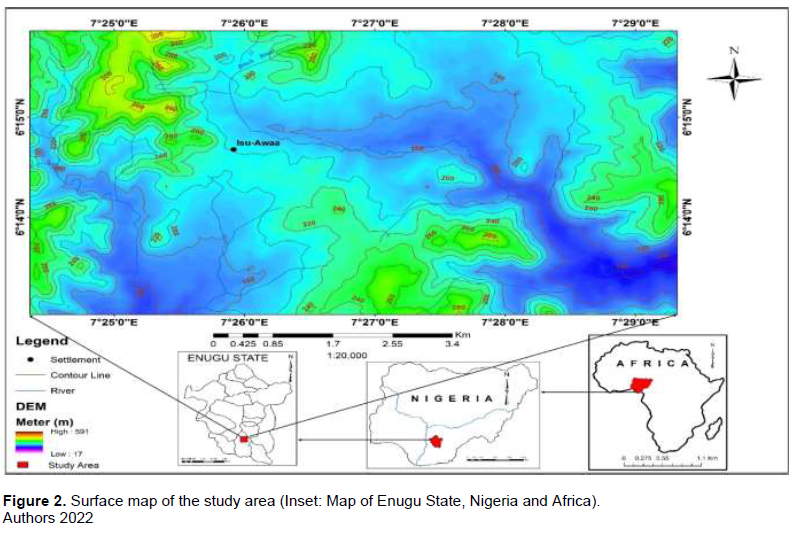
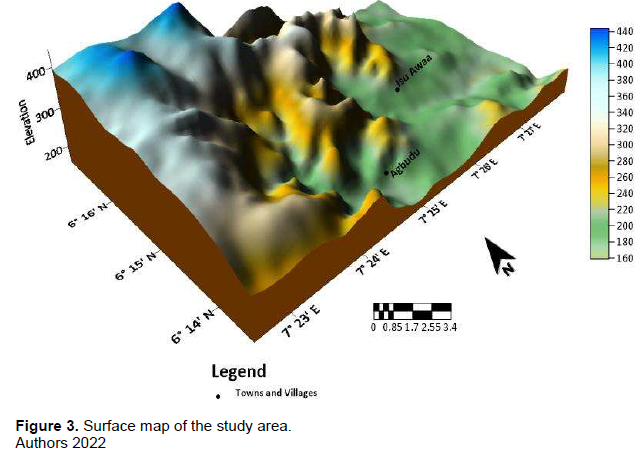
Isu-Awaa is a valley situated country with high ridges that exists at the NW and SE (Figure 2), with an elevation of about 500 m and low areas of less than 100 m at the central part of the study area. The high ridges (Figure 3) to the NW are part of Enugu Cuesta-Escarpment ridge. Generally, the landform in the study area is controlled by the geology of the area (Reyment, 1965). Areas that are underlain by shale units and unconsolidated sandstone area dominated by plain under 150 m above sea level, while areas that are underlain by consolidated sandstones are dominated with a high topography landform, because of its resistance to erosion and weathering.
Geology
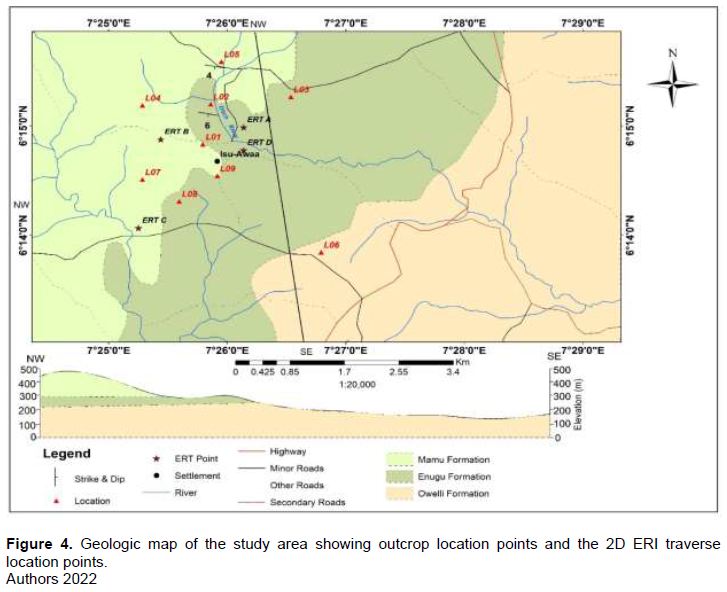
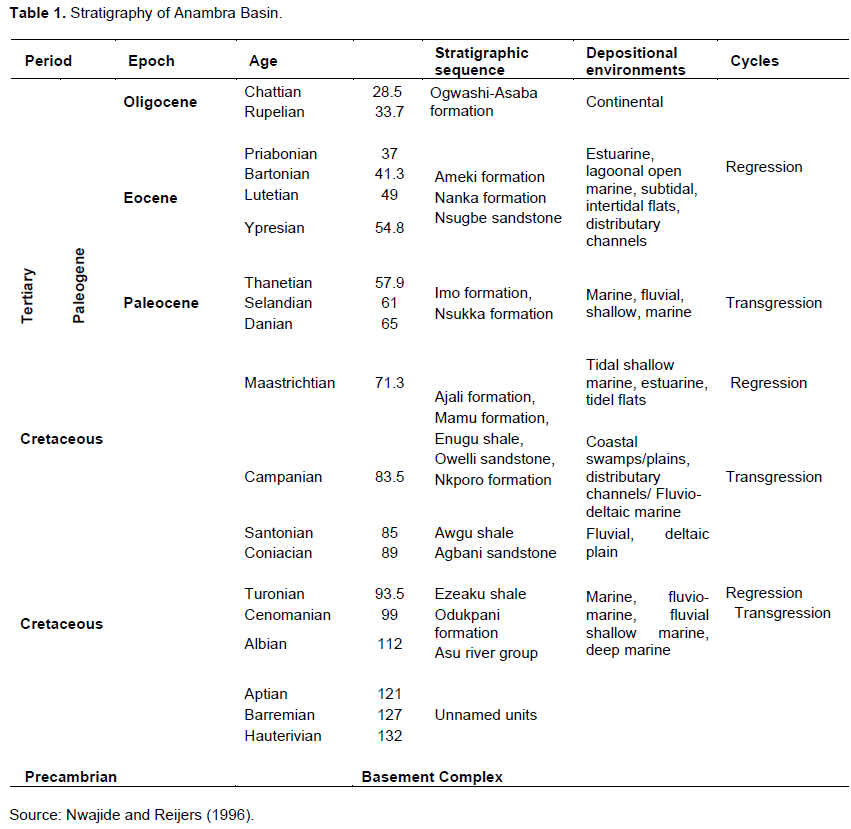
Isu-Awaa falls within the Anambra Basin which occurs in Southern Nigeria and covers an area of about 40,000 Km2. It is sandwiched between the Southern Benue Trough, Abakiliki Uplift, Bida Basin and the Niger Delta. Genetically, the origin and development of the basin is related to that of the Benue Trough (Murat, 1970). The basin is situated at the South-western extremity of the Benue Trough. Locally, the study area is underlain by three (3) lithostratigraphic units, which are of upper cretaceous in age. They are namely; Owelli Formation, Enugu Formation and Mamu Formation (Figure 4). The Owelli and Enugu Formation is Campanian in age while Mamu Formation is of Lower Maastrichtian in age (Table 1). The Owelli Formation is dominantly sandstones, highly indurated with numerous fractures. Enugu Formation consists of dominant basal shale, dark-grey, with a heterolithic horizon midsection. The Mamu formation is composed of shale with sandy lenses and coal seams.
MATERIALS AND METHODS
Geologic mapping
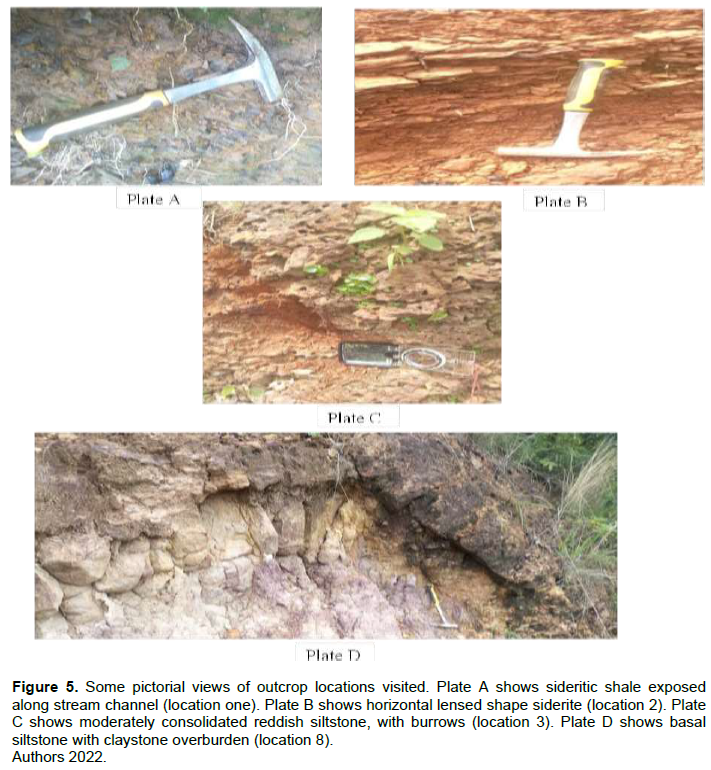
Detailed geologic mapping was carried out in the study area. A total of eight (8) outcrop locations were mapped (Figure 4). The aim was to identify fracture trends, measure azimuths for Rose diagram and the attitude of beds orientations and also take cognizance of the possible 2D ERI traverse locations. Pictorial views of some outcrop locations area is as shown in Figure 5.
Electrical resistivity (ER) method
Theoretical basis
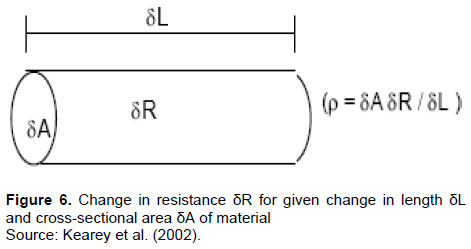
Subsurface studies are now commonly investigated using electrical resistivity (ER) surveys (Loke, 1999). The ER imaging is a geoelectrical method of obtaining high-resolution 2D or 3D image of the complex geology of the subsurface (Griffiths and Barker, 1993). The ER method is based on measurements of ground resistance, using two electrodes of the potential distribution arising when electric current is transmitted into geological layers through two other electrodes (Nwadike et al., 2017). The resistivity of the subsurface is affected by porosity, amount of water in the subsurface, ionic concentration of the pore fluid and composition of the subsurface material (Keller and Frischknecht, 1979). The ER technique is based on the response of the subsurface material to the flow of electric current transmitted through the current electrodes (AB) and with other two potential electrodes (MN) to record the resultant potential difference between them (Keller and Frischknecht, 1979). The electrical resistivity is the resistance offered by the opposite faces of a unit cube of material to direct current. The unit of resistivity is in Ohm-meter. The resistance (R) of the material having a resistivity (δ) over a length (L) and surface area of current flow (A) is given by R = δL/A (Figure 6). This is governed by Ohm’s law. The inverse of resistance of the geological formation is generally very high under dry conditions and decreases in clayey rocks. The presence of water containing salt even in minor amounts, geological formations makes them relatively conductive and as the moisture increases the resistivity falls deeply. As the salinity of the water increases, the resistivity of the rock formation decreases internally.
Different array configurations exist under the ER method. They are Schlumberger, Wenner, Dipole-dipole, Lee-partitioning, Pole-dipole, Dipole-pole, Pole-pole etc. These array configurations may be deployed for electrical surveys to study the subsurface. In the present study, the Wenner array configuration was deployed.
Field procedure and equipment
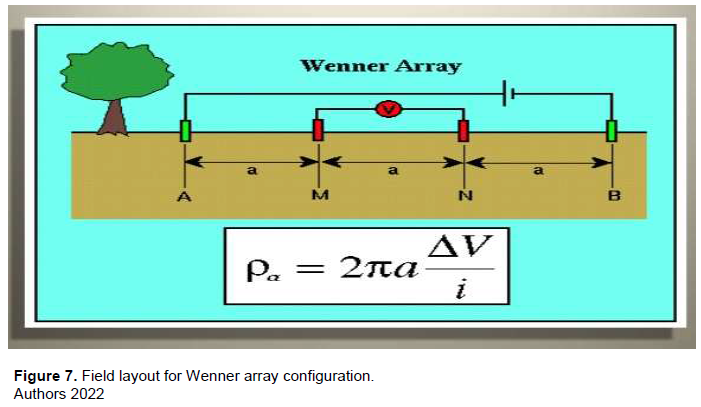
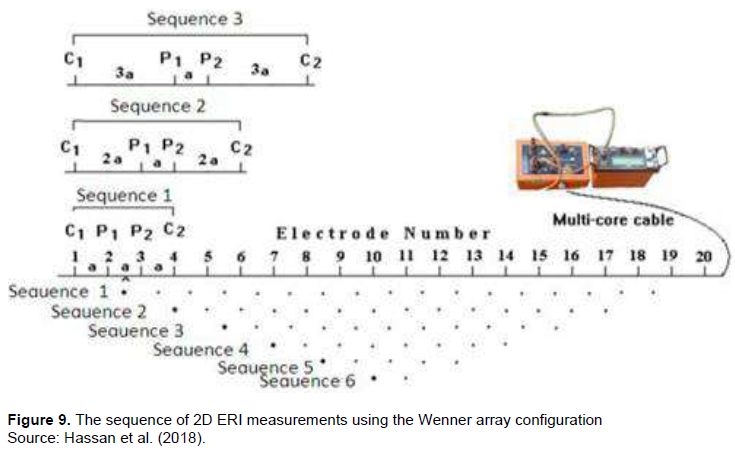
The field procedure involved firstly pre-geophysics. This preceded the geophysics data acquisition. Detailed geological mapping was carried out, where the nature of surface rocks observed and described. Trend of the fracture zones were measured, to enable construction of rose diagram. Secondly, the deployment of the Wenner array configuration. 4NO electrodes are spaced in a line at uniform distances (Figure 7). The field party is made of Six (6) crew members (Figure 8). Each electrode was manned by one crew member, that is, four (4) in numbers. While one crew member quality-check the cable lines to avoid cross-polars and tangling. For vertical depth exploration, the electrodes are expanded about a fixed center, increasing the spacing “a” in steps. For lateral exploration or mapping, the spacing remains constant and all four electrodes are moved (roll-along technique) along the line (Figure 9), then along another line and so on. In mapping, the apparent resistivity for each array position is plotted against the center of the spread. From the current (I) and voltage (V) values, an apparent resistivity (ρa) value is calculated. ρa = 2πaR, where 2πa equals K which is the geometric factor, that depends on the arrangement of the four electrodes. Resistivity meters normally give a resistance value, R = V/I, so in practice the apparent resistivity value is calculated by ρa = K*R. The calculated resistivity value is not the true resistivity value of the subsurface, but an “apparent” value which is the resistivity of a homogenous ground which will give the same resistance value for the same electrode arrangement. The relationship between the “apparent” resistivity and the “true” resistivity is a complex relationship. To determine the true subsurface resistivity, an inversion of the measured apparent resistivity values using a computer program must be carried out.

Data acquisition
The 2D ERI datasets was acquired at locations where surface fractures dominates and also where it was possible to achieve a - distance of about 180 m. A total of 4NO 2D ERI datasets (Figure 4) were acquired (Traverses A, B, C and D), with “a” spacing of 3 m (traverse A) and 5 m (traverse B, C and D) at the maximum spread of 100 to 150 m, with the spacing “a” as the station distance. Traverse A was acquired in a NW-SE trend direction; traverse B was also acquired in a NE-SW trend direction; traverse C acquired at a NE-SW trend direction while traverse D was acquired in a NW SE trend direction (Table 2).
Data processing
The apparent resistivity values were first computed by multiplying the field reading with the geometric factor K, using the excel toolkits. The computed apparent resistivity was then imported into the interpretative software; RES2DINV licensed 3.4 version for inversion (Loke, 1999). This software program filter data and automatically subdivides the subsurface into a number of blocks and then uses a least squares inversion scheme to determine the appropriate resistivity values for each block so that the calculated apparent resistivity values agrees with the measured apparent resistivity values from the field survey. The results were displayed as inverted model resistivity sections versus depth of the subsurface (peudosection).
RESULTS AND DISCUSSION
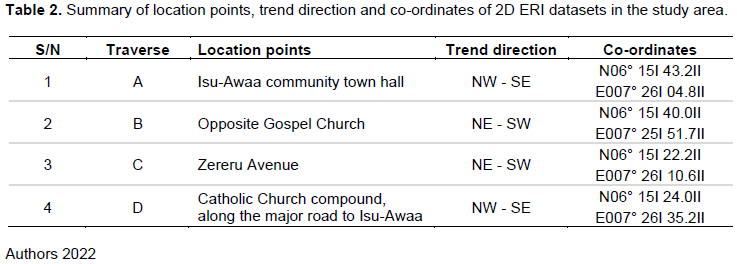
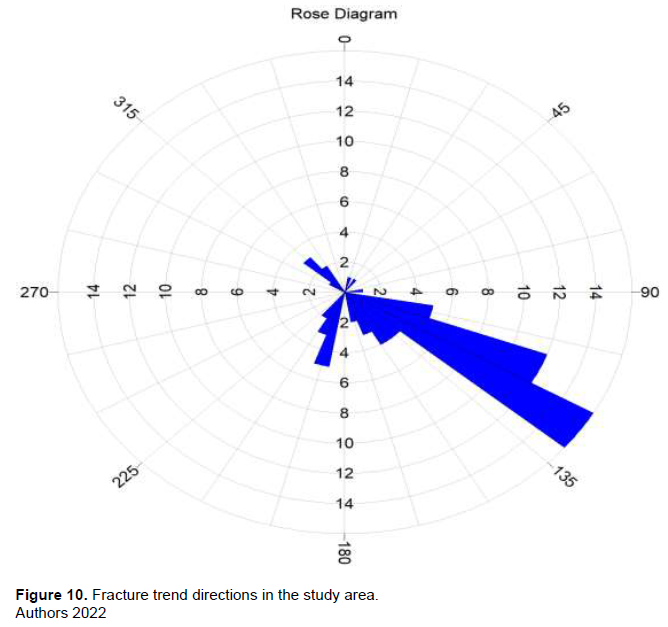
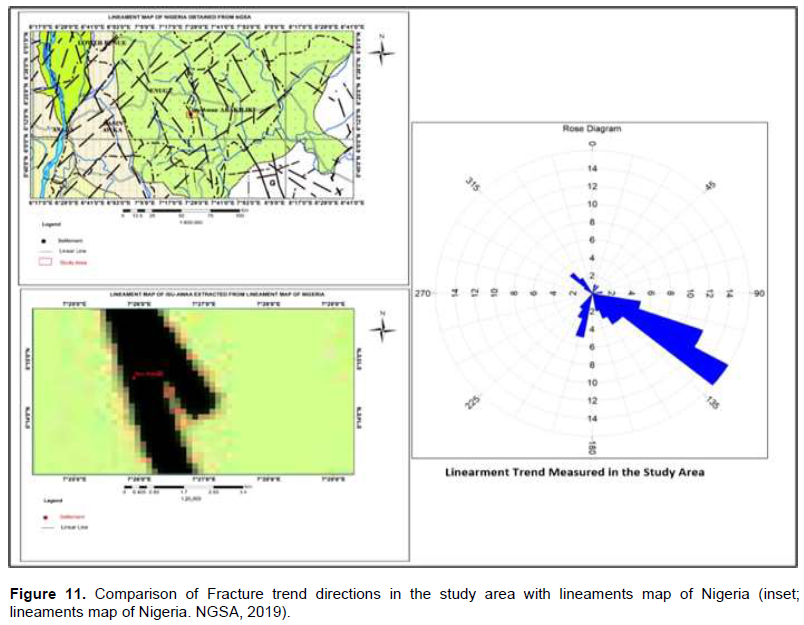
The produced geologic map (Figure 4) shows the distribution of rock units in the study area. It is generally underlain by Campano-Maastrichtian sediments, which are post-Santonian sedimentation (de Swardt and Casey, 1964). The area is dominantly shale-siltstone with bands of siderite, red-purple in colour. The observed fractures trend directions may be described as syngenetic in origin. As most of the fractures were not penetrative, rose diagram for the fracture trends directions was constructed using azimuths values of a total of 200 fracture trend directions. Based on the constructed rose diagram (Figure 10), the dominant stress direction was to the SE direction with relicts to the SW, NW and NE directions. More so, these stress direction are in conformity to the regional lineaments map of Nigeria (Figure 11).
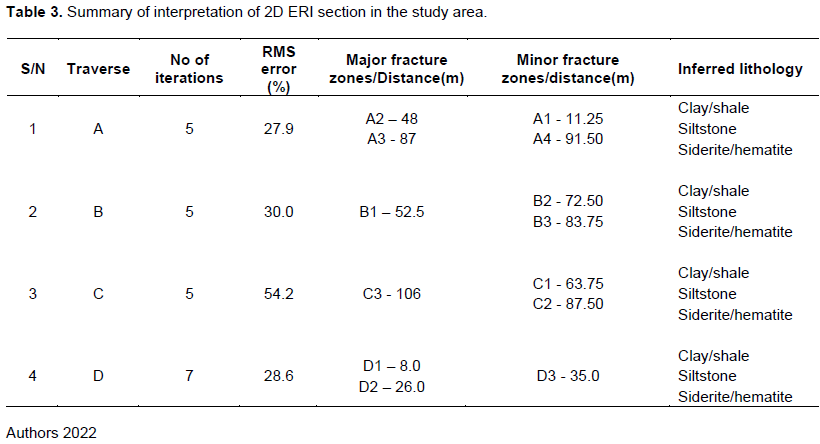
The inverse model resistivity section is the diagnostic interpretation model with the colour box indicating resistivity values in ohm-m. Layer discontinuities are possible fracture zones as observed in the inverse model resistivity. Major and minor fracture zones were observed (Table 3). Inferred lithological sequences in all traverses are clay/shale-siltstone-siderite/hematite rock types.
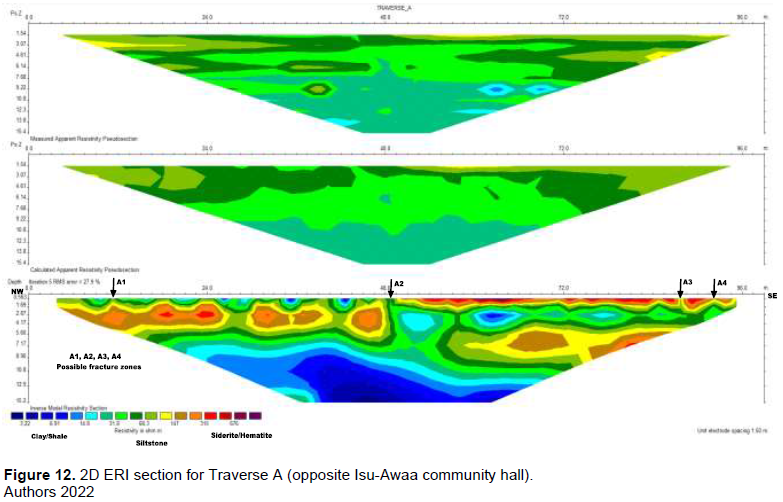
Traverse A
This extends to a distance of about 100 m and to a depth of 15 m in a NW-SE trend direction (Figure 12). Four number (4NO) possible fracture zones were observed from this section (A1, A2, A3, A4), with A2 and A3 showing major discontinuities in layering. They occurred at distances of 48 and 87 m. Eroded clay/shale surfaces exist up to a lateral distance of 48 m, with competent surfaces of siderite/hematite extending to the end of the traverse.
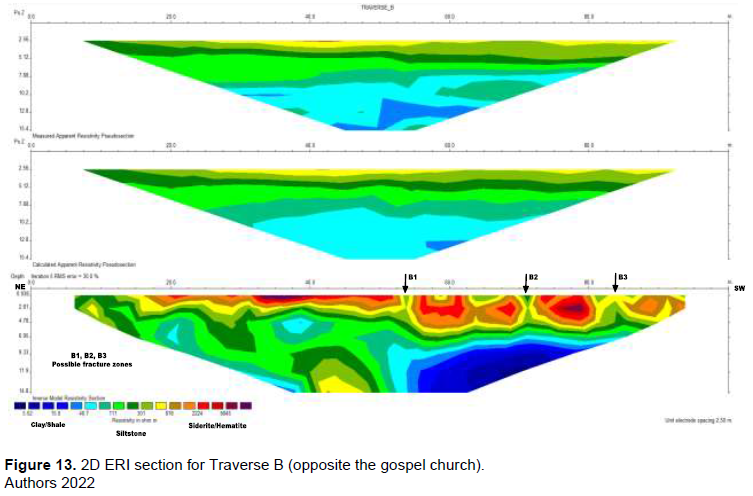
Traverse B
This extends to a distance of about 100 m and achieved a depth of 14 m in a NE-SW trend direction. Three number (3NO) possible fracture zones were also observed from this section (B1, B2, and B3) with B1 showing major discontinuity in layering, occurring at a lateral distance of 52.5 m (Figure 13). Competent rock surfaces largely exist as shown in the resistivity value range of 2224 to 6095 ?m.
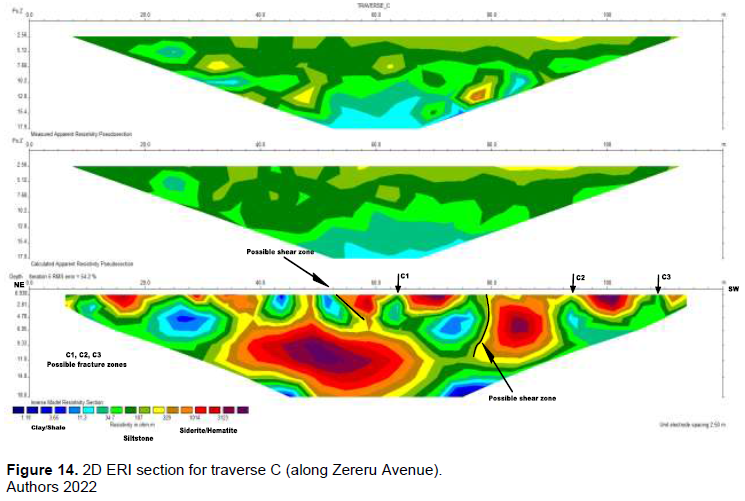
Traverse C
This covered a distance of about 120 m and probes to a depth of 18 m (Figure 14). Major siderite boulders occur at depth of 6 m between distances of 40 to 65 m. At 80 to 90 m distance another siderite boulder occurs at near surface. These siderite boulders show resistivity range of 1014 to 3123 ?m. 3NO possible fracture zones were observed from the section (C1, C2, C3), with C3 showing major discontinuity in layering, at a distance of 106 m along the traverse. Possible shear zone were also observed at distances of 55 and 80 m. This is an interface between clay/shale and siderite/hematite rock types. The traverse trends in a NE-SW direction.
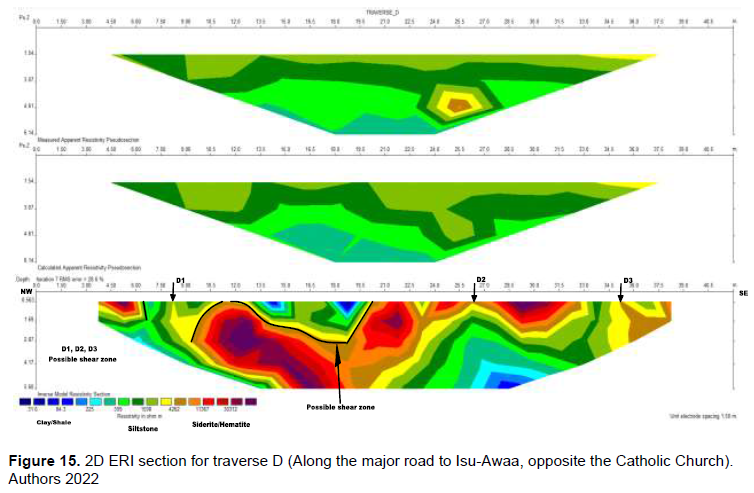
Traverse D
This traverse covers a distance of about 50 m and probes to a depth of 6 m. A major siderite boulder occurs between 10 to 13 m distance and extends to depths beyond 6 m. Near surface siderite boulder occur at 21 and 30 m distances. 3NO possible fracture zones were observed from the section (D1, D2, D3) with D1 and D2 showing major discontinuity in laying, at a distances of 8 and 26 m along the traverse (Figure 15).
CONCLUSION
Discontinuities in the layering were possible fracture zones. Interface between clay/shale and siderite/hematite were deciphered as possible weak zones, which overtime may result in displacement. From the study, there are observed fracture zones at Isu Awaa and they are not penetrative. They are in-filled and mostly syngenetic in origin. Competent rocks surfaces exist in the study area, even up to a depth of 2 m. But deep earthworks should not exceed depth of 20 m, as below this, are low resistivity rocks of clay/shale. Hence, the use of 2D ERI has proved useful in the investigation of fracture prone zones at Isu-Awaa.
CONFLICT OF INTERESTS
The authors have not declared any conflict of interests.
REFERENCES
|
Al-Zubedi AS (2016). Evaluation of five electrode arrays in imaging subsurface shallow targets: A case study. Iraqi Bulletin of Geology and Mining 16(2):39-46. |
|
|
Amini AA, Ramazi R (2017). Crsp, numerical results for an electrical resistivity array to detect underground cavities. Open Geosciences 9(1):13-23. |
|
|
Billings MP (2001). Structural Geology. Prentice Hall of India private Limited. 3rd Edition 606 p. |
|
|
Charvez RE, Tejero C-N G, A, Hernández-Quintero JE, Vargas D (2014). Special 3D electric resistivity tomography (ERT) array applied to detect buried fractures on urban areas, San. |
|
|
Griggs O, David T, Handlin J (1960). Observations on fracture and a hypothesis of earthquakes. Geological Society of America Memoirs 79:347-364. |
|
|
Hassan AA, AL-Awsi MD, Al-Obadi MM (2018). Application of 2D Electrical Resistivity Imaging Technique for Engineering site Investigation. Journal of University of Babylon, Pure and Applied Sciences 26(5):74-85. |
|
|
Kearey P, Brooks M, Hill I (2002). An introduction to geophysical exploration. Blackwell science. 3rd Edition. 262 p. |
|
|
Keller GV, Frischknecht FC (1979). Electrical methods in Geophysical prospecting. Perganon press Inc.: New York, No. 519:38-39. |
|
|
Loke MN (1999). Rapid 2D Resistivity and IP Inversion using the Least-Squares method. Advanced Geosciences, Inc.: Austin, TX. 57. |
|
|
Murat RC (1970). Stratigraphy and Paleogeography of Cretaceous and Lower Tertiary in the Southern Nigeria. In: Dessauvagie, T.F.G. and Whiteman, A.J., Eds., African Geology, University of Ibadan Press, Ibadan pp. 251-266. |
|
|
Nigeria Geological Survey Agency (NGSA) (2019). Lineaments map of Nigeria. Federal republic of Nigeria. 2nd Edition. |
|
|
Nwajide CS, Reijers TJA (1996). Sequence architecture in outcrops: examples from the Anambra Basin. NAPE Bulletin 11:23-32. |
|
|
Nwadike I, Ezeh CC, Okonkwo AC (2017). Two-dimensional electrical resistivity imaging of solid waste dumpsite at Ugwuaji, Enugu state, Nigeria. International research journal of natural and applied sciences 4(7):262-272. |
|
|
Schoor MV (2002). Detection of sinkholes using 2D electrical resistivity imaging. Journal of Applied Geophysics. 50(4):393-399. |
|
|
Thabit JM, Al-Zubedi AS (2015). Evaluation of three important electrode arrays in defining the vertical and horizontal structures in 2D imaging surveys. Iraqi Journal of Science. 15(56):1465-1470. |
|
|
de Swardt AN, Casey OP (1964). The coal resources of Nigeria. Geological survey of Nigeria. Bulletin No. 28. |
|
|
Reyment RA (1965). Aspects of Geology of Nigeria. Ibadan University press. 136p. |
|
|
Zhou W, Beck BF, Adams AL (2002). Effective electrode array in mapping karst hazards in electrical resistivity tomography. Environmental geology, 42(8):922-928. |
|
Copyright © 2024 Author(s) retain the copyright of this article.
This article is published under the terms of the Creative Commons Attribution License 4.0


