Full Length Research Paper

ABSTRACT
The main objective of this work is to study, develop and establish an approach through the mathematical model of performance CENERG under the term (MC). This model is used to characterize the parameters of photovoltaic systems in the literature. For this, we have considered the required performance is normally measured in standard test conditions (STC), where an average solar spectrum AM 1.5 is used, sunshine is normalized at 1000 W/m², and the cell temperature is set equal to 25°C. Modeling which is presented based on data provided by the manufacturers of solar cells or panels. The mathematical modeling process is performed with the model (MC) in search of the equations governing the operation of LRAER group photovoltaic panels, to that end, we can determine the parameters of the mathematical model (MC). The work also allows showing accuracies, through the comparison of the simulation results obtained with the actual production data (experimental) to ATERSA 75 W modules of the LRAER USTM.
Key words: PV generator model (GPV), CENERG mathematical model, characteristics I (V), characteristics P(V).
INTRODUCTION
The mathematical model proposed for the realization of this work is that of CENERG. This model was validated experimentally by the Energy Center in Sophia Antipolis (Chenni et al., 2007). The most important thing to remember for this model is that it provides a method to calculate the PV module performance from data provided by the manufacturers (Belhadj et al., 2010).
Thus, with this model, we propose a study to highlight the influence of several parameters (temperature, Rs resistance, resistance Rsh and sunshine) for the determination of the characteristic I(V) and P(V) through the simulation of all the characteristics of the GPV. Each time, it will be proposed in this work a comparison between simulation results and those of the manufacturer for the test module ATERSA 75 W, looking for accuracy, compliance results with those known in the literature (Khazzar and Zereg, 2010; Bonkoungou et al., 2013; Zhou et al., 2007; El Ouariachi et al., 2009). For this, it will be conducted comparing the results obtained by simulation (MC) and the experimental results. In addition, it will be added to this job just at the end, a comparison in terms of errors between the simulation of the power of the numerical model and the results of experimentally recorded parameters on LRAER site.
Thereafter, it will be checked behavior through the comparison of errors between the experimental and simulated powers during the most remarkable days with those given by the experimental site, to be able to comment on the accuracy of the model Digital (MC) used in this work. In addition, this error will be expanded compared to the parameters of the photovoltaic panel manufacturer.
In the end, the discussion will be addressed on the results achieved as part of this work will be based on a comparison of the simulation results, those data by the manufacturer and those recorded by the experimental site.
METHODOLOGY
Experimental device LRAER
The experimental device is designed to give it the electrical energy from two sources to charge the storage system to meet the demand coverage expenses.
Constituents of the experimental device
This is achieved thanks to the photovoltaic generator LRAER which consists of 16 modules (Atersa). Its configuration provides four panels (Figure 1), which are connected in series for (48 V) and then they are placed in parallel with the other groups (Yahya et al., 2011). Total peak power of the system is 1.2 kWp. The surface of the generator system is 8.6 m².
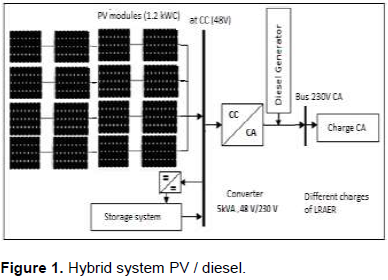
It is important to note that the capacity of the storage system (1200 Ah). The energy storage device implanted in this hybrid system is connected directly (Yahfdhou et al., 2013) to the DC bus. It therefore has 24 storage cells, of 2 V. The elements are connected in series. The DC bus is connected to AC mains via a reversible power converter 5 Kw, brand Trace Engineering SW. It will add the converter should be able to deliver higher power peaks of the load. This configuration is proposed in Figure 1.
In addition, this production system is fully automated. Various measuring sensors have been installed and allow us to obtain the data of the entire hybrid system: The speed and direction of wind, sunshine on the horizontal plane, the ambient temperature, module temperature, the electricity production of wind turbines, the electrical output of photovoltaic array, the generator and the operating voltage of the DC bus.
Also note that the experimental device is coupled with a desalination unit brackish water (reverse osmosis) and other equipment (computers, lighting and motors).
PV array features
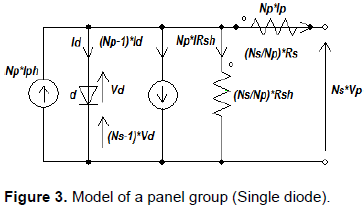
Above, it is proposed to the manufacturer of the photovoltaic panel in Table 1.
Electric models of the PV generator (GPV)
In the literature, there are several electric models that describe the operation and behavior of the PV array. These models differ in the procedure calculates the precision and the number of parameters involved in the digital model.
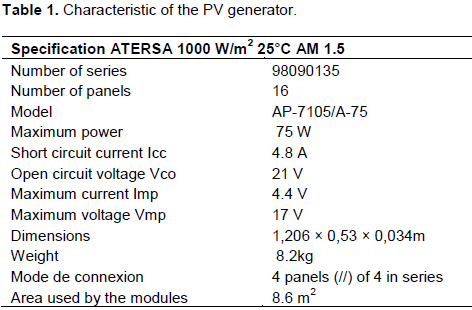
Indeed, on the basis of the analysis of the configurations proposed in the literature (Dumbs, 1999). Two models (Model GPV diode 1 and its panel array pattern) were proposed shown in Figures 2 and 3.
In this context, the model 1 diode GPV (Figure 2) shows the physical phenomena governing most interactions related to various materials used in the panels or to a larger scale in the equivalent generator LRAER (Figure 3).
The model of Figure 2 is processed to obtain the equivalent diagram of Figure 3, as follows:
Numerical modeling models
The choice of mathematical model that simulates the behavior of photovoltaic panel is determined by the type of problems to be studied. This model can be considered simply an analysis of the influence of meteorological parameters. Similarly, the model also solves the choice of the size of the system to install. Thus, regarding the modeling of GPV, bibliographic study found the model that is developed by the Energy Center (Cenreg). This model is based in this case on the model to 1 diode.
Mathematical models MC with 1 diode
The mathematical model includes the following variables in Figure 3:
ES: Irradiance on the panels (W / m2),
Tj: Temperature of junction of the cells (°C)
IG: Current of panels group (A)
VG: Tension in the terminal group (V).
The equation that characterizes the Figure 2 of GPV will be as follows:

The current Iph of panels is given by the following equation:

Where Eref is the reference sunshine at 1000 W/m2 and Tref is the reference temperature 25°C; P1, P2, and P3 are constant parameters.
The current passing through the diode is given by:
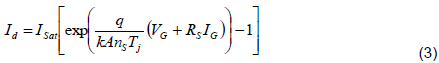
Where: Isat = saturation current (A); q = Elementary charge (1.6*10-19 C); k = Constant of Boltzman (1.38*10-23 J/K); nS = Number of cells; A = Ideality factor.
The saturation current:
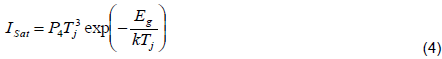
EG is the energy gap and P4 is a constant parameter.
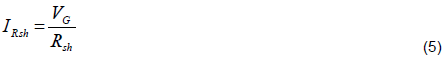
The shunt current is given as follows:
So we can write the final equation for the group as follows:
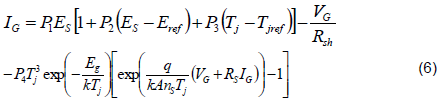
We found that this equation translates the action of the GPV and is a function of the form:

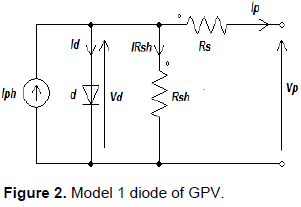
Mathematical models MC with 1 diode for panel group
The equation of the characteristic relating to a module array is formed by the series arrangement of modules Ms and Mp parallel modules, is extrapolated from that of a photovoltaic module and is given in (Gergaud et al., 2002). Indeed, Figure 3 is used to write the equations for the panels group as follows:
Iph = Np*Iph
IG = Np*Ip
Id= Np*Id
IRsh = Np*IRsh
Vd = Ns*Vd
VG = Ns*Vp
Rs = (Ns/Np) *Rs
Rsh = (Ns/Np) *Rsh
Under these conditions, we are called to determine the Equation 6 the following seven parameters: P1, P2, P3, P4, A, Rs, Rsh. In addition, we are also called to account for the photovoltaic system requirements LRAER generation, which says the equivalent mathematical model of the LRAER system is only valid if the modules are identical and face the weather changes the same site.
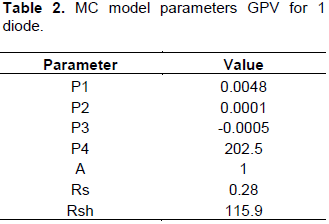
MC model parameters with 1 diode
To determine the MC model parameters to 1 diode, use the input provided by the manufacturer's documentation in Table 1 and the data provided by the LRAER data acquisition system in terms of sunshine and temperatures. These data will allow achieving the extraction of parameters in the result of this work through the resolution of the Equation 6.
Extractions parameters for ATERSA 75 W
These parameters are not measurable quantities and are not usually included in the manufacturer's data. Therefore, they must be determined from the characteristics of GPV, based on actual data from the data acquisition system.
For extracting ATERSA 75 W parameters, there was used the MC model 1 diode. So that the coefficients P1, P2, P3, P4, A, R, and Rsh in equations are identified and experimentally validated. Against by the electric power of GPV be determined by calculation by multiplying the voltage V and the calculated intensity I in Equation 6. This method of extraction parameters using the experimental data of the data acquisition system enables more reliable fi characterization of the actual behavior of the GPV. Thus, the parameters of the polynomial model were determined, they were from three outstanding points are:
1. In the short-circuit current (Icc), we have (0, Icc),
2. For the open circuit voltage (Voc), we (Voc, 0),
3. For maximum power point (Vmp, Imp).
The result of the parameter identification is presented in Table 2.
RESULTS OF SIMULATION
Indeed, mathematical models developed in this work will be presented Matlab to realize the different simulations in line with the objectives that were defined in the introduction. Indeed, the simulation results, their details and their agreements with the physical phenomena known to the GPV is either a validation of the numerical model (MC).
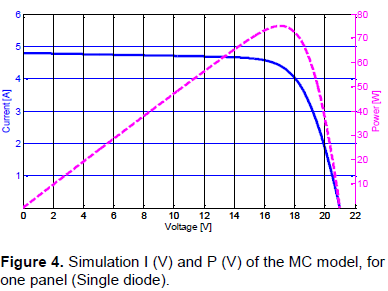
Simulation I (V) and P (V) for the model with one diode of the GPV (G = 1000 W / m2 T = 298.2 K)
Since we noticed that in Figure 4, for a simulated sunlight of G = 1000 W/m², the current Isc is equal to 4.8A for a value of the open circuit voltage close to 21V.The power is reached to climax (17 V, 75 W). As against the maximum power reached is close to 75 W and voltage 17 V (maximum: Vmp) correspond to the characteristics of the PV array (Table 1). That said, the features that are simulated I (V) and P (V) of GPV are in perfect agreement with the manufacturer data (Table 1). This leads to say that digital model that was the basis for this simulation reflects the physical processes governing the GPV.
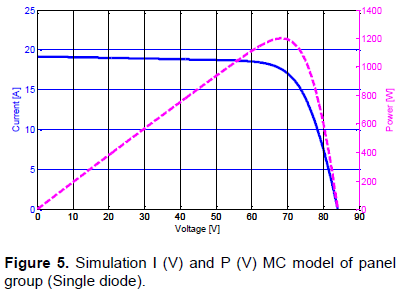
Simulation of panel group (GPV)
The GPV of LRAER is performed to obtain a voltage compatible with the load. For more tension, it was assembled Ns modules in series, by cons for the generated current, Np number of parallel modules has been added, serial and parallel protection diodes protect the circuit against the current return.
The characteristics in Figure 5 of the series connection of the panels and has an open circuit voltage equal to the sum of the voltages to the four panels, 84 V and a short-circuit current equal to the sum of short currents - individual circuits of the four panels, that is to say, it is close to 19.2 A. this means that the physical phenomena that were recorded for a panel, have been renewed for the panel group (Figure 5).
Influence of the resistance Rs for GPV, (G = 1000 W/m2, T=298.2 K)
The series resistance acts on the slope of thecharacteristic, Figure 6, without apparent influence in the area where the panel behaves as a current generator (right near 19 A) against, it acts with an apparent influence on the slope of tension, and when it is high, it decreases the current value of short circuit. Power degrades with increase of the series resistance. A small change in P (V) is noticed to the right of the feature, significantly, the color pink, gives the line. Also note that in general, the performance of a photovoltaic panel is even more degraded than Rs is great.
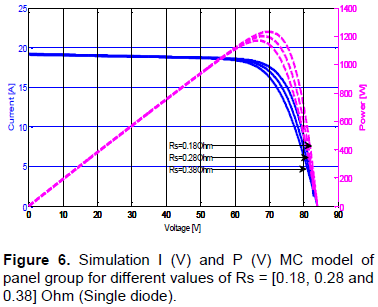
The simulation is performed and found a very good correlation between simulation results to the manufacturer. They are consistent with the physical phenomena recorded in the literature.
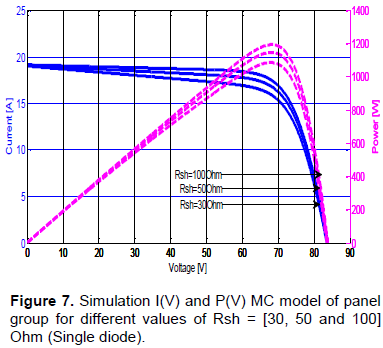
Influence of the resistance Rsh for GPV, (G=1000 W/m2, T=298.2 K)
The shunt resistance is directly related to the manufacturing process, and its influence is felt as current values that are close to the short-circuit current. The Figure 7 shows that this influence is reflected by an increase in the slope of the curve I (V) GPV in the area corresponding to operation as a current source. This is because it takes subtracting the photocurrent, besides the direct current diode, an additional current varies with the voltage developed. For the curve P (V) changes Rsh is carried out in the same zone as I (V). Thus, it has been noticed that the influence of the shunt resistor which has been translated through the parameters that have been extracted is in agreement with the physical phenomena.
Influence of sunshine on I(V) and P(V)
The simulation results of the characteristics I (V) and P (V) GPV are made to see the influence of the sunshine, this is obtained by fixing the ambient temperature (T = 25°C) and varying sunshine in an appropriate range.
The Figure 8 shows the influence of sunlight on the characteristic I = f (V). If a constant temperature is maintained, we see that the current undergoing a major change, but against the voltage varies slightly.
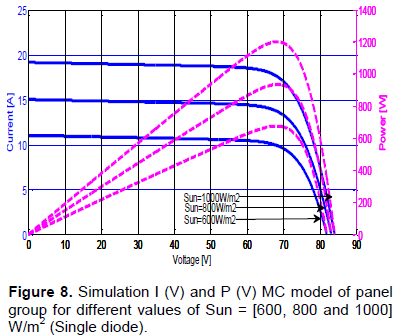
Because the short circuit current is a linear function of the illumination while the open circuit voltage is a logarithmic function. We varied the level of sunshine G and traced the GPV features.
The Figure 8 illustrates the variation of the power delivered by the generator function of the voltage for different illuminance values ​​which allows us to infer that the physical phenomena recorded in this case it’s in perfect agreement with those of the literature and specifications of the manufacturer. There by that the numerical model (MC) and its parameters are extracted correctly reflect the physical phenomena in the case of the influence of illumination on the characteristic I (V) and P (V).
Influence of temperature on I(V) and P(V)
The GPV is constructed so that it is sufficient to obtain a voltage compatible with the load. To illustrate better this, remember, the Boltzmann equation gives: Is = Io exp (eVo / kT).
Experience shows that the open circuit voltage of a solar cell decreases with increasing cell temperature. We present in Figure 9, the characteristic I (V) of GPV for a given level of sunshine G and varying temperatures. The short circuit current, by cons, increases slightly with the temperature on the GPV. Figure 9 further shows the influence of temperature on the characteristic I = f (V). It is essential to understand the changing effect of the temperature of a GPV on the characteristic I = f (V).
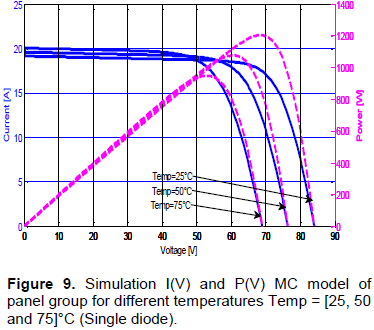
The current depends on the temperature, since the current increases slightly as the temperature increases, but the temperature negatively affects the open circuit voltage. When the temperature increases the open circuit voltage decreases. Therefore, the maximum power of the generator undergoes a decrease. The power curve P (V) in Figure 9 also illustrates the variation of the power delivered by the generator depending on the voltage for different values ​​of the temperature, which allows us to infer the influence of temperature on the characteristic P (V) and in perfect agreement with the physical phenomena encountered in the literature (Alrashidi et al., 2011; Zadeh and Rezazadeh, 2013; Villalva et al., 2009). This, once again confirms that the digital model and its parameters are extracted illustrate the operation of the GPV.
Validation by comparing the generated and simulated powers
Thus, if in Part Result of Simulation, it was observed that the numerical model reflects the physical phenomena in the form and not to mention the exact meaning which governs the operation of GPV known in the literature. Furthermore, it is important to check their behavior by comparing the experimental and simulated powers during the most remarkable days in order to comment on the accuracy of the numerical model (MC) used in this work.
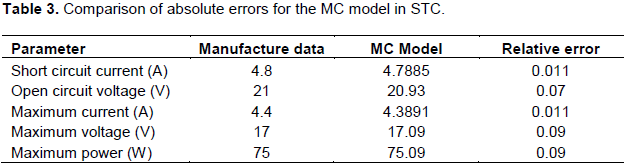
In addition, the idea sought to consolidate it was given in Table 3 for comparison, the parameters of the manufacturer of the photovoltaic panel and the MC model.
In this part, it was verified if the model (MC) was able to predict the PV system performance in terms of power. And to validate the model, we chose three typical days (Figures 10 and 11): A sunny day (maximum 720 W, a day a little less sunny (maximum 700 W) and a cloudy day with short periods of irradiation high solar (lower to 600 W). Indeed, the GPV of output power for MC (Figure 9) visually shows a negligible difference between the numerical model and the experimental. We note that the two models (numerical and experimental) is follow to deepen these visual examples, we propose the Table 3, for more precision.
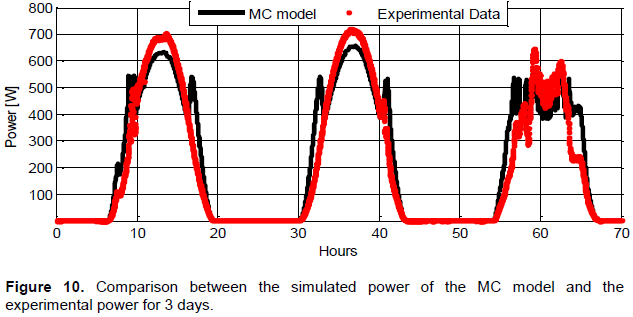
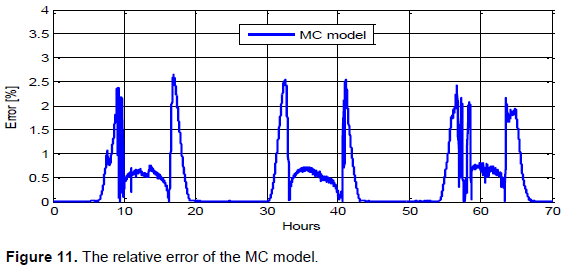
Table 3 provides a comparison between the parameters of the manufacturer of the photovoltaic panel and those of the MC model. Regarding the example of the short-circuit current, the relative error between the data of the manufacturer and the model MC, respectively 0.011 for the short-circuit current, and 0.07 for the circuit voltage which shows that our model reflects the actual behavior of the system LRAER.
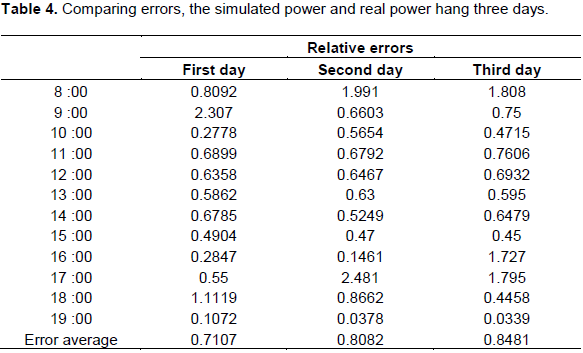
By cons, in Table 4, we give a comparison, experimentally recorded parameters on LRAER the site for three days per hour and simulated data model MC GPV. With respect, these relative error values, shows the degree of accuracy of the results, through the confrontation of the numerical model and the experimental data. The results are acceptable to prove that the choice of the numerical model (MC) is a conclusive choice.
DISCUSSION
We have in this work, an approach adopted to research the parameters of electrical circuits, considered complex in the literature through the numerical model (MC), which were subsequently validated throughout workflow. The equations that were developed previously for the MC method of the current-voltage characteristic parameter calculations were simulated in the Matlab environment for the test module ATERSA 75 W and the GPV of the LRAER system. It is important to note that not only has been proposed electrical circuit and the corresponding numerical model to a panel of GPV LRAER, but it was extracted parameters, to apply later in a similar way for grouping. Then it was carried out simulations for a panel and the GPV Group of LRAER.
The results were compared with those supplied by the manufacturer. The remarks were reported in the figures that were simulated the characteristics given points for the short-circuit current and open circuit voltage are the same with those given by the manufacturer, without forgetting the details that are registered to the point maximum power.
To strengthen these results, it was conducted comparing the results obtained by simulation (MC) and the experimental results are from the experimental site, it was found that the GPV performance results depend largely on temperature, sunlight of resistance Rsh and Rs and these results are consistent with the physical phenomena already observed in the literature to comfort our approach. Simulation results also comforted the digital model because they have the physical phenomena that are recorded in the literature for this type of installation. In the end, it was made a comparison in terms of errors between the simulation of the power of the numerical model and the results of experimentally recorded parameters on LRAER site. This comparison showed a perfect agreement that strengthens the performance of our model.
CONCLUSION
This paper presents the modeling of GPV through the model (MC) to describe its behavior in the conditions of use in the Sahel. The MC resolution method was presented in detail. She identified various specific parameters of GPV. The numerical model (MC) that was presented was also used to simulate all the features shown in the various Figures 4 to 11. Each time, a comparison was undertaken with the results of simulations and data from the manufacturer for the test module ATERSA 75 W and those of the GPV of the LRAER system, to conclude with great accuracy on the compliance of results with those are known in the literature.
The small differences that are sometimes recorded do not create a disagreement with the results that were obtained. The physical phenomena observed in the simulations are in perfect agreement with those noted by the researchers of the discipline.
CONFLICT OF INTERESTS
The authors have not declared any conflict of interests.
NOMENCLATURE
STC, Standard test condition; GPV, Generator Photovoltaic; I, current provided by cell; K, Boltzmann's constant (1.38.10-23 Joules / Kelvin); T, temperature of cell in Kelvin; V, the voltage across the cell; RS, The series resistance; Ns, Number of cell; Id, The current of PN junction of the diode; Es, sunshine in the panels of group (W/m2); IPh, Current-photon of the cell; Tj, Junction Temperature cell (°C); IG, current provided by panels (A); VG, Tension in the terminal group (V). (V); ISat, Saturation current; A, Ideality factor; Eg, gaps energy; Eref, Sunshine of reference 1000W/m2; Tref, Sunshine of reference at 25°C; q, Elementary charge (1;6.10-19C); P1, P2, P3, P4, P5, are constant parameters.
REFERENCES
|
Alrashidi MR, Alhajri F, El-naggar KM, Al-othman KA (2011). A new estimation approach for determining the I-V characteristics of solar cells. Sol. Energy 85:1543-1550. |
|
|
Belhadj R, Benouaz CA, Bekkouche SMA (2010). Estimation de la puissance maximale produite par un générateur photovoltaïque. Rev. Energies Renouvelables 13(N°2):257-264. |
|
|
Bonkoungou M, Koalaga Z, Njomo D (2013). Modeling and simulation of photovoltaic module considering single-diode equivalent circuit model in Matlab. Int. J. Emerg. Technol. Adv. Eng. 3(3):493-502. |
|
|
Chenni R, Makhlouf M, Kerbache T, Bouzid A (2007). A Detailed Modelling Method forPhotovoltaic Cells. Energy 32(N°9):1724-1730. |
|
|
Dumbs C (1999). Développement d'outils pour l'analyse des systèmes hybrides photovoltaïques diesel' : Ecole des Mines de Paris, 1999. |
|
|
El Ouariachi M, Mrabti T, Tidhaf B, Kassmi K (2009). Regulation of the electric power provided by the panels of the photovoltaic systems. Int. J. Phys. Sci. 4(5):294-309. |
|
|
Gergaud O, Multon B, Ben Ahmed H (2002). Analysis and Experimental Validation of Various Photovoltaic System Models. Electrimacs Aug 2002, Montreal, Canada. 6 p. |
|
|
Khazzar R, Zereg M (2010). Comparaison entre les différents modèles électriques et détermination des paramètres de la caractéristique I-V d'un module photovoltaïque. Rev. Energies Renouvelables 13(N°3):379-388. |
|
|
Villalva MG, Gazoli JR, Filho ER (2009). Comprehensive approach to modeling and simulation of photovoltaic arrays. IEEE Trans. Power Electron. 24(5):1198-1208. |
|
|
Yahfdhou A, Mahmoud AK, Youm I (2013). Modeling and optimization of photovoltaic generator with Matlab/Simulink. Int. J. I Tech. E Eng. 3(4):108-111. |
|
|
Yahya M, Kader A, Iyoum A (2011). Behavior and performance of a photovoltaic generator in real time. Int. J. Phys. Sci. 6(18):4361-4367. |
|
|
Zadeh AA, Rezazadeh A (2013). Artificial bee swarm optimization algorithm for parameters identifications of solar cell modules. Appl. Energy 102:943-949. |
|
|
Zhou W, Yang H, Fang Z (2007). A novel model for photovoltaic array performance prediction. Appl. Energy 84:1187-1198. |
|
Copyright © 2024 Author(s) retain the copyright of this article.
This article is published under the terms of the Creative Commons Attribution License 4.0


