Full Length Research Paper

ABSTRACT
This article examines magnetics clouds activity day’s occurrence as a function of the different phases of the solar cycle and the duration of their geoeffectiveness. The study period extends from cycle 11 to cycle 24. Magnetic clouds activity day’s occurrence were identified using pixel diagram from the years 1867 to 2019, that is to say, fourteen (14) solar cycles. The results show that in the study period: (1) there were 802 days of magnetic cloud activity with an effect lasting 1 day, 284 with an effect lasting 2 days and 141 having an effect three days; (2) the largest proportions of magnetic cloud activity days are recorded at maximum phase of the solar cycle, regardless of the type of magnetic cloud activity. These results also reveal that on average, there are 13 magnetic cloud activity days per year at the solar phase maximum.
Key words: Occurrences, pixel diagram, magnetic clouds, geoeffectivity.
INTRODUCTION
The Sun has a magnetic field which results from the differential rotational speeds of its radiative zone and its convective zone. Solar activity is known as the manifestations of the solar magnetic field (Ouattara 2009). This phenomenon occurs according to a fairly regular cycle of around eleven (11) years (Ouattara et al., 2015). In the vicinity of the Earth, certain solar events disturb the terrestrial environment (magnetosphere and ionosphere). These disturbances can give rise to short-term variation in Earth’s magnetic field called, geomagnetic activity. The geoeffectiveness of a solar event is known as its ability to generate disturbances on the Earth's magnetosphere and within this structure. In order to identify the solar sources responsible for the various geomagnetic disturbances observed in the vicinity of the Earth, Legrand and Simon (1989) and Simon and Legrand (1989) proposed to divide geomagnetic activity into four classes. Thus, we note (1) quiet activity due to slow solar wind coming from solar heliosheet, (2) recurrent activity due to solar high wind stream coming from coronal holes, (3) shock activity due to Coronal Mass Ejections (CMEs) and (4) fluctuating activity, consequences of fluctuating solar heliosheet. Zerbo et al. (2012) extends the previous study by breaking down the fluctuating activity class. In this study, we are interested in magnetic clouds activities. Indeed, previous studies have shown that around 80% of magnetic clouds are geoeffective (Zhang et al., 2004; Echer et al., 2005).
As a result, most of them are responsible for the most intense geomagnetic storms (Echer et al., 2008a, b). Magnetic clouds are a specialized subset of interplanetary coronal mass ejections (ICME) comprising between one-third (Gosling, 1990) and one-half (Cane et al., 1997) of all ICME events. In terms of composition, these clouds are regions formed by a high magnetic field, low temperature of protons, low amounts of protons and a slowly rotating magnetic field (Burlaga et al., 1981). Geomagnetic storms caused by magnetic clouds are referred to as magnetic cloud activity. Magnetic cloud activity days correspond to the days when magnetic clouds disturb the geomagnetic field and thus cause geomagnetic activity.
The aim of this article is to make a statistical study of magnetic clouds activity days occurrence taking into account the duration of their effects and the phases of solar cycles 11 to 24. These days are identified using the pixel diagram (Ouattara and Mazaudier, 2009). It is important to note that the pixel diagram represents geomagnetic data as a function of solar activity for each Bartels rotation (27 days). They report on the geoeffectiveness of solar events in general and the activities of magnetic clouds in particular.
DATA AND METHODOLOGY
Determination of magnetic cloud activity days
For this study, we used the values of the index aa and the dates of the SSCs to construct the pixel diagram plots of the year corresponding to this study. This diagram was used to select magnetic cloud activity days. The values of the aa index and the data of the SSCs are available on the ISGI website. The values of the solar index Rz were used to determine the solar phases. They are available on the OMNIWEB website. The different types of magnetic clouds activity are identified from 152-pixel diagrams (representing pixel diagrams from 1868 to 2019). Figure 1 is an example of a pixel diagram (pixel diagram of the year 2000).

Magnetic cloud activity days correspond to SSC days for which Aa indices are between 20 and 40 nT over one, two or three days (Zerbo et al., 2012). Figure 1 show examples of days of magnetic cloud activity of 1 day duration (January 27 activity); 2 days duration (activity from June 23-24) and 3 days duration (activity from May 1-3).
Determination of the different phases of the solar cycle
To determine the solar phases, we used the values of the solar index Rz and adopt the method used by Ouattara (2009), Nanéma and Ouattara (2013), Guibula et al. (2017), and Sandwidi et al. (2020). According to this method, the different phases of solar cycle are defined in Table 1.
For small solar cycles, that is, those whose maximum number of spots is less than 100 (case of solar cycles 12, 13, 14 and 16), the phase maximum is obtained for number of spots greater than 0.8 times the maximum spot number (Rz > 0.8 × Rz max).
RESULTS AND DISCUSSION
Referring to Table 2, between 1868 and 2019 there are 37 years belonging to the phase minimum, 28 years belonging to the descending phase, 43 years belonging to the phase maximum and 43 years belonging to the descending phase. During the same period, we recorded: 1227 magnetic cloud activities, an average of 8 magnetic cloud activities per year.

This result is in agreement Wu et al. (2003) who finds approximately nine (9) magnetic clouds per year. Figure 2 shows total number of any type of magnetic clouds recorded per solar phase. We note 450 and 134 magnetic cloud activities respectively at the solar maximum and at the solar minimum. This observation is in agreement with Wu et al. (2006) for whom, at the solar minimum, very few magnetic clouds are detected; on the other hand, they are much more numerous around the solar maximum. Indeed, according to Turc (2014), magnetic clouds are transient phenomena and at the solar minimum, many of them do not reach the vicinity of the Earth. This could explain their low number at the solar minimum.

Furthermore, Figure 2 shows that magnetic cloud activity days occurrence during solar phases ascending and descending is not the same (233 and 284 respectively in the ascending and descending solar phases). This observation shows that magnetic clouds activity does not follow the sunspot cycle. This result is in agreement with Wu et al. (2003) who find that the frequency of magnetic clouds occurrence does not follow the sunspot cycle or the frequency of CMEs occurrence.
Figure 3 shows the level of activity of magnetic clouds as a function of solar cycles. According to this figure, we note at solar maximum 122 and 51 magnetic cloud activities during cycles 20 and 14 respectively. This makes cycle 20 the cycle in which magnetic cloud activity was most active and cycle 14 the least active in terms of magnetic cloud activity. Analysis of the same figure (Figure 3) shows that the last eight solar cycles alone record 70.33% of the total magnetic clouds recorded since solar cycle 11. However, there is a continuous decrease in the level of magnetic cloud activity for the last five solar cycles (solar cycle 20 to cycle 24).

This result indicates that solar activity decreases during the last five (5) solar cycles. Indeed, according to Wu et al. (2003), geomagnetic activity intensity linked to magnetic clouds is well correlated with solar activity.
Figure 4 shows the percentage of occurrence of different types of magnetic cloud activity. This graph shows that the proportions of magnetic cloud activities whose effect lasts 1, 2 and 3 days are respectively 66, 23 and 11%. This result is explained by the fact that during our study period, the most intense magnetic clouds in terms of geoeffectivity are less dominant compared to those which are less intense.

Figures 5 to 7 represent the occurrences of the activities of the different types of magnetic clouds of 1, 2 and 3 days respectively. For each figure, the panels (a), (b), (c) and (d) corresponds to the occurrences of the types of magnetic cloud activity, respectively, solar minimum, ascending phase, solar maximum and descending phase. In Figure 5 we observe that solar cycle 23 is the cycle which recorded the greatest number of magnetic cloud ejections at solar minimum and during the ascending phase. During maximum phase, solar cycles 19 and 22 are the cycles that recorded the greatest number of magnetic cloud ejections. During descending phases, solar cycles 17 and 20 recorded the greatest number of magnetic cloud ejections. Whatever the phase of the solar cycle, there is a decrease in the number of magnetic cloud ejections for the last two solar cycles. We observe that at the minimum phase of solar cycle 14, no magnetic cloud whose effect lasts 1 day has been ejected. With 31 magnetic clouds ejected, this same cycle is the one during which less ejections of magnetic clouds with an effect lasting 1 day were recorded. On the contrary, solar cycle 23 is the cycle during which the greatest number of magnetic clouds of the same type has been recorded.
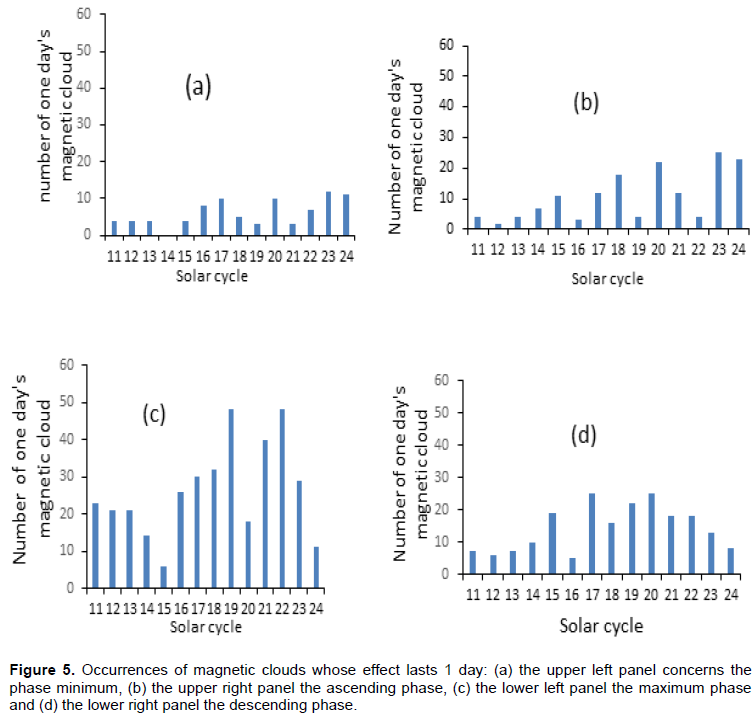
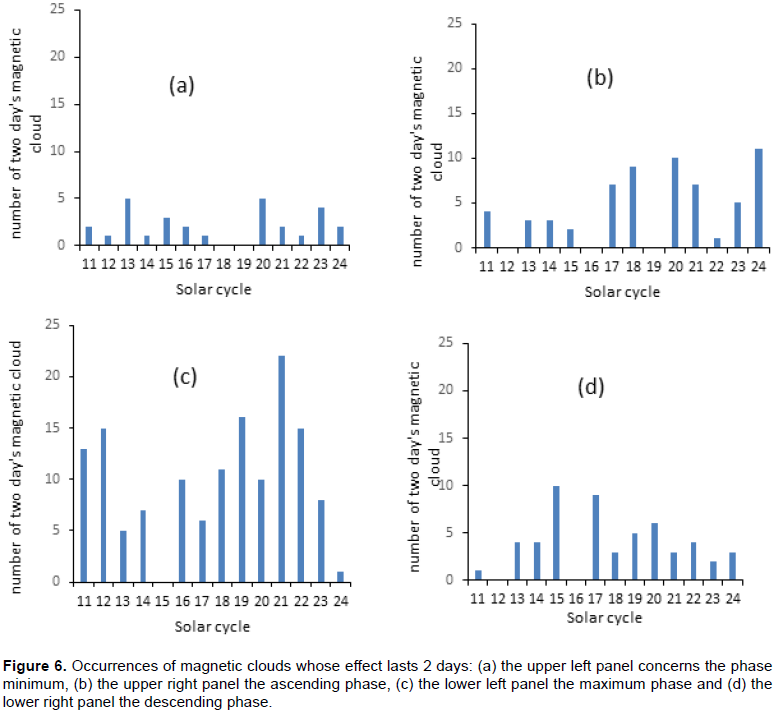
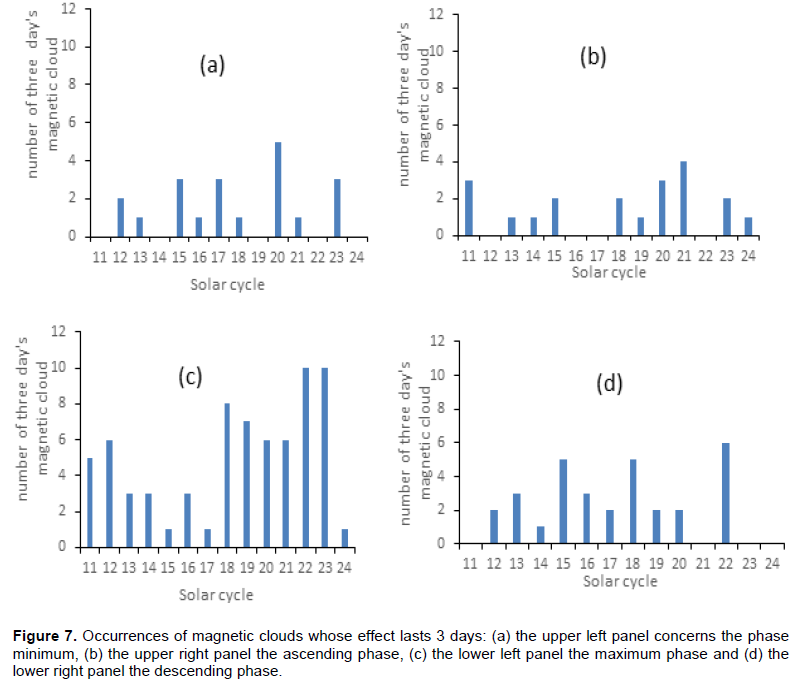
Figure 6 shows that from the phase minimum to the descending phase, the maximum number of magnetic clouds of duration 2 days ejected is respectively 5, 11, 22 and 10. During minimum solar phase, no magnetic cloud was ejected for cycles 18 and 19. The same observation is made: (a) for cycles 12, 16 and 19 during the ascending phase, (b) for cycle 15 during the phase maximum and (c) for cycles 12 and 16 during the descending phase. For any phase combined, cycle 21, with 34 magnetic clouds ejected, is the cycle during which the greatest number of magnetic clouds have been ejected. On the other hand, cycle 16 with 12 ejected magnetic clouds is the least prolific cycle in ejection of magnetic clouds, the effect of which lasts 2 days. From cycle 21 to cycle 24 we observe a continuous decrease in the ejections of magnetic clouds.
Figure 7 shows that the phase maximum is the only phase during which the number of magnetic clouds ejected is not zero and that is regardless of the solar cycle. Solar cycles 11 and 24 are cycles during which the number of magnetic clouds recorded at the minimum phase and at the descending phase are zero. During solar cycle 22, no magnetic cloud was ejected at minimum and ascending phases. No magnetic cloud with an effect lasting 3 days was ejected during: (a) cycles 11, 14, 19, 22 and 24 at minimum phase; (b) cycles 12, 16, 17 and 22 during the increasing phases; and (c) cycles 11, 21, 23 and 24 during the decreasing phases.
From solar cycle 11 to solar cycle 24, solar cycles 18, 20, 22 each with 16 ejected magnetic clouds are the cycles from which the greatest number of magnetic clouds has been ejected; while solar cycle 24 with 2 ejected magnetic clouds is the solar cycle which recorded the small number of ejected magnetic clouds. These two magnetic clouds were ejected during the ascending phase and during the phase maximum. For the other two phases, no magnetic cloud whose effect lasts three days was ejected.
CONCLUSION
We make a statistical study of magnetic clouds activity days’ occurrence taking into account the duration of their effects and the phases of solar cycles 11 to 24. This study statistical study is a contribution in the understanding of Sun-Earth relations. The results show that: (1) the frequency of magnetic cloud ejections depends on the type of magnetic clouds and the solar cycle phase. Different types of magnetic clouds do not have the same occurrences.
However, regardless of the type of magnetic clouds, the phase maximum is the phase of the solar cycle during which the most magnetic cloud ejections are recorded.
(2) Whatever the solar cycle, the number of magnetic clouds whose effect lasts 1 day is greater than that whose effect lasts 2 days, which in turn is greater than that whose effect lasts 3 days. (3) For all types of magnetic clouds, cycles 20, 21, 22 and 23 were the four most active cycles in magnetic cloud ejections. Thus, Cycles 14, 12, 13 and 16 are the least active cycles in magnetic cloud ejections for the last fourteen solar cycles studied.
CONFLICT OF INTERESTS
The authors have not declared any conflict of interests
ACKNOWLEDGMENTS
The authors thank ISGI and OMNIWEB for making the data used in this article available.
REFERENCES
|
Burlaga LF, Sittler E, Mariani F, Schwenn R (1981). Magnetic loop behind an interplanetary shock: Voyager, Helios, and Imp 8 observations. Journal of Geophysical Research: Space Physics 86(A8):6673-6684. |
|
|
Cane HV, Richardson IG, Wibberenz G (1997). Helios 1 and 2 observations of particle decreases, ejecta, and magnetic clouds. Journal of Geophysical Research 102(A4):7075-7086. |
|
|
Echer E, Alves MV, Gonzalez WD (2005). A statistical study of magnetic cloud parameters and geoeffectiveness. Journal of Atmospheric and Solar-Terrestrial Physics 67(10):839-852. |
|
|
Echer E, Gonzalez WD, Surutani BT, Gonzalez ALC (2008b), Interplanetary conditions causing intense geomagnetic storms (Dst <= -100 nT) during solar cycle 23 (1996-2006). Journal of Geophysical Research Atmospheres 113(A05). |
|
|
Echer E, Gonzalez WD, Tsurutani BT (2008a), Interplanetary conditions leading to super-intense geomagnetic storms (Dst <= -250 nT) during solar cycle 23. Geophysical Research Letters 35, L06S03, |
|
|
Gosling JT (1990). Coronal mass ejections and magnetic flux ropes in interplanetary space. Physics of Magnetic Flux Ropes 58:343-364. |
|
|
Guibula K, Ouattara F, Gnabahou DA (2018). foF2 Seasonal Asymmetry Time Variation at Korhogo Station from 1992 to 2002. International Journal of Geosciences 9(4):207-213. |
|
|
Legrand JP, Simon PA (1989). Solar cycle and geomagnetic activity: A review for geophysicists. Part I. The contributions to geomagnetic activity of shock waves and of the solar wind. Annales Geophysicae, Atmospheres, Hydrospheres and Space Sciences 7(6):565- 578. |
|
|
Ouattara F, Amory-Mazaudier C (2009). Solar-geomagnetic activity and Aa indices toward a standard classification. Journal of Atmospheric and Solar-Terrestrial Physics 71(17):1736-1748. |
|
|
Ouattara F (2009). Contribution à l'étude des relations entre les deux composantes du champ magnétique solaire et l'ionosphère équatoriale. Thèse de Doctorat d'Etat présentée à l'Université Cheikh Anta Diop de Dakar 368 p. |
|
|
Ouattara F, Kaboré S, Gyébré AMF, Zerbo JL (2015), CMEs' shock occurrences from solar cycle 11 to solar cycle 23. European Journal of Scientific Research 130(01):153-159. |
|
|
Nanéma E, Ouattara F (2013). hmF2 Quiet Time Variations at Ouagadougou and Comparison with IRI- 2012 and TIEGCM Predictions during Solar Minimum and Maximum. Scholars Research Library 5(5):55-61. |
|
|
Sandwidi SA, Gnabahou DA, Ouattara F (2020). Comparative Study of the Geomagnetic Activity Effect on foF2 Variation as defined by the Two Classification Methods at Dakar Station over Solar Cycle Phases. International Journal of Geosciences 11(08):501-517. |
|
|
Simon PA, Legrand JP (1989). Solar cycle and geomagnetic activity: A review for geophysicists Part II. The solar sources of geomagnetic activity and their links with sunspot cycle activity. Annales Geophysicae 7(6):579-594. |
|
|
Turc L (2014). Interaction des nuages magnétiques éjectés par le Soleil avec l'environnement terrestre. Thèse de doctorat de l'école Polytechnique de l'Université Paris-Saclay 261 p. |
|
|
Wu CC, Lepping RP, Gopalswamy N (2003). Variations of magnetic clouds and CMEs with solar activity cycle, In: Wilson, A. (ed.) Proc. International Solar Cycle Studies Symposium, Solar Variability as an Input to the Earth's Environment, ESA SP-535, 429 p. |
|
|
Wu CC, Lepping RP, Gopalswamy N (2006). Relationships among magnetic clouds, CMEs and geomagnetic storms. Solar Physics 239(1):449-260. |
|
|
Zerbo JL, Amory-Mazaudier C, Ouattara F, Richardson JD (2012). Solar wind and geomagnetic: toward a standard classification of geomagnetic activity from 1868 to 2009. Annales Geophysicae 30(2):421-426. |
|
|
Zerbo JL, Ouattara F, Zoundi C, Gyébré A (2011). Cycle solaire 23 et activité géomagnétique depuis 1868. Rev. CAMES-Série A, Science et Médecine 12(2):255-262. |
|
|
Zhang J, Liemohn MW, Kozyra JU, Lynch BJ, Zurbuchen TH (2004). A statistical study of the geoeffectiveness of magnetic clouds during high solar activity years. Journal of Geophysical Research: Space Physics 109(A9). |
|
Copyright © 2024 Author(s) retain the copyright of this article.
This article is published under the terms of the Creative Commons Attribution License 4.0


