ABSTRACT
This research investigates groundwater potential of Ibodi and its environs using satellite imagery remotely sensed and aeromagnetic dataset. This hydrogeological investigation involved the extraction of lineaments from Landsat Thematic Mapper (TM) satellite imagery and aeromagnetic lineament of the area. The processed image revealed lineaments trending in approximately NE-SW direction; also, Landsat and aeromagnetic lineament trends tend to agree in the study area, suggesting real continuous fractures at depth. Hydrogeological maps, based on lineament and lineament intersection were produced from the generalized lineament trends in the area. The lineament intersection density map identified cluster zones in the range of 0 to 1.17, 1.17 to 2.34, 2.34 to 3.52, 3.52 to 4.69 and 4.69 to 5.86 kg/kg2, respectively. The map showed that the concentrations of lineament intersection nodes dominate the eastern and north-eastern parts of the study area while other areas are characterized by scanty or no lineament intersections nodes. The lineament analysis has been effectively done in a geographic information system (GIS) environment. Results from the vertical electrical sounding (VES) data reveals that the areas where the lineament intersected has tendency of very high groundwater prospect which reflects that the area will be good for groundwater development. The study thus displays that the remote sensing and aeromagnetic technique is capable of extracting lineament trends in an inaccessible tropical forest and has led to the delineation of areas where groundwater occurrences are most promising for sustainable supply.
Key words: Geology, landsat lineaments, aeromagnetic lineaments, lineament intersections, geographic information system (GIS).
Groundwater is one of the most valuable natural resources on the earth surface and serves as main sources of drinking water. Basement complex have problem of potable groundwater supply due to the crystalline nature of the underlying rock which lack primary porosity (Olorunfemi and Fasuyi, 1993). Groundwater storage capacity in those areas depends on the depth of weathering and the intensity of fracturing of the underlying rock. For basement rocks to become good aquifers, they must be highly fractured and highly weathered. Thickness of the weathered overburden and fractured zone determined the nature and intensity of hydrodynamic activities within the usually discrete bodies of aquifer in the terrain (Amudu et al., 2008; Amadi and Olasehinde, 2010). Groundwater in crystalline rocks that have no intergranular porosity moves in a connected fracture network; but far from all fractures are permeable, and fracture permeability varies considerably (Banks et al., 1996).
It is generally recognized that, in the prospect area of faults and fracture lineaments, the fault core and central zone have low permeability while the outer damage zone has enhanced permeability compared with the surroundings (Caine et al., 1996; Evans et al., 1997; Henriksen and Braathen, 2006). Lineament mapping was used long before this work in other geological applications and the first usage of the term lineament in geology is probably from a paper by Hobbs (1904, 1912), who defined lineaments as significant lines of landscape caused by joints and faults, revealing the architecture of the rock basement. This was later used by O’Leary et al. (1976) as a basis for developed definitions. Lineament is a mappable linear or curvilinear feature of a surface whose parts align in a straight or slightly curving relationship (Hung et al., 2005).
They may be an expression of a fault, joints or other line weakness. These features are mappable at various scales, from local to regional, and can be utilized in mineral, hydrocarbons, and groundwater explorations. This interest has grown most rapidly in geological studies since the introduction of aerial photographs and satellite images. Generally, lineaments are underlain by zones of localized weathering and increased permeability and porosity. Meanwhile, some researchers studied relationships between groundwater productivity and the number of lineaments within specifically designated areas or lineament density rather than the lineament itself (Hardcastle, 1995). This research focuses on intersecting landsat lineament and aeromagnetic lineament for regional groundwater prospect evaluation. Lineament intersections represent nodal point for two or more lineament lines (Bayowa et al., 2014). The nodes of intersections are the point of interest which indicate site for appreciable groundwater accumulation.
Study location and geology
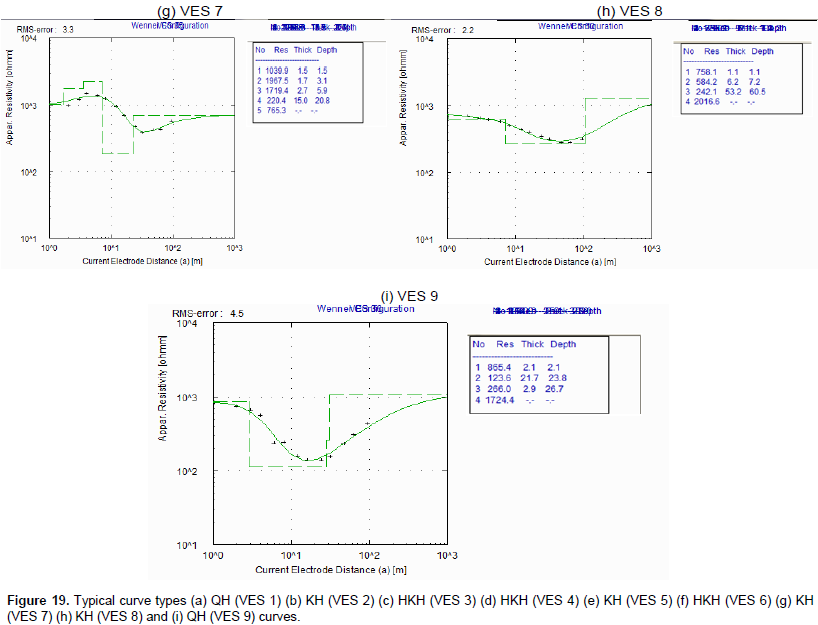
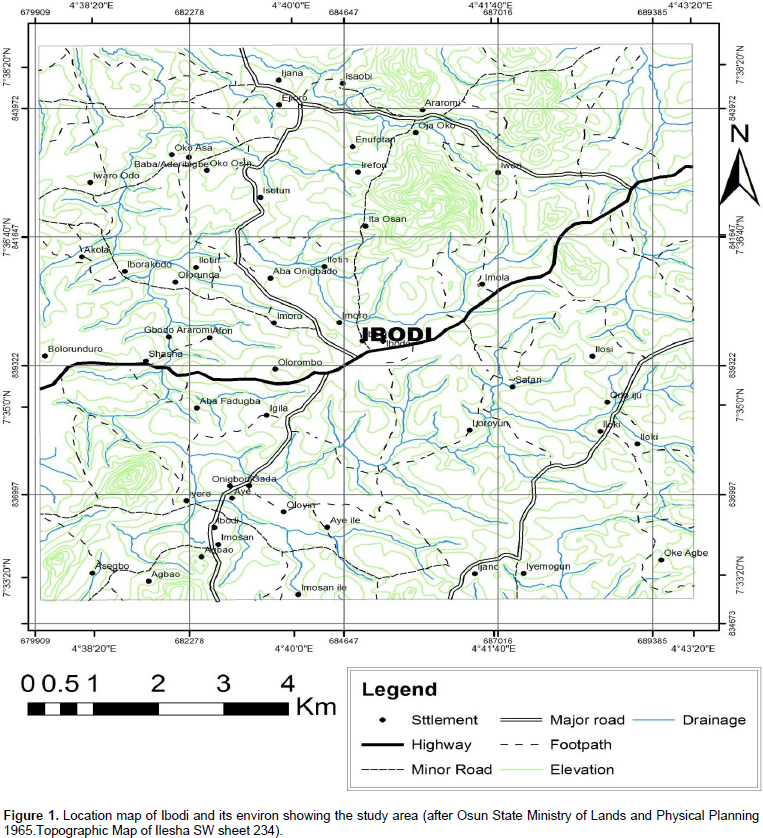
Ibodi and its environs comprises sixty-eight villages which are located on the crystalline basement complex and falls within latitude 7° 32′ 20″ to 7° 38′ 20″ North and longitude 4° 36′ 20″ to 4° 44′ 20″ East (Figure 1). This area falls within the 1:50,000 topographic map of Ilesa sheet 234 SW. Major and minor road linkages characterize the study area linking both towns and villages together. In general, the location can be said to be fairly accessible with footpaths in areas where there are neither major nor minor roads. Regionally, the study area belong to the Southwestern Nigeria basement complex comprising migmatite-gneiss complex, metaigneous rock such as pelitic schist, quartzite, amphibolites, charnokitic rocks, older granite and unmetamorphorsed dolerite dykes. The rock sequence consists of basically weathered quartzite of older granite. The basement complex rocks of Nigeria are made up of heterogeneous assemblages (Rahaman, 1976). The geology of Ibodi and its environs is mainly Precambrian Basement rock (Figure 2) because of the tectonics and metamorphic changes that has occurred in the area (Olade, 1978). Schist and amphibolites, magnetite - gneiss undifferentiated and amphibolites stands out in the Basement rock of the investigated area.


The work utilized remote sensing, aeromagnetic and electrical resistivity data in the assessment of groundwater prospect around Ibodi, Osun State. The remote sensing data (Landsat imagery) were acquired from the Global Land Cover Facility homepage and the automatic lineament extraction process was carried out using “ENVI” 4.5, “Geomatical’’ pcl and “ArcGIS’’ 10.2 software which was used for digital image processing and lineament extraction from the satellite imageries. The aeromagnetic data was acquired from Nigerian Geological Survey Agency and the data set gridded using minimum curvature gridding method with 50 m cell size to produce total magnetic intensity map. Data enhancement techniques involving Butterworth filter, reduction to equator and derivative filters were applied to the magnetic intensity map using Oasis Montaj 6.4.2 software package (Montaj TM Tutorial, 2004). 3D Euler deconvolution data assisted in determining the locations and depths of the geologic sources. Structural index of 1.0 was found appropriate for delineation of structures that are favourable for groundwater accumulation. Lineaments were generated by georeferencing and digitizing 3D Euler deconvolution results.
A total of nine Vertical Electrical Sounding involving Schlumberger arrays were used to acquire depth sounding data in the investigated area with the apparent resistivity values obtained from the area plotted on bi-log graph against the current electrode separation spacing. The initial quantitative interpretations were made using partial curve matching technique in which the field curves produced or generated were matched segment by segment with the appropriate master curves and auxiliary curves. The resistivities and thicknesses of the various layers were improved upon by employing an automatic iterative computer program following the main ideas of Zohdy and Martin (1993). The WINRESIST computer software was employed for carrying out the iteration and inversion processes. Intersection of landsat lineament and aeromagnetic lineament density were used to determine the groundwater prospect of the area. A total of nine (9) vertical electrical sounding obtained within the study area were used to validate lineament intersections in order to ascertain the significances in term of groundwater prospect.
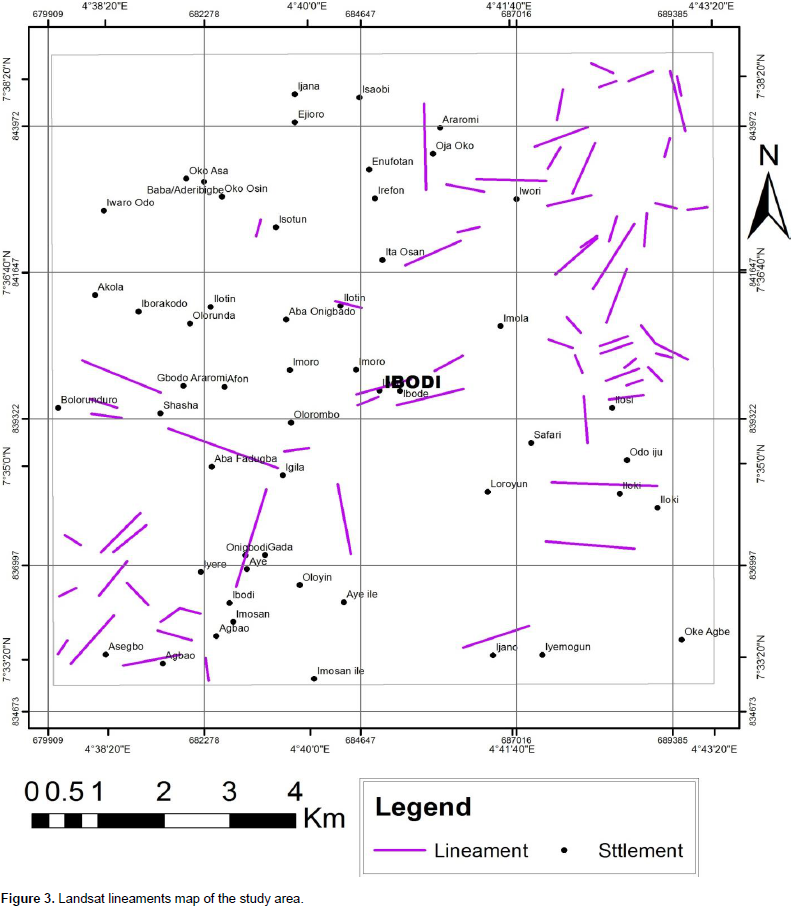
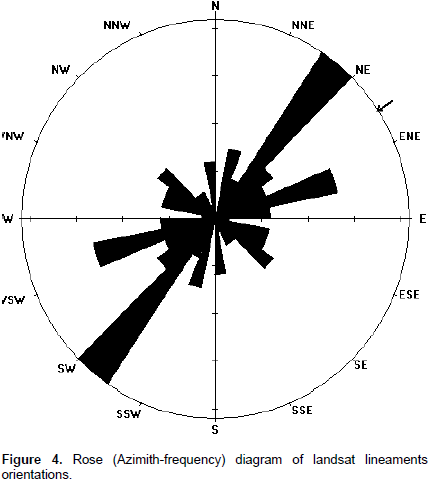
Results obtained from the satellite image interpretation (Figure 3) are discussed to demonstrate the usefulness of remote sensing in lineament mapping and analysis, that is, to delineate zones that are prone to groundwater development in the study area. The map shows that the northeastern region is characterized by very high concentration of lineaments, whereas the central parts of the study area are characterized by moderately concentration of lineaments while the northwestern and the southeastern parts have low to very low concentration of lineaments. The rose (azimuth-frequency) diagram of the lineaments (Figure 4) was prepared from the extracted lineaments on the imagery which showed that there are three predominant sets of lineament which are closely related to tectonic activities such as fractures, faults and joints in the study area. The lineaments trends in the NE-SW, ENE-WSW and NW-SE directions.
Landsat lineament on topographical and geological map
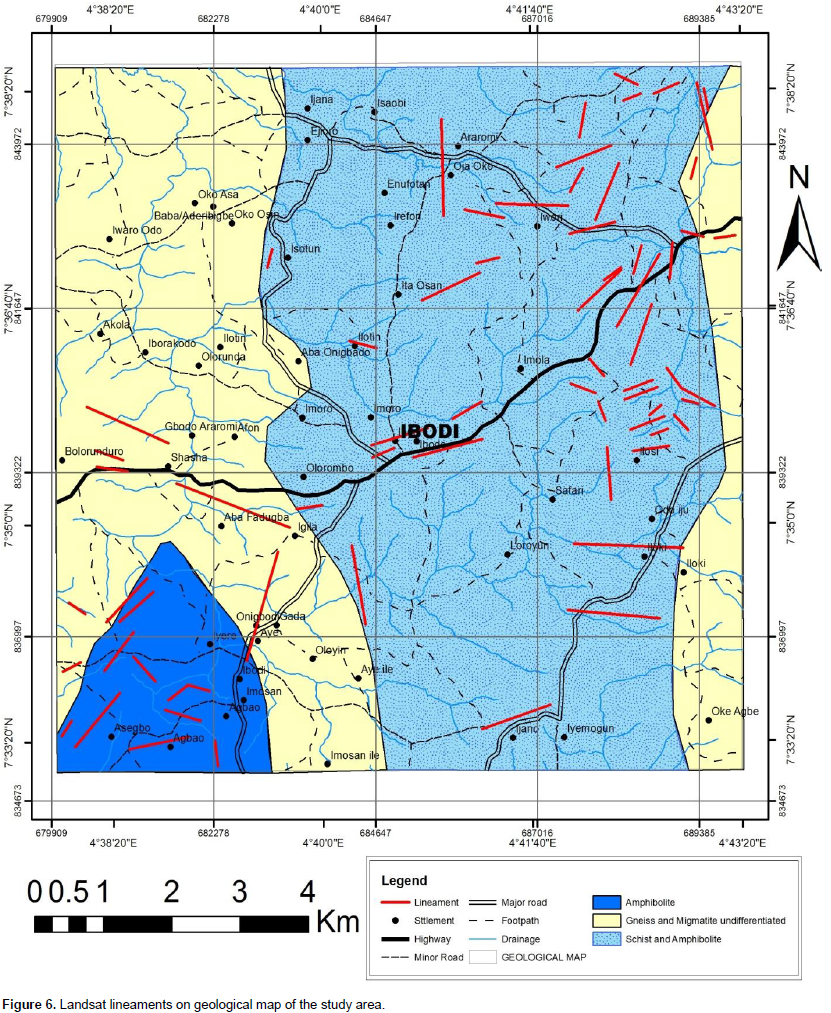
Figures 5 and 6 show land sat lineament on topographical and geological maps. Figure 5 shows that the northeastern parts, majority of the lineaments fall within the high hill with elevation between 380 m to 420 m and also at the southwestern part. Areas with high lineament density excluding (the residual hill environment) are good for groundwater development. Figure 6 show that there are more concentrations of lineaments on schist and amphibolites at the northeastern parts followed by amphibolites at the southwestern part while there exist scanty or low concentration of lineaments on gneiss and migmatite undifferentiated. This implies that there are more fracturing on schist and amphibolites, followed by amphibolites and gneisss and migmatite undifferentiated. Regarding groundwater exploration, these aforementioned areas may have high groundwater potentials due to their high concentration of lineaments, that is, since groundwater occurs within faults and fractures in the basement rock.
.png)
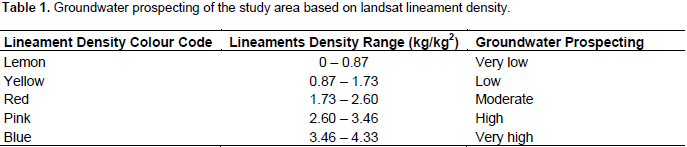
Landsat lineament density map
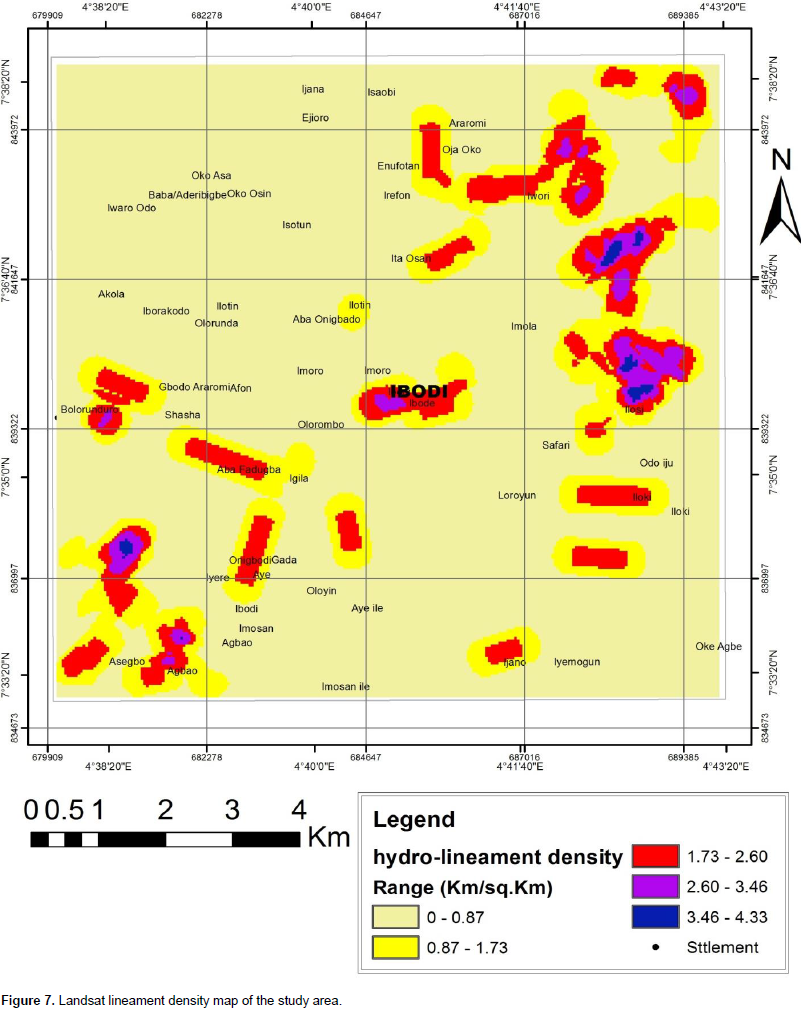
The lineament density of Ibodi and its environ was computed based on the number of lineaments per unit area (kg/kg2) of grid, for quick graphical assessment of the lineament density values of the area. Areas with high lineament density excluding (the residual hill environment) are good for groundwater development. Figure 7 shows five different hydrogeological potential zones distributed as patches in the study area. The zones are summarized in Table 1.The lineament density map shows that the lineament density is high around areas like Ibodi, Iloki, Iwori, Ijano, Ilotin, Aye, Igila, Agbao, Araromi and Oja Oko when compared to other areas in the study area.
Aeromagnetic data
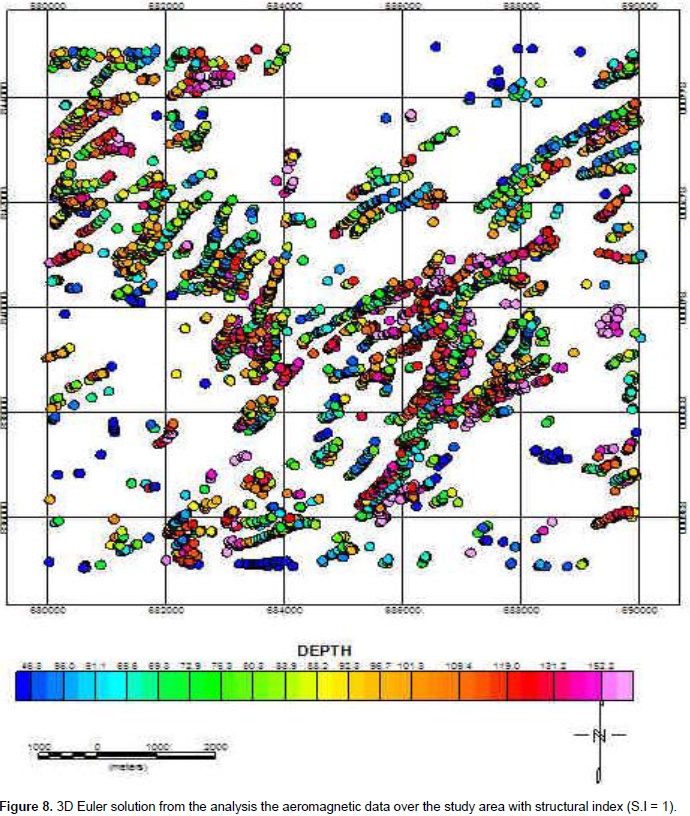
Lineament analysis using 3D Euler deconvolution
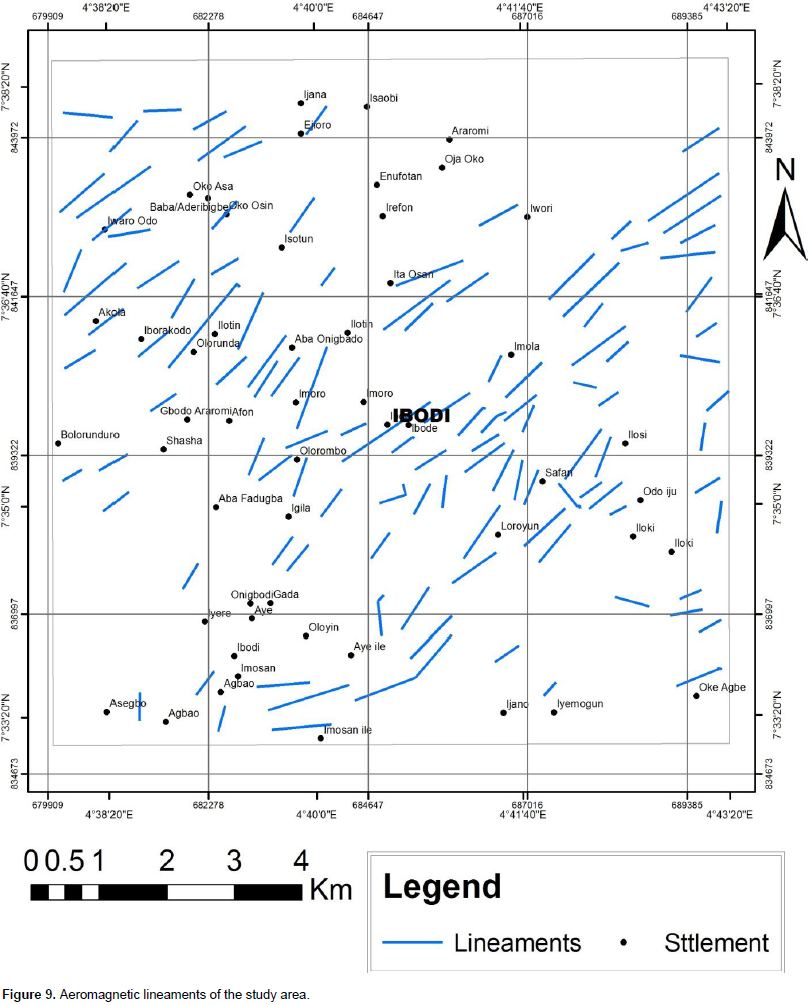
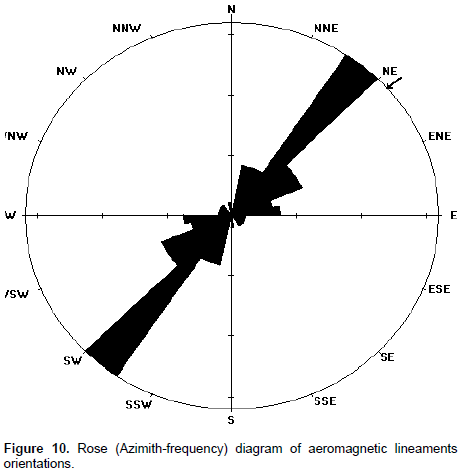
3D Euler solution using structural index (S.I = 1) was applied to the aeromagnetic data for lineament analysis (Figure 8). The delineated solutions were extracted and digitized to produce the lineaments from magnetic data (Figure 9). The rose (azimuth-frequency) diagram of the lineaments (Figure 10) was prepared from the extracted lineaments on the aeromagnetic structures which shows that there are two predominant sets of lineament which are closely related to tectonic activities such as fractures, faults and joints in the study area. The lineaments trends NE-SW and ENE-WSW directions. Here it indicates more fracturing towards the NE direction suggesting comparatively more potential groundwater zone and hence better prospect for groundwater availability.
Aeromagnetic lineaments on topographical and geological map
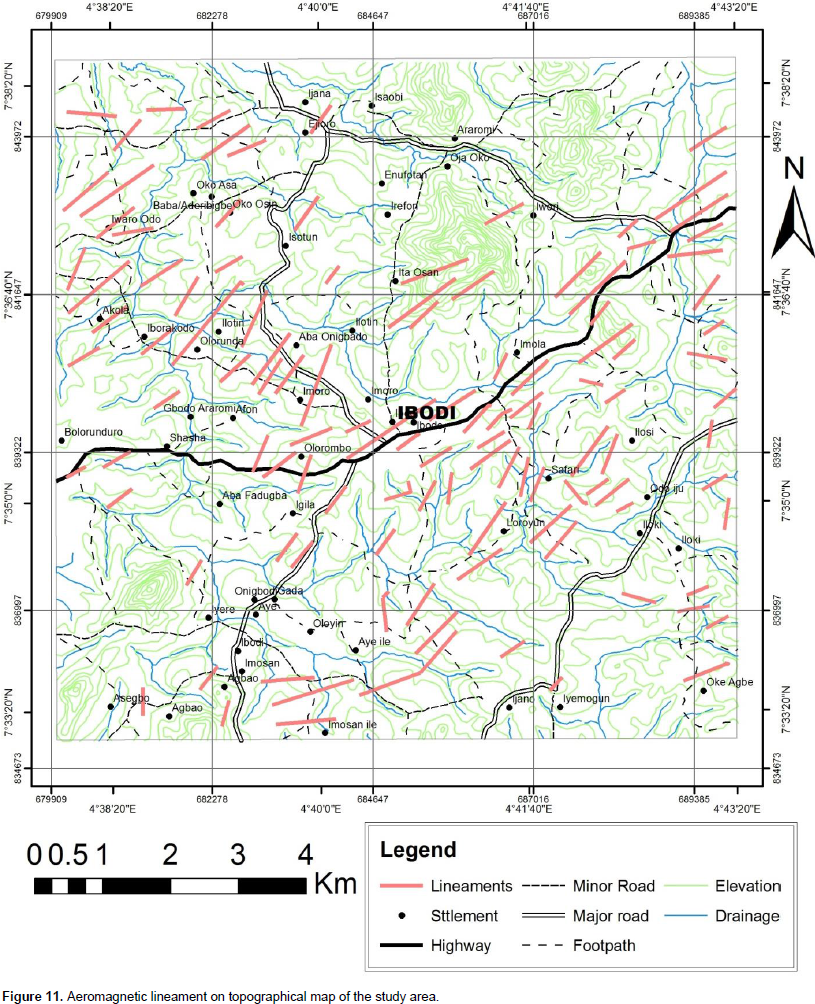
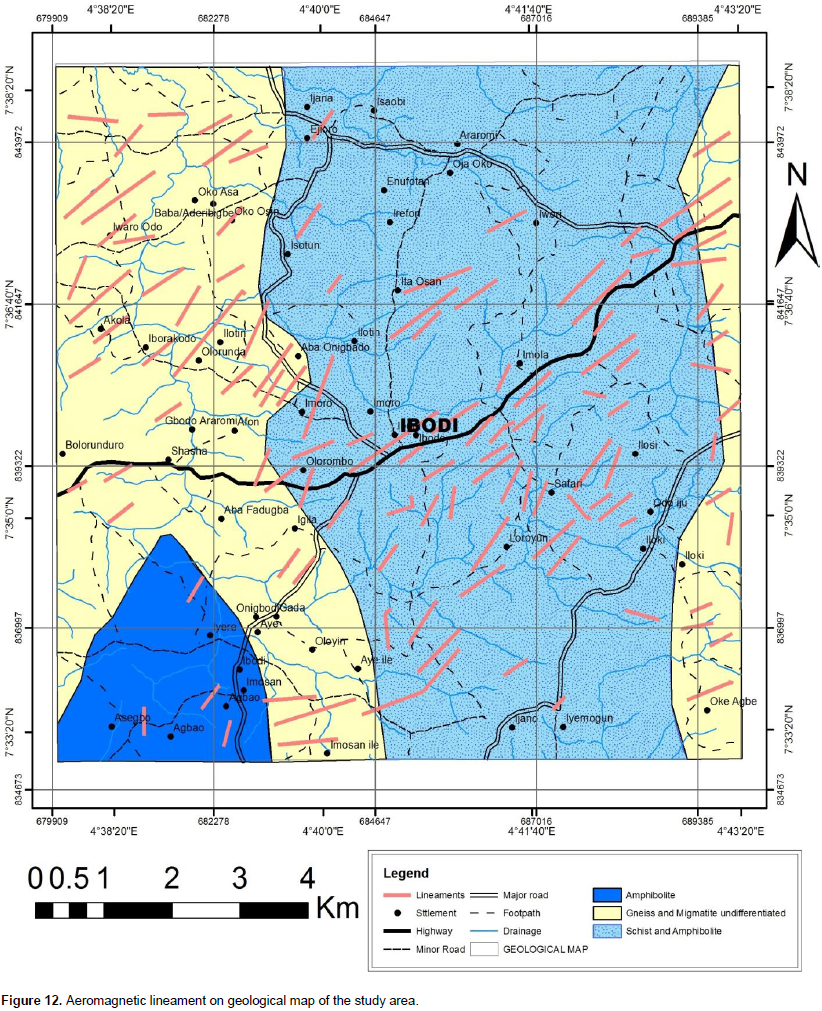
Figures 11 and 12 displays aeromagnetic lineament on topographical and geological map. Figure 11 reveals that the majority of the lineaments fall within the plain land unlike surface lineaments (Landsat Lineament) which fall within the high hill. This implies that we cannot base our presumption on surface lineament without ascertaining it with subsurface lineaments in order to have clearer pictures of the groundwater prospect within the study area. Figure 12 shows that there are more concentration of lineaments on schist and amphibolites at the southeastern parts which go along with the landsat lineaments on geological map followed by gneiss and migmatite undifferentiated at the northwestern parts, while showing scanty or low concentration of lineaments on amphibolite. This implies that, there are more fracturing on schist and amphibolites. Regarding groundwater exploration, these aforementioned areas may have high groundwater potentials due to their high concentration of lineaments, that is, since groundwater occurs within faults and fractures in the basement rocks.
Aeromagnetic lineament density map
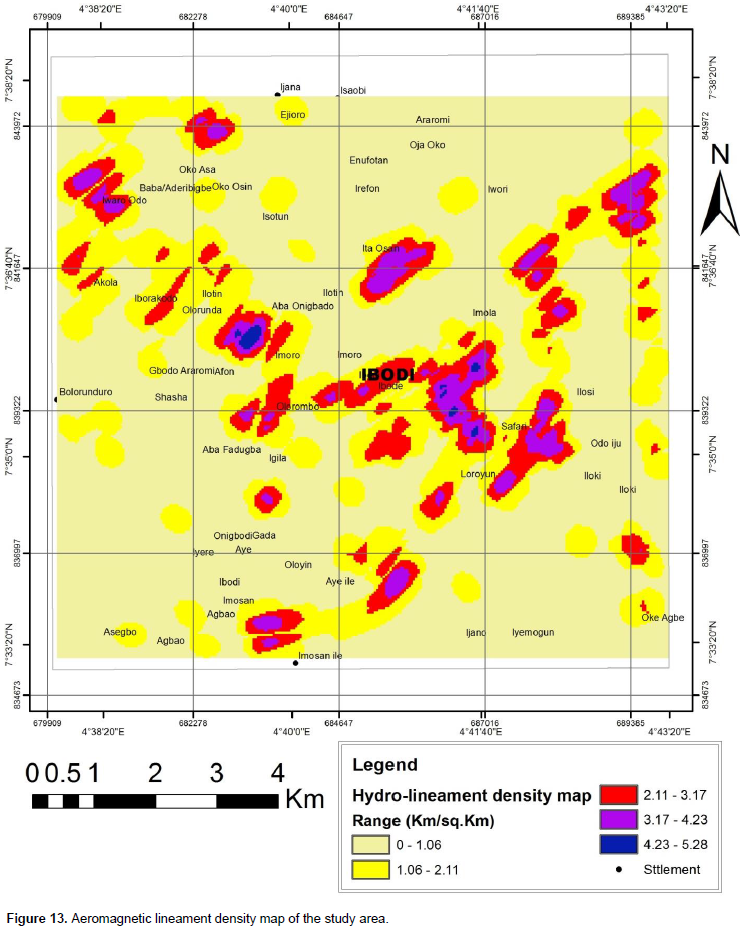
Lineament density map is one of the important maps prepared from the lineaments, which are critically used in groundwater studies related to hard rock terrain, Figure 13 displays the aeromagnetic lineament density map of the study area. The map reveals five different hydrogeological potential zones distributed as patches in the study area. The zones are summarized in Table 2. The lineament density map reflects that the lineament density is high around areas like Ibodi, Iworo Odo and Sefari, when compared to other areas in the study area. Regarding groundwater exploration, these aforementioned areas may have high groundwater potentials due to their high concentration of lineaments, that is, since groundwater occurs within faults and fractures in the basement rocks.
Intersection of lineaments
Intersection of aeromagnetic and landsat lineaments
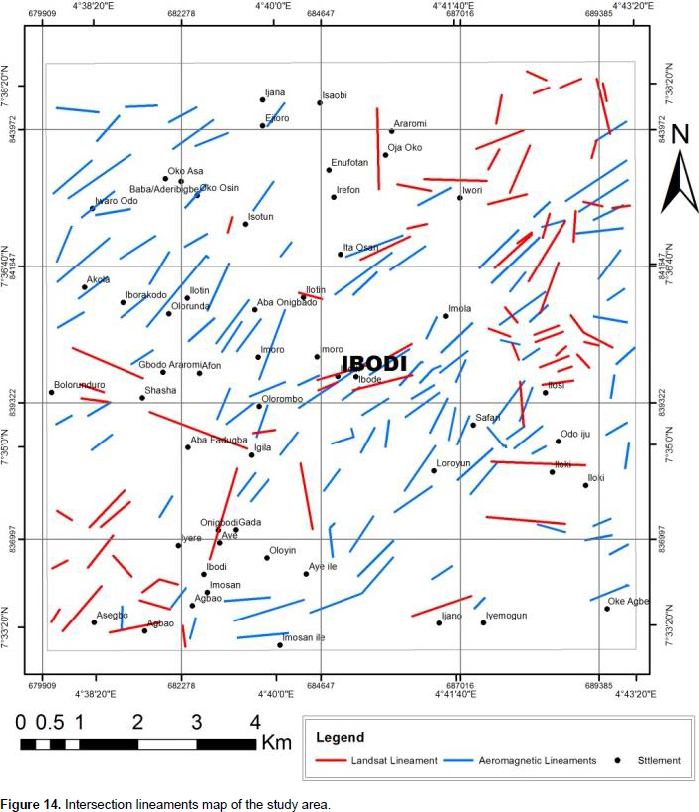
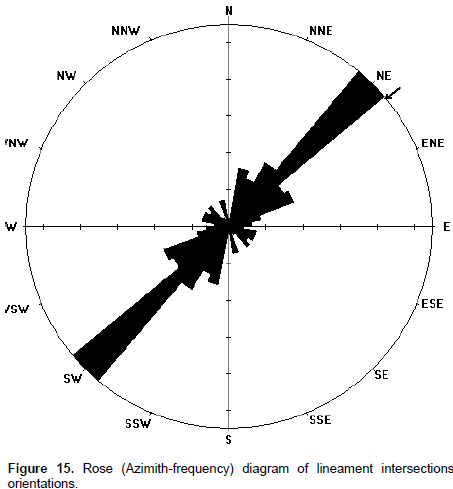
Figure 14 indicates the lineament intersection map between aeromagnetic lineaments and landsat lineaments of the study area. Lineament intersections are potential site for appreciable groundwater accumulation. Lineament intersections represent nodal point for two or more lineament lines. It is obvious from the map that the lineament intersection nodes concentrated within northeastern parts of the study area while other areas are characterized by scanty or no lineaments intersection nodes. The rose (Azimuth-frequency) diagram of the lineaments intersection (Figure 15) was prepared from the extracted lineaments between aeromagnetic and landsat lineaments, which reveals that the lineaments trends mainly NE-SW directions. Here it indicates more fracturing towards the NE direction, suggesting comparatively more potential groundwater zone and hence better prospect for groundwater availability.
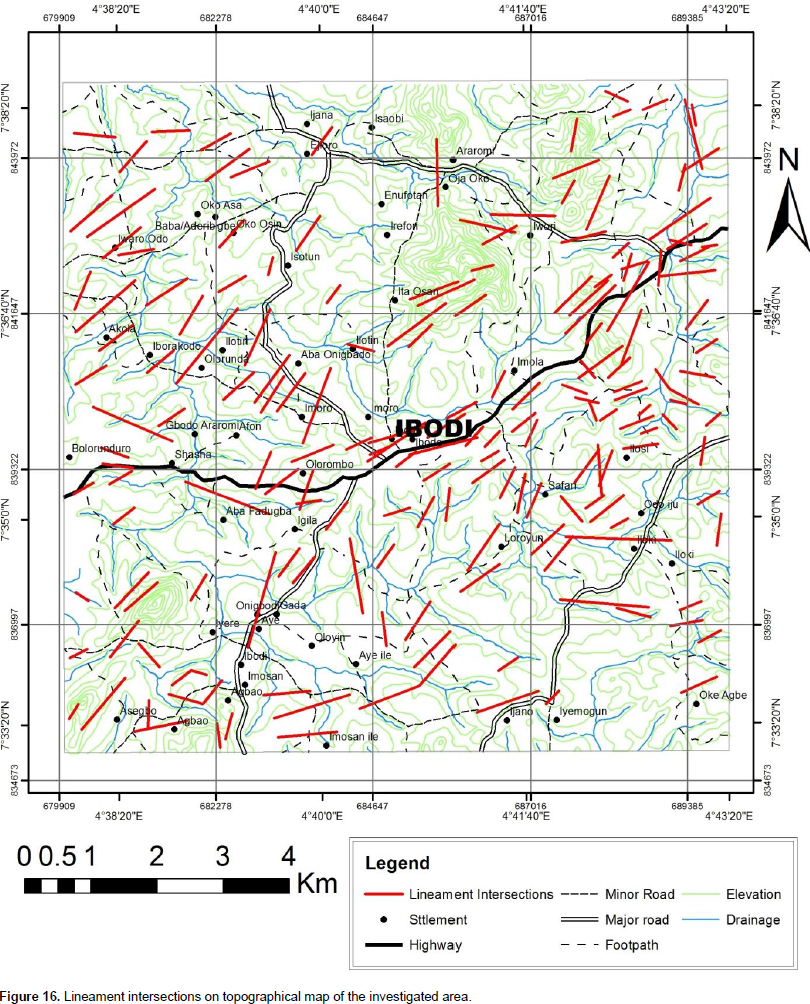
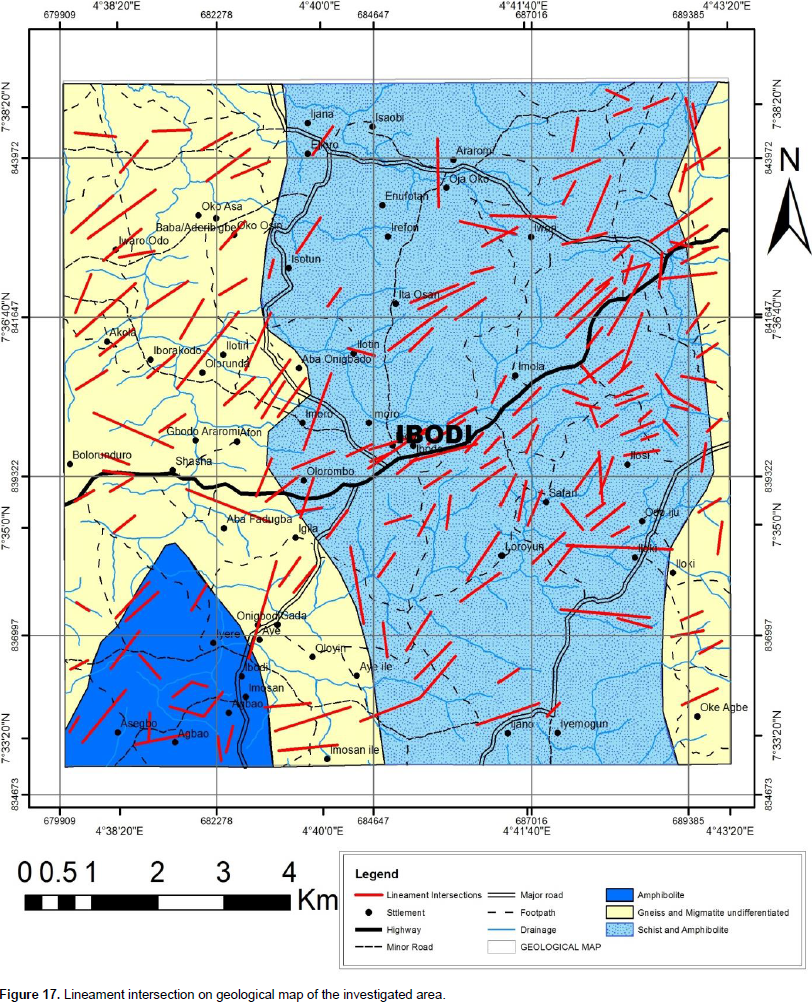
Lineaments intersection on topographical and geological map
Figures 16 and 17 display lineament intersection on topographical and geological map. Figure 16 indicates that the lineament intersection nodes concentrated within northeastern part of the study area fall within the plain land while other areas are characterized by scanty or no lineaments intersection nodes. This implies that we cannot base our presumption on surface lineament without ascertain it with subsurface lineaments in order to have clearer pictures of the groundwater prospect within the study area. Figure 17 shows that there are more lineaments intersection on schist and amphibolites at the northeastern parts followed by gneiss and migmatite undifferentiated while having scanty or low lineaments intersection on amphibolite. This implies that there are more areas with high lineament intersections which are good for groundwater development on schist and amphibolites and gniess and migmatite undifferentiated while having low lineament intersection on amphibolites, which implies low groundwater development. Regarding groundwater exploration, these aforementioned areas may have high groundwater potentials due to their high concentration of lineament intersections, that is, since groundwater occurs within faults and fractures in the basement rocks.
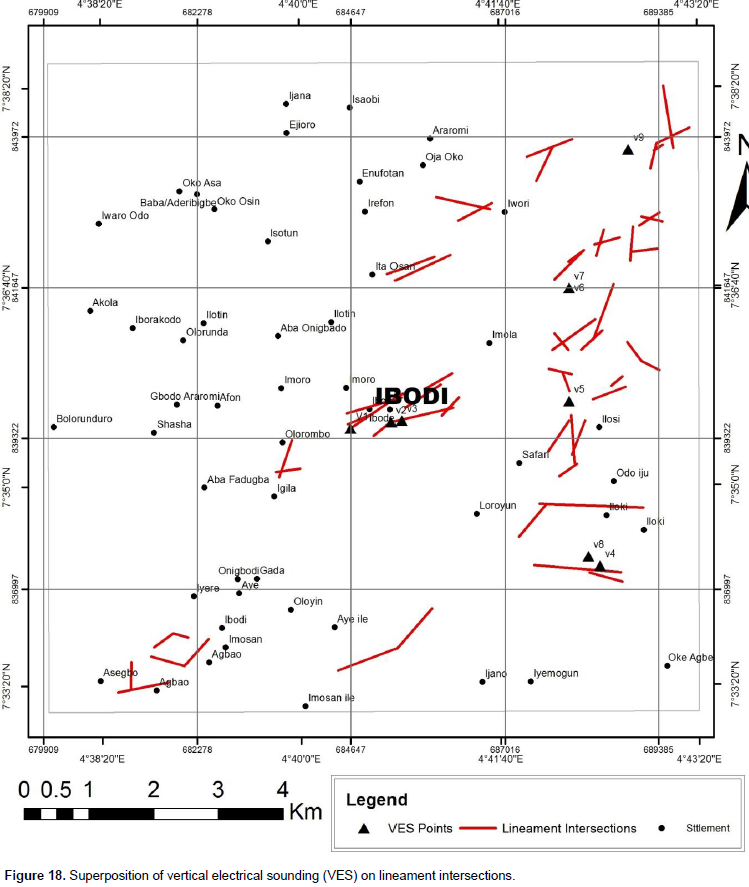
Superposition of vertical electrical sounding (VES) on lineament intersections
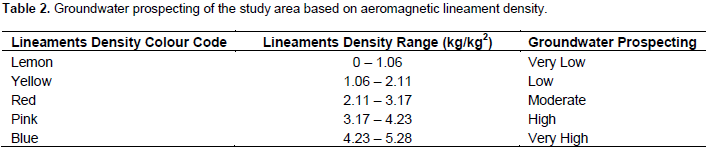
Figure 18 indicates the superposition of vertical electrical sounding (VES) on lineament intersections. Nine VES data were obtained within the investigated area. Figure 19(a to i) shows typical iterated VES data curves and the estimated geoelectric parameters. Four (4) curve types were identified, viz; H, QH, KH and HKH, where curve type KH has the highest occurrences. The curve types were ground on the basis of the aquifer types. The curve types were ground into three, viz: H and QH, HKH and KH. Aquifer in this group corresponds to layer 2 in H and layer 3 in QH curve types. The aquifer is that of weathered/ partially weathered layer. The groundwater yield of this type of aquifer is determined by the percentage of clay content. Low groundwater yield is encountered when the aquifer unit is clay. Aquifer in HKH corresponds to the weathered/fractured aquifer (confined). The fractured zone is concealed beneath a fresh basement rock, in which there is no hydraulic communication between the water contains in the weathered layer and the fractured zone, at least within the immediate finite of the abstraction point.
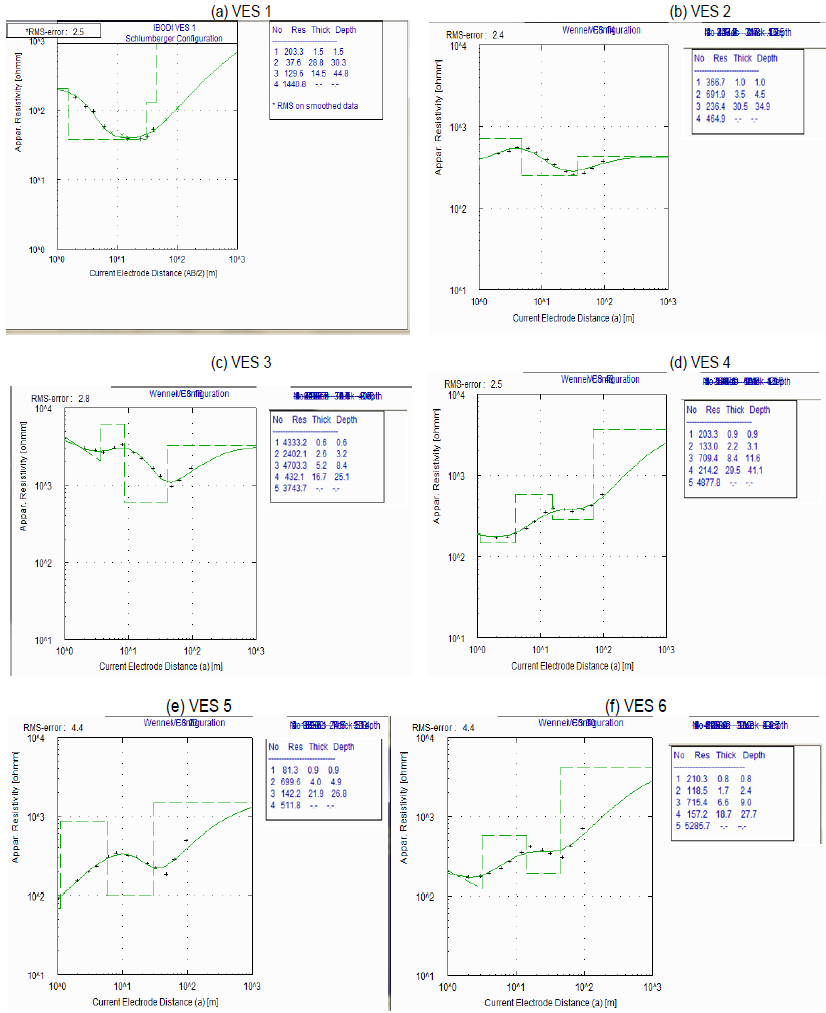


Aquifer in KH corresponds to the weathered/fractured (unconfined)/fractured (confined) aquifer. This aquifer types produces very high groundwater yield particularly when the density of the fractures is high. However, area underlain by the weathered/fractured basement aquifer is more promising in terms of groundwater development than the weathered layer aquifer and also the points of intersection in lineament intersections are the point of interest for groundwater development. The VES interpretation results Figure 19a to i of the study area show a total of three to five subsurface layers namely: the topsoil, weathered layer, weathered/fractured basement and fresh basement. The first layer which is the topsoil has resistivity varying from 81 to 4333 Ωm and thickness ranging from 0.6 to 2.1 m. This layer is relatively thin and with high resistivity. The resistivity of the second layer which is the weathered zone varies from 38 to 700 Ωm while its thickness varies from 1.7 to 28.8 m. The third layer constitutes the weathered/fractured basement which is also being referred to as aquifer layer, and are interpreted as saturated of their relative lower resistivity ranging from 130 to 432 Ωm. The thickness ranges from 2.9 to 52.2 m while the fourth layer is the fresh basement with resistivity values ranging from 455 to 5286 Ωm. The result from the VES data reflects that the areas where the lineament intersected has tendency of very high groundwater prospect. This illustrates that the area will be good for groundwater development.
Lineament intersection density map
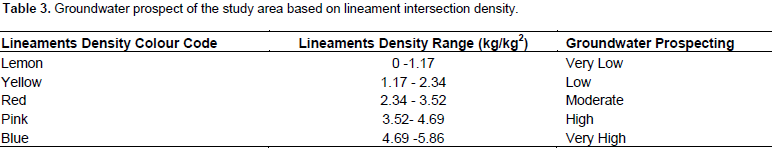
Figure 20 exhibit the lineament intersection density map of the study area. Lineament intersection density map is a measure of cluster of linear features in a particular area. The peaks in the lineament intersection density contour maps are believed to be potential zones for groundwater resource development. Areas with high lineament intersection density (excluding the residual hill environment) are good for groundwater development (Bayowa et al., 2014). The map revealed five different hydrogeological potential zones distributed as patches in the investigated area. The zones are summarized in Table 3.
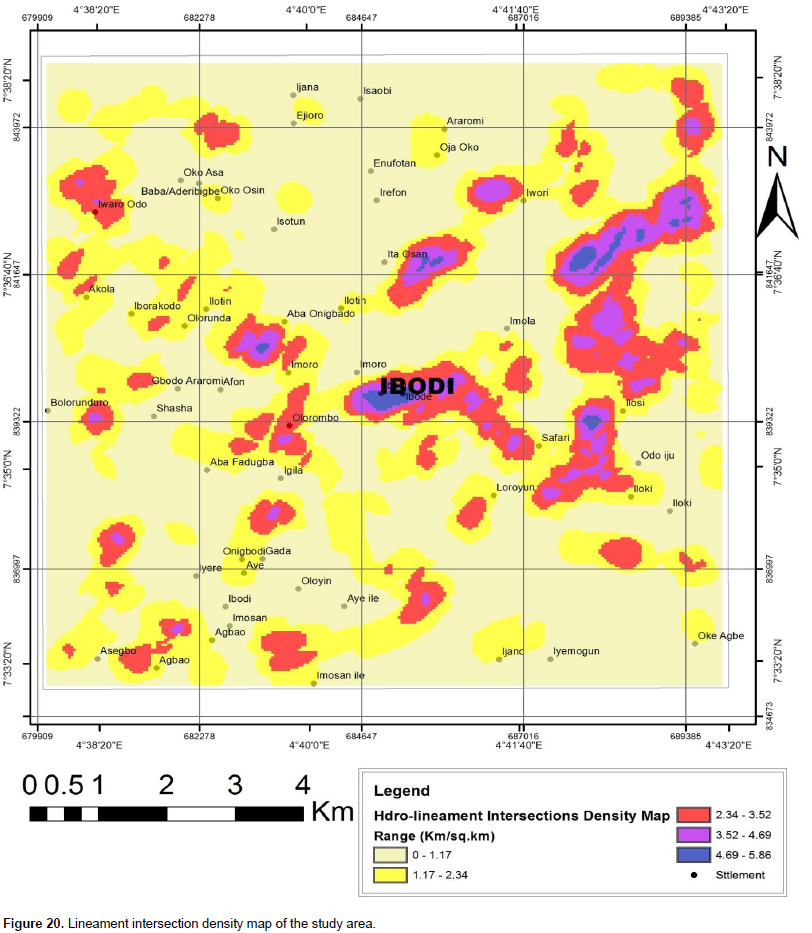
Considering the groundwater potential classification, it is clear from the lineament intersections density map that area within Ibodi that constitute the central parts of the study area display tendencies for very high groundwater potential. The area appeared on very high lineament intersection zones (areas within Olorombo and Iwaro Odo reflect medium groundwater potential tendencies); on medium lineament intersection zones (areas within Agbao, Oke Agbe, Aye, Onigbodi, Iloki, Sefari, Iwori, Oja Oko, Araromi, Oko Osin, Ilotin, Olorunda and Iborakodo indicate low groundwater potential); and on low lineament intersection zones (areas within Odo Iju, Iyere, Iyemogun, Oloyin, Aye ile, Imosan, Shasha, Enufotan, Irefon, Oko Asa and Ijana show very low groundwater potential tendencies). The localities within these settlements are characterized by very low lineament intersection density.
In this research, groundwater potential of Ibodi and its environs have been investigated using satellite imagery remotely sensed and aeromagnetic dataset. The hydrogeological investigation involved the extraction of lineaments from Landsat Thematic Mapper (TM) satellite imagery and aeromagnetic lineament from the investigated area. The processed image displays the lineaments trending NE-SW directions. Landsat and aeromagnetic lineament trends tend to agree in the study area, implying that these lineaments reflect real continuous fractures at depth. Hydrogeological maps based on lineament and lineament intersections were produced from the generalized lineament trends in the area. The lineament intersection density map identified cluster zones in the range of 0 to 1.17, 1.17 to 2.34, 2.34 to 3.52, 3.52 to 4.69 and 4.69 to 5.86 kg/kg2.
The map revealed that the concentrations of lineament intersection nodes dominate the eastern and north-eastern parts of the study area while other areas are characterized by scanty or no lineament intersections nodes. Ibodi falls within the high lineament intersections density zones; however, localities like Olorombo, Iwaro–Odo reflected medium lineament intersection density. Agbao, Oke Agbe, Aye, Onigbodi, Ilosi, Sefari, Iwori, Oja Oko and Araromi fall within low lineament intersection density. On the other hand, Odo–Iju, Iyere, Iyemogun, Oloyin, Aye–Ile, Imosan, Shasha and Ijana areas have very low lineament intersection density values. Remote sensing and aeromagnetic dataset has proved to be a useful tool in lineament identification and mapping. The result from the depth sounding data interpretation indicates four curve types which are H, QH, KH and HKH, where curve type KH has the highest occurrence.
The results from the vertical electrical sounding data reveal that the areas where the lineament intersected has tendency of very high groundwater prospect. This indicates that the area will be good for groundwater development. The study has led to the delineation of areas where groundwater occurrences are most promising for sustainable supply, suggesting that an area with high concentrations of lineament intersections has a high tendency for groundwater prospecting. This study demonstrates the application of remotely sensed data and aeromagnetic dataset for lineament interpretation in a hard rock hydrogeological environment. The lineament analysis has been effectively done in a GIS environment. The results from the study shows that the remote sensing and aeromagnetic technique is capable of extracting lineament trends in an inaccessible tropical forest.
The authors have not declared any conflict of interests.
REFERENCES
|
Amadi AN, Olasehinde PI (2010). Application of Remote Sensing Techniques in Hydrogeological Mapping of Parts of Bosso Area, Minna, North-Central Nigeria. Int. J. Phys. Sci. 5:1465-1474.
|
|
|
|
Amudu GK, Onwuemesi AG, Ajaegwu NE, Onuba LN, Omali AO (2008). Electrical resistivity investigation for groundwater in the Basement Complex terrain: a case study of Idi-Ayunre and its environs, Oyo State, Southwestern Nigeria. Nat. Appl. Sci. J. 9(2):1-12.
|
|
|
|
|
Banks D, Odling NE, Skarphagen H, Rohr-Torp E (1996). Perme-ability and stress in crystalline rocks. Terra Nova 8:223-235.
Crossref
|
|
|
|
|
Bayowa OG, Olorunfemi MO, Akinluyi FO, Ademilua OL (2014). Integration of Hydrogeophysical and Remote Sensing data in the assessment of groundwater potential of the basement complex terrain of ekiti state, southwestern Nigeria. Ife J. Sci. 16(3).
|
|
|
|
|
Caine JS, Evans JP, Forster CB (1996). Fault zone architecture and permeability structure. Geology 24:1025-1028.
Crossref
|
|
|
|
|
Evans JP, Forster CB, Goddard JV (1997). Permeability of fault-related rocks and implications for hydraulic structure of fault zones. J. Struct. Geol. 19:1393-1404.
Crossref
|
|
|
|
|
Hardcastle KC (1995). Photolineament factor: A new computer-aided method for remotely sensed fractured. Photogrammetric Eng. Rem. Sens. 61(6):739-747.
|
|
|
|
|
Henriksen H, Braathen A (2006). Effects of fracture-lineaments and in situ rock stresses on groundwater flow in hard rock. A case study from Sunnfjord, Western Norway. Hydrogeol. J. 14:444-461.
Crossref
|
|
|
|
|
Hobbs WH (1904). Lineaments of the Atlantic border region. Geol. Soc. Am. Bull. 15:483-506.
Crossref
|
|
|
|
|
Hobbs WH (1912). Earth Features and Their Meaning: An Introduction to Geology for the Student and General Reader. Macmillan Co. New York. 347.
Crossref
|
|
|
|
|
Hung LQ, Batelaan O, De Smedt F (2005). Lineament extraction and analysis, comparison of Landsat ETM and Aster imagery. Case study: Suoimuoi tropical karst catchment, Vietnam. Proc. SPIE 5983(5983):1-12.
Crossref
|
|
|
|
|
Montaj TM Tutorial (2004). Two – Dimension frequency domain processing of potential field data. 1-67 Toronto, Canada, Geosoft Incorporated: 2-90.
|
|
|
|
|
Leary O, Freidman DW, Pohn JD (1976). Lineaments, linear, lineation-some proposed new standards for old terms. Geol. Soc. Am. Bull. 87:1463-1469.
Crossref
|
|
|
|
|
Olade MA (1978). General features of a Precambrian iron deposit and its environment at Itakpe Ridge Okene, Nigeria. Trans. Inst. Min. Metallurgy Sect. 87:81-89.
|
|
|
|
|
Olorunfemi MO, Fasuyi SA (1993). Aquifer Types and the Geoelectric/Hydrogeologic Characteristics of Part of the Central Basement Terrain of Nigeria (Niger State). J. Afr. Earth Sci. 16:309-317.
Crossref
|
|
|
|
|
Osun State Ministry of Lands and Physical Planning (1965). Topographical Map of Ilesha southwestern Sheet 234.
|
|
|
|
|
Osun State Ministry of Lands and Physical Planning (1980). Geological Map of Ilesha Iwo Sheet 60.
|
|
|
|
|
Rahaman MA (1976). Review of the basement of S.W. NigeriaInc. Kogbe (ed) Geology of Nigeria. Elizabethan press, Lagos. pp. 41-58.
|
|
|
|
|
Zohdy AAR, Martin RJ (1993). A study of sea water intrusion using direct current sounding in the Southern part of the Ox ward Plain California. Open-file reports 93 – 524 U. S. Geological Survey. 13.
|
|

.png)