ABSTRACT
It has been established that Coronal Mass Ejections (CMEs) follow the phase of solar activity cycle. CMEs are known to be the major cause of geomagnetic storms which have devastating effects on earth atmosphere. Predicting their arrival times has been a major issue in space weather forecast. Influence of the phases solar activity cycle 23 on CMEs transit time were investigated using fast CMEs data with initial speed ≥ 900 kms-1 that were associated with intense geomagnetic storm obtained from Large Angle Spectrometric Coronagraph (LASCO) aboard the Solar and Heliospheric Observatory (SOHO) for solar cycle 23. Empirical Coronal Mass Ejections Arrival (ECA) model equations of Ojih-Okeke modified model, Gopalswamy 2000 model (G2000), Gopalswamy 2001 model (G2001), and Vrsnak and Gopalswamy 2002 model (VG2002) were applied to the data points. Scatter plots of CMEs transit time as function of CMEs initial speed and solar wind speed were generated. Linear correlation coefficients were obtained. The significance of the correlation was tested at 0.05 level of significant. Linear correlation coefficients obtained for solar maximum period of solar cycle 23 for Ojih-Okeke model, VG2002 model, G2001 model and G2000 model were -0.63, -0.82, -0.78 and -0.79 respectively and those obtained for declining phase of solar cycle 23 were -0.93, -0.80, -0.80 and -0.86 respectively. There is no significant difference between the correlations obtained for solar maximum phase and the declining phase of solar cycle 23. The findings depict that phases of solar activity cycle has no significant influence on CMEs transit time.
Key words: Coronal mass ejections, solar activity cycle, transit time, phase, geomagnetic storm.
Coronal mass ejections (CMEs) are huge explosions of solar materials (clouds of plasma and magnetic fields) from the sun that are released into space. Over a distance of a few solar radii, CMEs may accelerate up to a speed of 300 and subsequently propagate through the solar wind away from the Sun (Mostl et al., 2014; Yashiro et al., 2001). CMEs are known to be the major cause of severe geomagnetic disturbances which is often referred to as space weather (Zhang et al., 2001; Cheng et al., 2014; Cyr et al., 2000; Tripathi and Mishra, 2005). There are several space weather phenomena which tend to be associated with or are caused by geomagnetic storm. These include: Solar Energetic Particles (SEP) events (hazardous to Humans), Geomagnetically Induced Currents (GIC) which cause damages to satellites and electricity grid, ionospheric disturbances which may lead to radio and radar scintillation, disruption of navigation by magnetic compass and aurora displays at much lower latitudes than normal (Baker and John, 2008). The activity of the sun is measured by the number of sunspots appearing on its surface. The number of the sunspot increases and decreases over time in approximately 11 years called the solar cycle. Scientists are more interested in the solar cycle maximum and its minimum because they mark the peak and the least of the solar activity. Tripathi and Mishra (2005) observed that the occurrence frequency of CMEs generally follow the phase of solar cycle.
Carol and Dale (2007) also established that the occurrence rate of CMEs increases with increasing solar activity, its peak occurs during solar maximum, and CMEs can occur at any time during the solar cycle. Kim et al. (2007) also asserted that CMEs tend to tag along with solar activity cycle having its highest occurrence in solar maximum and its lowest during solar minimum. Several models have been developed to predict the arrival time of CMEs from sun to the earth. There are still deviations observed between the results from the models compared to the observed transit time of the CMEs. Since occurrence of CMEs has been observed to follow the phase of solar cycle, could it be that the phases of solar activity cycle have any influence on CMEs arrival time? Predicting the arrival time of CMEs with minimal average error has been a major issue in space weather forecast. Predicting the arrival time of CMEs with minimal average error will help serve as a practical way of getting advance warning of solar disturbances heading towards the earth, saving billions of Naira and Dollars in USA etc that would have been used to repair or replace damaged satellites and power grids, identify communication problems, help high altitude flight management and make provisions for renewable energy sources to protect the Earth against a black out. The aim of this study therefore is to investigate the influence of solar activity cycle on CMEs transit time.
Sources of data
The coronal mass ejections data were obtained from coronagraph observations of Large Angle Spectroscopic on Solar and Heliospheric Observatory (SOHO/LASCO) CME catalog on website https://cdaw.gsfc.nasa.gov/CME-list/ for solar activity cycle 23 (1999-2002). The geomagnetic storm data were obtained from the World Data Centre (WDC) for geomagnetism, Kyoto Japan on website wdc.kugi.kyoto-u.ac.jp> dstdir. We selected CMEs with initial speed U ≥ 900 kms-1 associated with disturbance storm time index (Dst ≤ 100 nT). The disturbance storm time index is a measure of geomagnetic activities storm use to access the severity of magnetic storms. Dst ≤ -100 nT denotes intense geomagnetic storm.
Coronal mass ejections data
Table 1 presents Coronal Mass Ejection data with initial speed ≥ 900 kms-1 associated with intense geomagnetic storm observed for the period of solar activity cycle 23. Column 1 is the date of CME event, Column 2 is Onset time of the CME, column 3 represents the CMEs initial speed and column 4 is the Dst index.
Empirical coronal mass ejection model equations
Gopalswamy et al. (2000) Model: Constant acceleration or deceleration
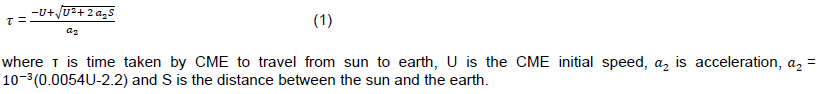
The author assumed that the acceleration was constant between the sun and 1AU (AU is astronomical unit, 1AU is sun – earth distance) so that the total transit time of CMEs from sun to earth is given by;
Gopalswamy et al. (2001) Model: Cessation of acceleration before IAU
The model assumes that interplanetary coronal mass ejection (ICME) acceleration ceased at a heliocentric distance of 0.76AU for all CMEs irrespective of their initial speed. Therefore the total transit time to IAU is the sum of the travel time to 0.76AU at constant acceleration, and the travel time from 0.76AU to IAU at constant speed. The total transit time from sun to 1AU is given by;
where d is acceleration cessation distance, d = 0.076AU, U is CMEs initial speed and is acceleration.
Vrsnak and Gopalswammy (VG) Model (2002 Model): Aerodynamic drag force
The model was proposed for estimating the ICME transit time when the only force acting upon the ICME in interplanetary space is the aerodynamic drag


Ojih-Okeke modified coronal mass ejection arrival model (Ojih and Okeke, 2017)
Authors assumed that the fast CMEs undergo (1) three phases as they travel from sun to earth: a deceleration which ceases before 0.1 AU, a constant speed propagation until about 0.45AU and a gradual deceleration that continues beyond 1AU. (2) That 0.45AU, the CMEs have decelerated to solar wind speed. Total transit time of CMEs from sun to earth is given by:

is acceleration for the third stage of the CMEs’ propagation and W is solar wind speed. The three empirical coronal mass ejection arrival model equations of Gopalswammy (Equations 1, 2 and 3) and the Ojih-Okeke modified coronal mass ejection arrival model (Equation 4) were applied to the CMEs data obtained for solar maximum period of solar cycle 23 and for the declining phase of solar cycle 23 to obtain the predicted CMEs transit time. Scatter plots of the CMEs predicted transit time as a function of CMEs initial speed were generated for each model. Linear correlation coefficient of each plot was determined. The significance of correlation was tested at 0.05 level of significant.
is solar radius, R is heliocentric distance. (R = (r )/r_s ), U is the CMEs initial speed and V is the CMEs speed at R=10.)
Figure 1 showed a scatter plot of CMEs observed transit time as function of CMEs initial speed for solar maximum period of solar activity cycle 23. The linear correlation coefficient obtained from the plot is -0.59 with p- value0.045. This p- value is less than 0.05 indicating that the correlation is significant. Figure 2 is a scatter plot of CMEs predicted transit time as a function of CMEs initial speed for Ojih-Okeke model for solar maximum period of solar activity cycle 23. The linear correlation coefficient obtained for the plot is -0.63 with p-value 0.003 which is less than 0.05. This shows that the correlation is significant. Figure 3 is a scatter plot of CMEs predicted transit time as a function of CMEs initial speed for VG2002 model for solar maximum period of solar cycle23. The linear correlation coefficient obtained from the plot is -0.82 with p-value 0.001. This value is less than 0.05 which implies that the correlation is significant. Figure 4 is a scatter plot of CMEs predicted transit time as a function of CMEs initial speed for G2001 model. The linear correlation coefficient obtained from the plot is -0.78 with p-value 0.001 which is less than 0.05. This value depicts that correlation is significant.
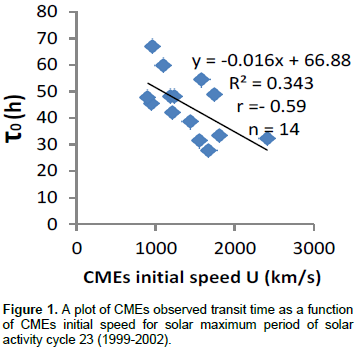
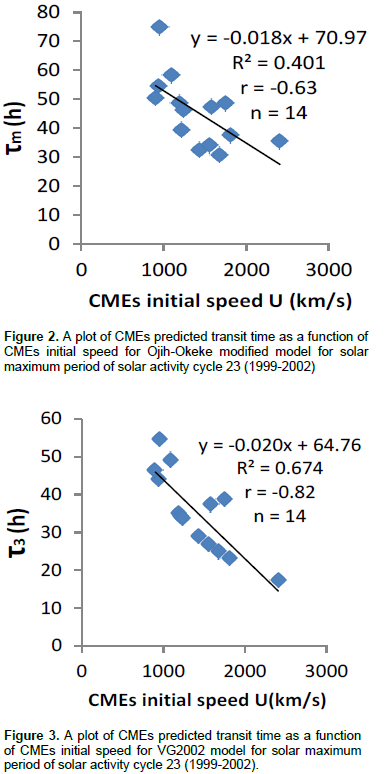
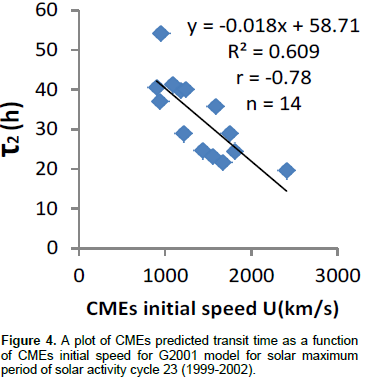
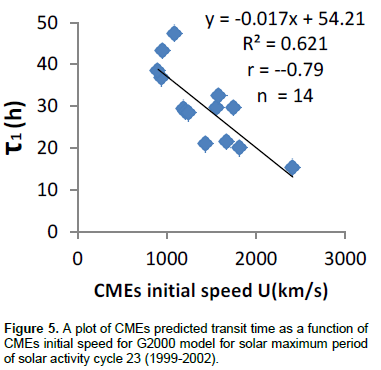
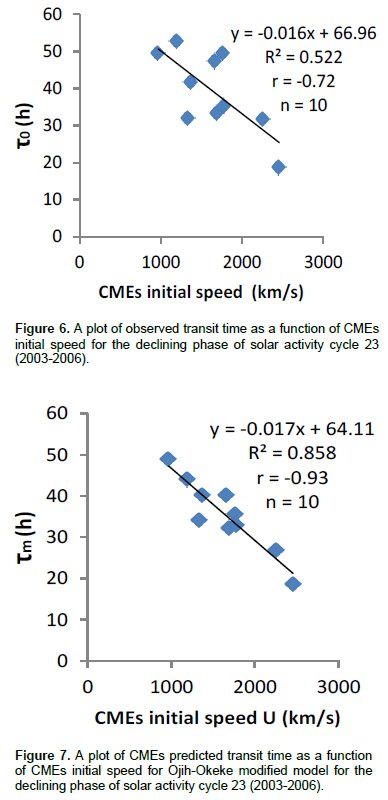
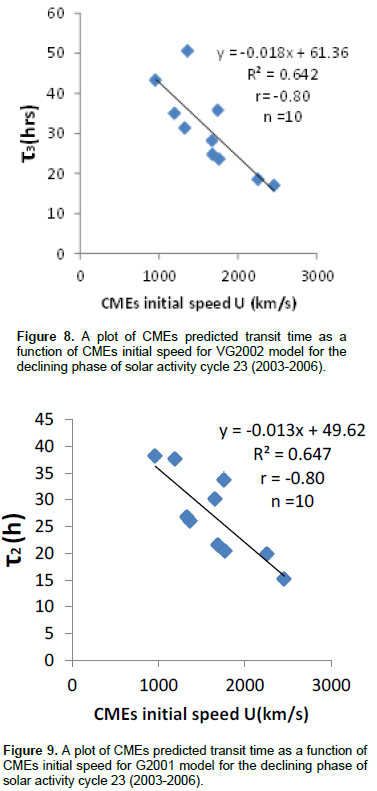
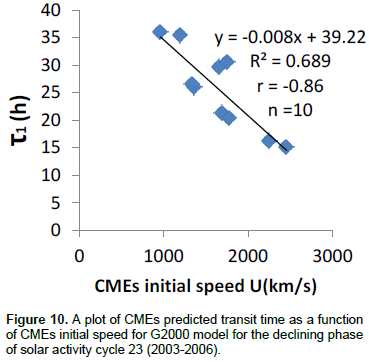
Figure 5 shows a scatter plot of CMEs predicted transit time as a function of CMEs initial speed for G2000 model. The linear correlation coefficient of the plot is -0.79. The p-value is 0.001. This value is less than 0.05 which also depicts that the correlation is significant. Figure 6 is a scatter plot of CMEs observed transit time as a function of CMEs initial speed for the declining phase of solar activity cycle 23 (2003-2006). Linear correlation coefficient obtained for the plot is -0.72 with p-value of 0.021 which is less than 0.05. This shows that correlation is significant. Figures 7, 8, 9 and 10 are scatter plots of CMEs predicted transit time as functions of CMEs initial speed for Ojih-Okeke modified model, VG2002 model, G2001 model and G2000 model respectively. The linear correlation coefficient for Ojih-Okeke model is -0.93, -0.80 for VG2002 model, -0.80 for G2001 model and -0.86 for G2000 model. The p- values are 0.001, 0.001, 0.001 and 0.001 respectively. The p-values are all less than 0.05 indicating that correlations are significant.
CONCLUSION AND RECOMMENDATIONS
Influence of phases of solar activity cycle on coronal mass ejections transit time was investigated using solar cycle 23. CMEs data with initial speed ≥ 900 kms-1 associated with intense geomagnetic storm obtained from Large Angle Spectrometric Coronagraph (LASCO) aboard the Solar and Heliospheric Observatory (SOHO) during solar cycle 23 were used. Empirical Coronal Mass Ejections Arrival (ECA) model equations of Ojih-Okeke modified model, Vrsnak and Gopalswamy 2002 (VG2002) model, Gopalswamy 2001 (G2001) model and Gopalswamy 2000 (G2000) model were applied to the CMEs data. Scatter plots of CMEs transit time as function of CMEs initial speed were generated. Linear correlation coefficients obtained from the plots were tested at 0.05 level of significant. The findings reveal that there is no significant difference, between the correlation coefficients obtained for solar maximum phase of the solar cycle 23 and the declining phase of the solar activity cycle 23. Therefore the phases of solar activity cycle have no significant influence on CMEs transit time. It is recommended that ECA models be employed in predicting arrival times of CMEs most especially the Ojih-Okeke model which has been proven to have yielded a better result.
The authors have not declared any conflict of interests.
The authors are grateful for the use of geomagnetic storm data from the world data centre for Geomagnetism Kyoto Japan and the use of the CME catalog generated and maintained at the CDAW Data centre by NASA and the Catholic University of America in Cooperation with the Naval Research laboratory.
REFERENCES
|
Baker DN, John K (2008). Severe space weather events –understanding societal and economic impacts. A Workshop Report of National Academies Press P 77.
|
|
|
|
Carol BW, Dale AO (2007). An introduction to modern Astophysics. San Francisco, Addison Wesley P 390.
|
|
|
|
Cheng L, Shen YZ, Bin A, Ye MP, Wang S (2014). Full Halo coronal mass ejections arrival at the earth.
|
|
|
|
Cyr OC, Raymond JC, Thompson BJ, Gopalswamy NK, Kahler SK, Lara N, claravella A, Romol N, Oneal R (2000). SOHO and Radio observation of CME shock Wave. Geophys. Res. Letters J. 27(10):1439-1442.
Crossref
|
|
|
|
Gopalswamy N, Alejandro L, Russel AH (2001). Predicting the I-AU arrival times of coronal mass ejections. Geophys. Res. J. 106(A12):29-217.
Crossref
|
|
|
|
Gopalswamy N, Lara A, Lepping RP, Kaiser ML, Berdichevsky D, Cyr OC (2000). Interplanetary acceleration of coronal mass ejections. Geophys. Res. Lett. J. 27:145.
Crossref
|
|
|
|
Kim KH, YJ Moon, Cho KS (2007). Prediction of the 1-AU arrival times of CME-associated interplanetary shocks: Evaluation of an empirical interplanetary shock propagation model. J. Geophys. Res. 112:A05104.
Crossref
|
|
|
|
Mostl CK, Amla JR, Hall PC, Liewer EM, Jong RC, Colaninno AM, Galvin AB (2014). Connecting speeds , directions and arrival time of 22 Coronal Mass Ejection from the Sun to 1AU. Astrophys. J. V5/2/11.
Crossref
|
|
|
|
Ojih VB, Okeke FN (2017). Application of Ojih –Okeke modified Empirical Coronal Mass Ejections Arrival (ECA) model in predicting the arrival time of CMEs. Int. J. Phys. Sci. 12(16).
|
|
|
|
Tripathi RM, Mishra AP (2005). Characteristics features of CMEs with respect to their source region. Proceeding of the 29th International Cosmic Ray Conference, Pune, India 1:149.
|
|
|
|
Vrsnak B, Gopalswamy N (2002). Influence of aerodynamic drag on the motion interplanetary ejecta. J. Geophys. Res. 107:10.1029/2001/JA 000120.
|
|
|
|
Yashiro SN, Gopalswamy GM, Cyr OC, Plunkett SP, Rich NB, Howard RA (2001). A catalog of white light coronal mass ejections observed by the SOHO Spacecraft. J. Geophys. Res. 109(A):7105.
|
|
|
|
Zhang J, Wang T, Zhang C, Liu Y, Nitta N, Slater GL, Wang J (2001). Flare-CME events association with a super active region recent insight into the Physics of the Sun and heliosphere: Highlights from SOHO and other space missions. Pal Brekke (Eds), Proceedings of IAU Symposium. P 203.
|


