Full Length Research Paper

ABSTRACT
The presence of multiples has been investigated in Onshore Niger Delta using 3D seismic data. The aim of the study was to investigate the characteristics of reflection events beyond 3s two way time on seismic data behind the boundary faults associated with the shadow zone. This involves detailed velocity analysis on semblance plot panel and accounting for moveouts due to reflections away and within the shadow zone. Interval velocity-depth models were generated from the velocity analysis and analyzed for shadow effect in the data. Results of the study revealed the presence of two velocity scenarios Onshore Niger delta. These are the primary and lower than normal velocities away and within the shadow zone, respectively. The interval velocity-depth models and their overlays on the seismic show a constant increase of velocity with depth for the primary model which seems normal, but this is contrary to the lower than normal velocity model where low seismic velocities predominate beyond 3s two way time (3.8 km), especially at the footwall of the boundary fault. These variations are likely due to the fact that sediments at the footwall of the boundary fault are thicker, compacted and thus yield stronger reflectors than the corresponding sediments away from the faults. The lower than normal velocity reflections in the absence of overpressure and anisotropy, which are also causes of low velocity reflections, are attributed to interbed multiple reflections in the data.
Key words: Seismic velocity, primary reflections, multiple reflections, boundary fault, multiple generators.
INTRODUCTION
The presence of interbed multiples in onshore Niger Delta has not until recently received attention, due to its impact on the quality and resolution of seismic reflection data. Multiples are seismic energies that have been reflected more than once before being recorded by receivers. They are known to have short periods, low velocities and amplitudes than the desired primary reflection signals. Because of these characteristics, they are not readily distinguishable from primaries, since they have almost the same arrival time and exhibit a dispersed character that creates a curtain of noise often stronger than the primary events (Retailleau et al., 2012).
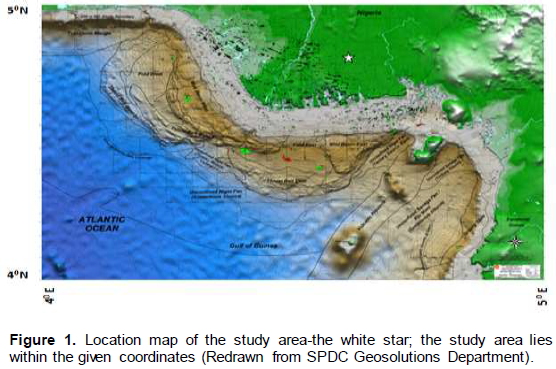
The study area is located in an onshore field in southeastern Niger Delta (Figure 1). The field lies between longitude 4° and 5°E and latitudes 4° and 5°N. Seismic data from the field are often characterized by chaotic and distorted reflections beyond 3s two way time, even after detailed conditioning and processing workflows have been implemented. These distorted zones often time referred to as the fault shadow zones on seismic is situated at the footwall of main boundary faults. Due to insufficient information about their character, efforts made to remove them to enhance interpretation of data leads to loss of the desired seismic reflection signals. Away from the boundary faults, reflections are observed to be more continuous and stratigraphic definition becomes more meaningful.
Some authors have researched on the possible causes of seismic reflection distortions (Fault shadow) beyond 3s in Onshore Niger Delta. Aikulola et al. (2010) and Opara (2012) investigated overpressure as the possible cause of reflection distortions beyond 3s in Onshore Niger Delta. In a similar study, Oni et al. (2011) and Kanu et al. (2014) investigated seismic anisotropy as the possible cause of reflection distortions beyond 3s in Onshore Niger Delta. The authors in both studies noted that reflection distortions around the shadow zone exhibits lower than normal seismic velocities, which may likely be due to overpressure or anisotropy. However, accounting for these in subsequent processing work flows did not significantly improve reflections in the shadow zone.
According to Dutta (2002), secondary low velocity semblance plots represent optimum stacking velocities for multiples, but added that it has to be established not to be as a result of lithological changes or from abnormal pore pressure. Weiglein et al. (2011) also proposed that interbed multiples can be generated by stronger subsurface reflectors regarded as multiple generators at any depth, more especially, the presence of geologic contacts of differing compactions on the footwall of main boundary faults.
Interbed multiple reflections Onshore Niger Delta has remained an exploration problem and no processing approach has so far considered in detail secondary reflections in the fault shadow zone. This attempt is therefore the first of its kind to the knowledge of the authors in Onshore Niger Delta. In the present study, we investigated the presence of interbed multiples in onshore seismic data through detailed velocity analysis of a 3D seismic data on a semblance plot panel. The study accounted for moveouts due to reflections by detailed velocity picking on the section and in the neighborhood of the shadow zone. Depth models were subsequently generated from these velocities and used to analyze the shadow zone.
GEOLOGY OF THE STUDY AREA
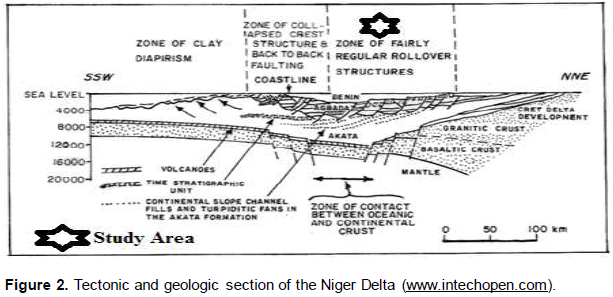
Generally, the geology of southwestern Cameroun and southeastern Nigeria delineates the onshore portion of the Niger Delta province (Figure 2). The Niger Delta sedimentary basin has been the scene of three depositional cycles. The first began with a marine incursion in the middle Cretaceous and was terminated by a mild folding phase in Santonian time. The second included the growth of a proto-Niger Delta during the Late Cretaceous and ended in a major Paleocene marine transgression. The third cycle, from Eocene to recent, marked the continuous growth of the main Niger Delta (Doust and Omatsola, 1990). These cycles (depo-belts) are 30 to 60 km wide, prograde southwestward 250 km over oceanic crust into the Gulf of Guinea (Stacher, 1995), and are defined by syn-sedimentary faulting that occurred in response to variable rates of subsidence and sediment supply (Doust and Omatsola, 1990).
The interplay of subsidence and supply rates resulted in deposition of discrete depobelts. When further crustal subsidence of the basin could no longer be accommodated, the focus of sediment deposition shifted seaward, forming a new depobelt (Doust and Omatsola, 1990). Each depobelt is a separate unit that corresponds to a break in regional dip of the delta and is bounded landward by growth faults and seaward by large counter-regional faults or the growth fault of the next seaward belt” (Evamy et al., 1978; Doust and Omatsola, 1990).
Regionally, extensive anticlines and faults on the down thrown part of regional faults dip southward. These regional faults which controlled deposition (Haack et al., 2000) are of interest in this study. This is because the reflection distortions observed on seismic data exists at the footwall of these faults. The footwall of these main boundary faults has thick and compacted overburden with stronger reflectors than the up-thrown side of the fault. This configuration is known to create adequate acoustic impedance contrast, a condition necessary for the occurrence of interbed multiples in Onshore Niger Delta (Weiglein et al., 2011).
The Akata, Agbada and the Benin formations are the major stratigraphic units of the tertiary Niger Delta (Doust and Omatsola, 1990; Reijers et al., 1997). Hydrocarbon accumulation occurs in the sandstone reservoirs of the Agbada formation, within the anticlinal structures in front of growth faults (Stauble and Short, 1967; Michele et al., 1999). The typically over pressured Akata formation at the base of the delta is of marine origin and is composed of thick shale sequences (potential source rock), turbidite sand (potential reservoirs in deep water), and minor amounts of clay and silt (Doust and Omatsola, 1990). The Benin formation is a deposit of alluvial and upper coastal plain sands that are up to 2,000 m thick and main water bearing formation in the Niger Delta (Avbovbo, 1978).
MATERIALS AND METHODS
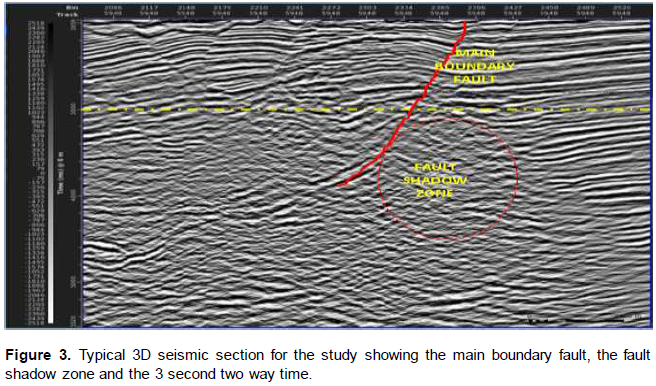
A 3D seismic data was used in this study. The data was acquired recently using novel acquisition parameters to enhance resolution and signal-to-noise ratio (S/N). Figure 3 is atypical section showing the fault shadow zone (red circle), the main boundary fault and a line indicating the 3s two way time beyond which the distortions are observed in the study.
The semblance velocity analysis tool is sensitive to the variation of velocity with depth. In this tool, as the maximum offset increases, the semblance power decreases, since the best-fit hyperbolic moveout does not simulate the actual non-hyperbolic moveout (Alkhalifah, 1997). This tool flattens primaries within the gathers and over corrects the gathers for low velocity reflection events
Prior to the deployment of the velocity semblance tool, standard data preparation and enhancement procedures were carried out to further enhance the signal-to-noise ratio. Subsequently, velocity semblance plots were generated from common image point (CIP) gathers for detailed velocity analysis. By considering the gradual increase of effective velocity with depth, velocities were picked on the semblance plot window comprising of two panels, A and B which are respectively plots of effective velocity and offset versus time seismic data. Primary and lower than normal velocities were picked separately on panel A, while observing the moveout of the gathers on panel B away and within the shadow zone.
These velocities were picked manually by steering the pickings away from the clusters corresponding to shadow zone and observing the effect of the picking on panel B. This process was repeated for the shadow zone and observing the effect of the picking on panel B. These pickings were validated by tying them to the corresponding locations on the seismic and time slice extracted at 3 s from the data to ensure geological plausibility of the picked velocities. The picked velocities were further converted from effective to interval velocities and subsequently, interval velocity depth models were separately generated for the primary and lower than normal velocity events. These velocity models were then overlaid on the seismic section for actual mapping of anomalously low seismic velocities in the study.
PRESENTATION OF RESULTS
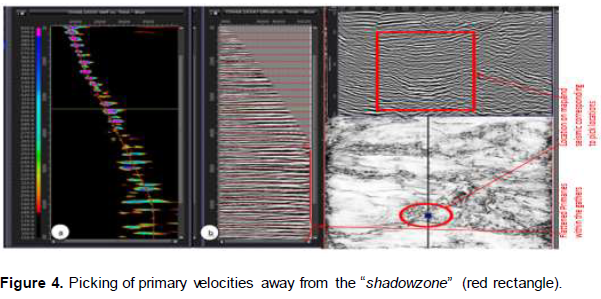
Results show that picking primary velocities (Figure 4a) flattened the offset gathers (Figure 4b) on the velocity semblance analysis window. Areas where primary reflections are predominant on the semblance plot panel correspond to areas of continuous seismic reflection events on seismic (red rectangle), which can be tied to the time slice (red circle). Moving away from the main boundary fault, reflection events become more continuous, less chaotic and distorted.
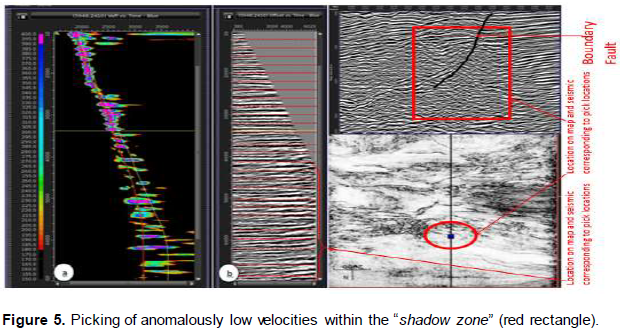
Secondary reflection events were identified as semblance clusters (or plots) corresponding to low effective velocities on the velocity semblance analysis window (Figure 5a). Observe the upward curving “events” on the offset gathers (Figure 5b). These events travel with lower than normal velocities, which overcorrect the primary reflection events on the gathers. The locations at which this lower than normal velocities were observed and picked correlate with the shadow zone on the seismic data.
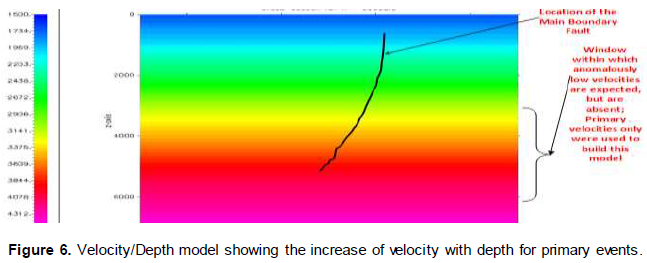
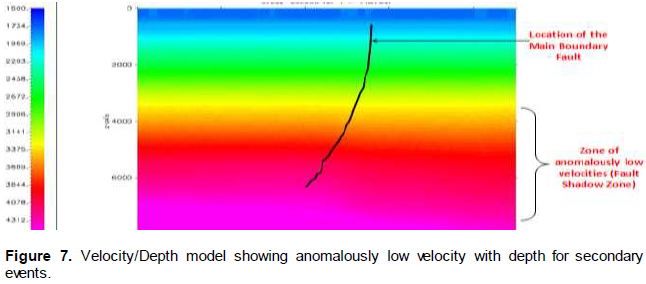
Interval velocity models built from the velocity function for primary and lower than normal velocity events are as shown in Figures 6 and 7, respectively. Figure 6 shows the normal increase of velocity with depth for the primary model. The prevalence of slower than normal velocities beyond 3.8 km (3 s) is evident in the lower than normal velocity event model (Figure 7). Note the localized nature of these anomalous velocities to the area corresponding to the location of the footwall of the main boundary fault on the seismic.
Constant increase of velocity with depth is observed in the overlay of the primary model on seismic (Figure 8a). In the overlay of the lower than normal velocity model on seismic (Figure 8b), we also observed constant increase of velocity with depth from 0 s to about 3 s. Beyond this two way time and in the area corresponding to the footwall of the main boundary fault, anomalously low seismic velocities were observed. This is shown by the dip in colorations towards the footwall of the main boundary fault on the figure.
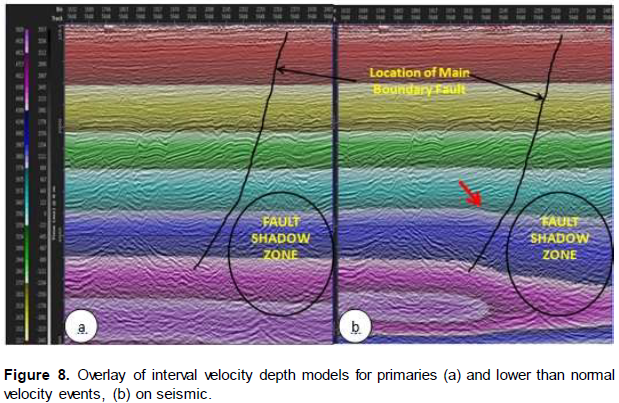
This correlates with the region of the seismic section with distorted and non-continuous reflections. The red arrow in Figure 8b indicates the onset of the lower than normal velocity events.
DISCUSSION
Multiples in Onshore Niger Delta have been investigated through semblance velocity analysis of a 3D seismic data. This involves picking of reflection events in the area of interest (AOI) on the seismic data. Results revealed that picking of the right primary velocities during velocity analysis flattened the gathers and these are more predominant in locations on the seismic away from the footwall of the main boundary fault, while velocities picked around the footwall of the boundary fault; however, overcorrect reflection gathers. This suggests that these reflection events are associated with anomalously low interval velocities than the primary events.
The interval velocity-depth models and their overlays on the seismic further validate the occurrence of this lower than normal velocity reflection events on the seismic. Constant increase of velocity with depth as observed on the primary model and overlay seems normal, but this is contrary to the velocity variation with depth delineated beyond 3 s two way time (3.8 km) on the lower than normal velocity model, especially at the footwall of the boundary fault with chaotic and distorted reflections on the seismic .
These chaotic and distorted reflections around the shadow zone are attributed to the fact that firstly, sediments at the footwall of the boundary fault are thicker, compacted and stronger reflectors than the corresponding sediments at hanging wall of the fault. These stronger reflectors referred to as multiple generators (Weiglein et al., 2011), are identified as significant sources of interbed short period multiples. Secondly, velocity estimations within the shadow zone did not properly account for this lower than normal velocities during data processing and this is likely responsible for the curtain of noise observed in the shadow zone (Retailleau et al., 2012).
Aikulola et al. (2010) related chaotic and distortive reflections observed beyond 3 s at the footwall of regional faults in the delta exhibits lower than normal seismic velocities, and associated these to the onset of overpressure regimes. Oni et al. (2011), in an onshore study in the Niger Delta, submitted that if anisotropy is taken into consideration and corrected during data preparation and enhancement, seismic imaging could be improved behind the fault. Kanu et al. (2014) reviewed velocity anisotropy considerations using different eta values. However, subsequent data processing after these considerations did not significantly improve imaging behind the fault. Although, the works of these researchers generally impacted seismic imaging, we still had poor imaging of seismic reflections beyond 3 s. Thus, having considered and eliminated overpressure and anisotropy as the likely causes of the shadow zone, interbed multiples which are low velocities events are speculated as the possible cause of shadow effects in this study.
Furthermore, all analysis so far has blindly assumed that multiples are inexistent Onshore Niger Delta and as such, no study has fully explored the possibility of multiples being responsible for the poor imaging within the shadow zone. Based on the foregoing discussion, these lower than normal velocity events in this study could therefore be attributed to interbed multiple reflections.
CONCLUSIONS
Detailed velocity analysis of 3D seismic data on a semblance plot revealed the presence of two velocity scenarios Onshore Niger Delta. These are the primary and lower than normal velocities predominantly found away and within the shadow zone, respectively. The lower than normal velocity reflections beyond 3 s two way time in the absence of overpressure and anisotropy, which also are causes of low velocity reflections, are attributed to interbed multiple reflections in the study area. We therefore recommend carrying out depth migration with this lower than normal velocities, preferably in the prestack domain to account for reflections at the footwall of the fault in the shadow zone. This will aid attempts to attenuate the multiples and enhance stratigraphy and structure within the fault shadow zone.
However, the challenge lies in the fact that the semblance velocity analysis, as employed in this study, involved detailed velocity picking as against the automatic picking that assumes already established regional parameters. This approach gives one advantage of adequately accounting for the velocities of the chaotic reflections beyond 3s in the study area.
CONFLICT OF INTERESTS
The authors have not declared any conflict of interests.
REFERENCES
|
Aikulola UO, Olotu SO, Yamusa I (2010). Investigating Fault Shadows in the Niger Delta: TLE 16-22. |
|
|
Alkhalifa T (1997). Velocity analysis using non-hyperbolic moveout in transversely isotropic media. Geophysics 62(6):1839-1854. |
|
|
Avbovbo AA (1978). Tertiary Lithostratigraphy of Niger Delta. Am. Assoc. Pet. Geol. 62:295-300. |
|
|
Dutta NC (2002). Geopressure prediction using seismic data: Current status and the road ahead -Y2K Review Article. Geophysics 67(6):2012-2041. |
|
|
Doust H, Omatsola E (1990). Niger Delta: AAPG Memoir 48: Tulsa. Am. Assoc. Pet. Geol. pp. 239-248. |
|
|
Evamy BD, Herebourne J, Kameling P, Knap WA, Molley FA, Rowlands PH (1978). Hydrocarbon Habitat of Tertiary Niger Delta. Am. Assoc. Pet. Geol. Bull. 62:1-39. |
|
|
Haack RC, Sundararaman P, Diedjomahor JO, Xiao H, Grant NJ, May ED, Kelsch K (2000). Niger Delta Petroleum Systems, Nigeria. AAPG Memoir 73: Am. Assoc. Pet. Geol. pp. 213 -231. |
|
|
Kanu M, Madiba G, Emakpor J, Olotu S, Mbah R, Obilaja S (2014). Demystifying the Fault Shadow Challenge in Onshore Nigeria. Shell Petroleum Development Company, Port Harcourt Nigeria. |
|
|
Michele LWT, Ronald RC, Michael EB (1999). The Niger Delta Petroleum System: Niger Delta Province, Nigeria, Cameroon, and Equatorial Guinea, Africa. |
|
|
Oni AA, Madiba G, Bertram MO (2011). Anisotropic Imaging of Okubotin 3D, Onshore Niger Delta, Article, January, 2011 www.researchgate.net |
|
|
Opara NC (2012). Investigating Abnormally Low Seismic Velocities Onshore Niger Delta within Overpressure Zones: SPDC Internship Report. |
|
|
Retailleau MG, Benjamin N, Pica A, Bendjaballah M, Plasterie P, Leroy S, Delmas L, Hugonnet P, Khalil A, Gulunay N, Smith R, Shorter J (2012). Advanced 3D Land Internal Multiple Modeling and Subtraction, A WAZ Oman Case Study.74th EAGE Conference & Exhibition incorporating SPE EUROPEC 2012 Copenhagen, Denmark. |
|
|
Reijers TJA, Petters SW, Nwajide CS (1997). The Niger Delta Basin, inSelley, R.C., ed., African Basins – Sedimentary Basin of the World 3: Amsterdam. Elsevier Sci. pp. 151-172. |
|
|
Stauble AJ, Short KC (1967). Outline of Geology of Niger Delta: Am. Assoc. Pet. Geol. Bull. P 51. |
|
|
Stacher P (1995). Present Understanding of the Niger Delta Hydrocarbon Habitat. in Oti MN, Postma G, eds., Geology of Deltas: Rotterdam. |
|
|
Weiglein AB, Hsu SY, Terenghi P, Li X, Stolt RH (2011). Multiple Attenuation: Recent Advances and the Road Ahead: The Leading Edge, August, 2011. |
|
Copyright © 2024 Author(s) retain the copyright of this article.
This article is published under the terms of the Creative Commons Attribution License 4.0


