The reported work was motivated by the energy needs in the Mauritania region and the utility of the search features of a software system, named HOMER (Hybrid Optimization of Multiple Energy Resources), for feasibility analysis of a hybrid power generation system (HS) for the Mauritanian northern coast. This study analyzed a sample of the available wind resources to meet the energy needs of these localities, using the HOMER software with the aim to search for the best possible configuration. A configuration was sought through this work which is considered with less intermittence in the system. In addition, given the relationship noted in the study between the influence of the average wind speed and the price of diesel in liters, it was also suggested to highlight configurations that exclude storage or that may decrease the size of the fuel. This, as a supplementary feature, also allowed, for example, to justify the additional cost generated by the insertion of the diesel group. In this context, five (5) values are given for the study of the price sensitivity of the liter of diesel; these values are proposed as follows: 1.05 $/L (current), 1.08, 1.1, 1.2 and 1.5 $/L (Maximum price). In another way, to carry out the sensitivity analysis through simulations that take into account the average wind speed, the values retained (4, 5, 6, 7 and 8 m/s (maximum speed)) to deepen the study of the behavior of configurations by HOMER software. Finally, we must remember the number of kilowatt-hours produced that may seem insignificant to the country's energy production capacity, but these few tens or hundreds of kilowatt-hours can revive all the hope of the localities of the Mauritanian northern coast. In short, we report here some interesting findings as a result of the search carried out of resources using the HOMER system.
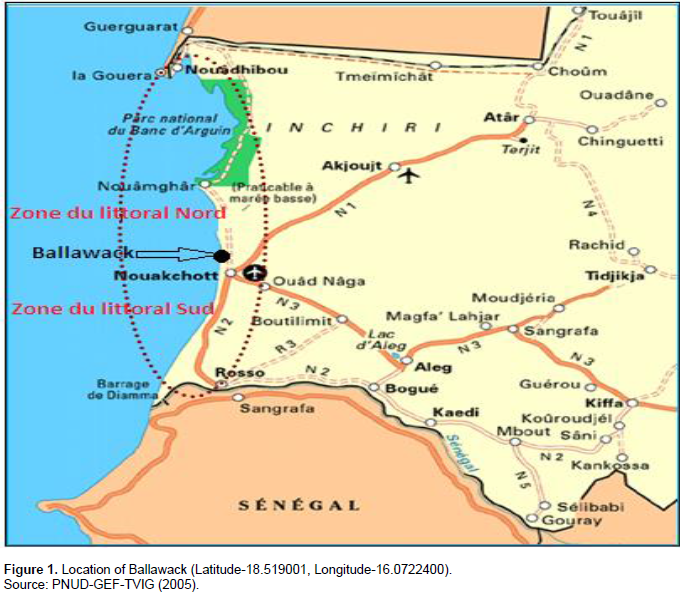
In Mauritania, villages on the northern coast have electricity needs for lighting, water desalination and ice-making for fish conservation (Rapport PNUD-GEF TVIG, 2005). The study of the bibliography made it possible to bring out the bases and the types of Hybrid System (HS). On the other hand, one of the most important problems of the hybrid system is to optimally size the components of the HS. This dimension is realized, in order to generate enough energy to meet the demand of the locality with minimal investment and exploitation costs (Puglia et al., 2017; Halabi et al., 2017). Secondly, it should be noted that the optimal design of HS is complicated by intermittent renewable resources, uncertain demand, non-linear component performance, and a large number of variables (Sajed Sadati et al., 2018; Kaabeche and Ibtiouen, 2014). It is in this context that this work is based on the research of the feasibility analysis by HOMER software, a hybrid power generation system for the Mauritanian northern coast (Figure 1). This is done by sensitivity analysis in search of an uninterrupted power supply configuration for these localities. This uninterrupted power supply is sought through the use of the HOMER software optimization model developed for hybrid power generation systems and developed by the National Renewable Energy Laboratory (NERL, 2012). Then, to carry out the analysis, a comparison of the starting variant (Figure 1) with several other possibilities was conducted. Finally, a discussion of the different results that are obtained through these variants is proposed; also, the choice of HOMER is proposed as a search response of the (optimal) configuration.

Study site
The locality of BLAWAKH (Figure 1) is located in the northern zone of the Mauritanian coast. Ballawack is located at the edge of the Atlantic Ocean between the city of Nouakchott in the south and that of Nouadhibou in the north (latitude 18.52° and longitude 16.07°). This town is populated by about 440 inhabitants with the presence of a Naval Training Center. It is strategic and the activity of the populations of this zone is distinguished exclusively by the exploitation of the resources of the fishing. The difficulties of the inhabitants of this zone are characterized by the absence of a possibility of storage of the fishing products, by the supply of drinking water and that of the electrical energy. Finally, the reasons for installing a hybrid power generation system are dictated by the use of existing resources on the site. It must be remembered that the site is protected and is fragile for its biodiversity.
Studied hybrid system (HS)
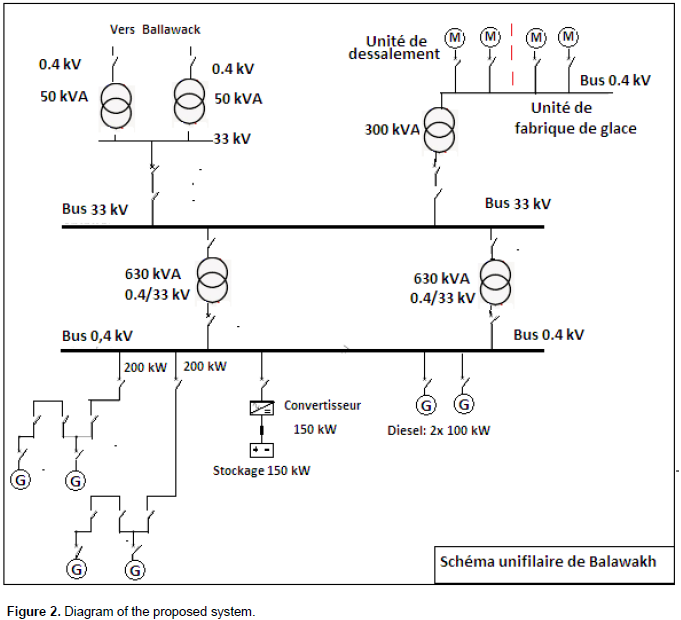
The electrical system studied is proposed as a departure for Ballawack, which is located in Figure 1. More specifically, it is suggested in this configuration (Figure 2) to equip the locality as follows:

Hybrid system (HS): Power of a 100-kW wind turbine (4 wind turbines), with diesel emergency units (1500 turn/minute, 2 x 100 kW), with a 10 m³ fuel storage tank. In addition, there is a storage system Li-Ion battery, whose power is aligned with the power capacity of the inverter (150 kW). In addition, 4 wind turbines (the power of each wind turbine is 100 kW) are proposed.
Medium Voltage (MV) / Low Voltage (LV) Networks: Whatever the configuration that will be proposed, the internal distribution in the village is carried out through pole transformers of 50 kVa (33 Kv/0.4 kV). Among these transformers, a transformer for desalination and ice plants of 300 kVa (33 kV/0.4 kV) is proposed.
Low Voltage (LV) Networks
It should be noted first that the supply of locality, desalination and ice factory is carried out through the LV (three phase of 0.4 kV). The LV networks are offered in twisted 70 mm² aluminum cables, with 54.6 mm² almélec neutral conductors, and two 16 mm² (NF C 33-209) aluminum public lighting conductors laid on wooden poles. The LV networks are offered in twisted 70 mm² aluminum cables, with 54.6 mm² almélec neutral conductors and two 16 mm² (NF C 33-209) aluminum public lighting conductors laid on wooden poles.
Desalting units
The reverse osmosis desalination units are each located in a container with an electrical power supply of 25 kW. They are fed through a 0.4 KV cable. In addition, reverse osmosis desalination units must produce 100 m³/day. For a specific demand of 6 kWh/m³, the salinity (TDS) of the well water is <40.000 mg/l with a temperature <25°C. The quality of the produced water is <500 mg/l TDS. An inlet pressure coming from well pumps of a value of 4 bar was proposed. It should also be noted the existence of a reservoir that plays the role of water storage, equivalent to the peak demand of 5 days. Not to mention, the presence of a water tower and a water distribution network in the locality.
Ice making (02 units)
The total power of the two ice units is 70 kW (1st unit (ice plant size with 4 T/day, with an ice plant power of 17 kW) and 2nd unit (ice plant size (8T/day), with a power from the ice factory (50 kW)). It is also proposed for the evaporation temperature (-21°C), with a maximum ambient temperature (35°C), without forgetting a temperature of water (25°C) and a Refrigerant (R404 A). Ice storage is carried out through a container with its own refrigerant circuit (container size (40 ft). The maximum ambient temperature is 35°C. There is also a refrigerant type (R134 A). Not to mention the data that is: the storage capacity (16.00 T), the internal temperature (-5°C), the electrical power of storage cooling (22 kW) and the ice density (0.55 T/m³). All parts that touch the ice are made of stainless steel with the container placed on concrete blocks.
Functioning of the HS
The operation is done in such a way that the required energy of the wind system is derived from the expected energy demand. With this in mind, steps are taken to minimize the use of diesel generators. Similarly, the electrical energy storage system will locally store excess energy from wind turbines and provide AC power in low or no wind periods, or when power demand is high. In addition, the capacity of the battery is used to improve the quality of the network with the appropriate energy control. The Bidirectional Converter must provide the following functions: Initialization of the network, operation of the bidirectional inverter (Operation at 50 Hz with +/- 5 Hz as operating range). The control of the inverter is such that the system appears as the source of the AC voltage with a low apparent internal impedance (in other words, as a "stable" voltage source). Finally, for operation, it must also remember that the converter participates with a power of 120 kVa. While, peak demand during engine start for 200 ms is covered by power (120 kVa (storage) + 80 kVa (generator set) + 320 kVa (wind)). Thus, for a total of 520 kVa that covers the engine startup, for example, during the start of the big ice machine, it suggests very important currents.
Objectives
The main objective it is sought through the initial proposal (Figure 1) - an optimal configuration for an uninterrupted supply of energy needs. It is also a question of developing an integrated system for this locality. In this context, it is important for people living in fishing activities to master the constraints in terms of conservation of fresh produce and drinking water supply. For the methodology, it involves the completion of an evaluation of Ballawack's wind resources. Thereafter, an estimate of the electrical charge profile of the proposed HS is proposed. Finally, a HOMER simulation is performed, which is followed by a sensitivity analysis of the different configurations that are proposed by HOMER.
Presentation of input data
Simulation by HOMER software requires a certain number of data entries. This number of inputs includes the generator set, load profile data, wind resources and solar resources. Without forgetting, that it is necessary to introduce also, the data which are related to the prices and the operating costs of the equipment.
Assessment of wind resources
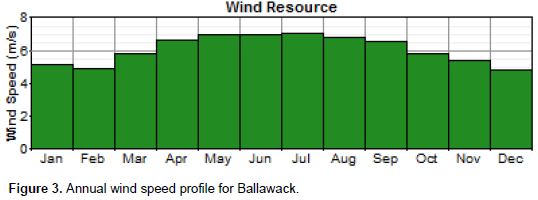
The wind speed data (Figure 3) are obtained from a measurement companion that was conducted near the site. The monthly average speed for the site is significant during the months of April until September when it is at a speed slightly higher than 6m/s; however, it stays below 7m/s. It can be concluded that the Ballawack site has a wind farm favorable to the application of wind turbines. This deposit can be exploited, in order to produce complementary electric energy to diesel production to form the HS. In the rest of the year, the wind speed can fall to 5 m/s. In addition, it should be noted that the average annual speed is close to 6 m/s.

Choice of the wind turbine (source: Simulation HOMER)
i) General description: Website: www. Windenergysolutions.nl, currant type AC (Grid voltage: 400 V, Grid frequency 50 Hz, phases: 3 phase + neutral.
ii) Generals ratings: 100 kW rated 2 bladed upwind turbine, 30 m diameter, asynchronous generator, formerly known as the LW30 / 100 langerwey. LW30/100 is a two bladed, reliable 100 kW midsize wind turbine with a rotor diameter of 18 m. The mechanical part of the LW30/100 is based on the electrical parts providing power conversion and control.
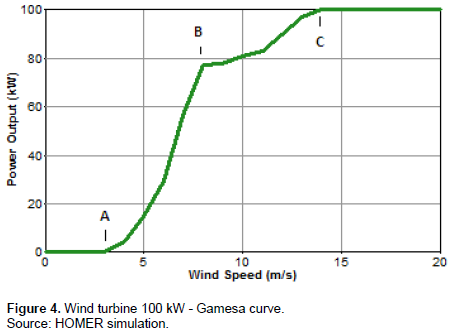
Some data are provided above to provide information on the power curve of this turbine (LW30 / 100). Thus, Figure 4 which is proposed by HOMER software shows a curve divided into four parts: Part 0A or the wind turbine is stopped. This zone applies to wind speeds that are less than or equal to 3.5 m/s (minimum wind speed required for start-up). This also implies that in this zone the power generated by the aerogenerator is zero. On the other hand, in the AB part, the wind turbine develops a power proportional to the wind speed (wind speed of operation). The zone (AB) must also stop at a wind speed close to 8 m/s. The next part is dedicated to the BC area. This zone also develops a power proportional to the wind speed. In this zone, the wind speeds stay below a value close to 14 m/s. Finally, the last zone is dedicated to wind speeds greater than a value close to 14 m/s. In this zone, the wind turbine will develop a constant power of the order of 100 kW.

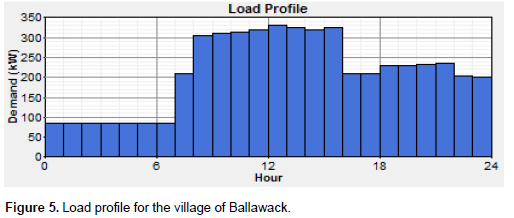
Estimation of the load profile
The proposed load for its HS includes two reverse osmosis water desalination units and two ice-making units, as well as population and naval training center demand. It should also be noted in Figure 5 that the power demand (more than 300 kW) will be dedicated to the interval [8.16 h] for reverse osmosis water desalination units and those for ice-making. It is important to emphasize that beyond the interval [8, 16 h] are the secondary charges (night lighting, TV and others). Similarly, here, it is important to note that Figure 4 (wind profile) appears to meet the demand for electricity in Figure 5 (load profile) of the locality of the case study.

Modeling of wind generator system
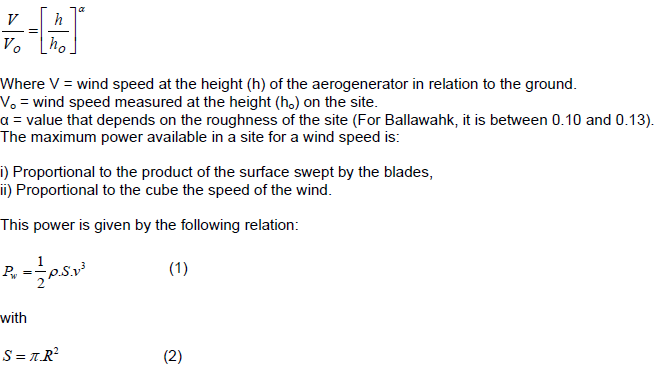
Power output of wind turbines for allocation depends on wind speed at hub height which can be calculated using power-law equations:
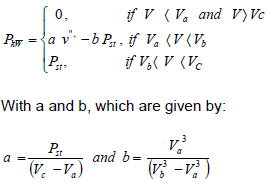
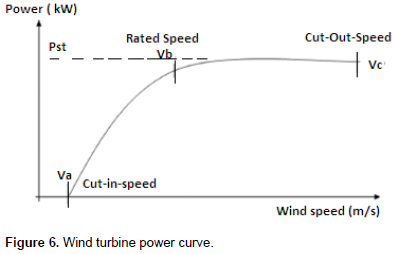
Different wind turbines have different power output and performance curves. Therefore, the equation of a wind system is strongly influenced by the power curve of the wind turbine used (Figure 4). The curve of Figure 4 can be approximated and modeled through the curve of Figure 6.

It is important to note that Figures 3 and 5 showed that the wind speeds at the site are in the superim range at 4 m/s. This means that the aerogenerator will be in the running most of the time.

Here the best configuration of the hybrid system is analyzed. This involves a configuration for an uninterrupted power supply that will be used later for the electrification of the localities of the northern coast of Mauritania. For this, the case study of the initial configuration (Figure 1) is proposed above.
Hybrid system simulation (Wind/diesel and storage)
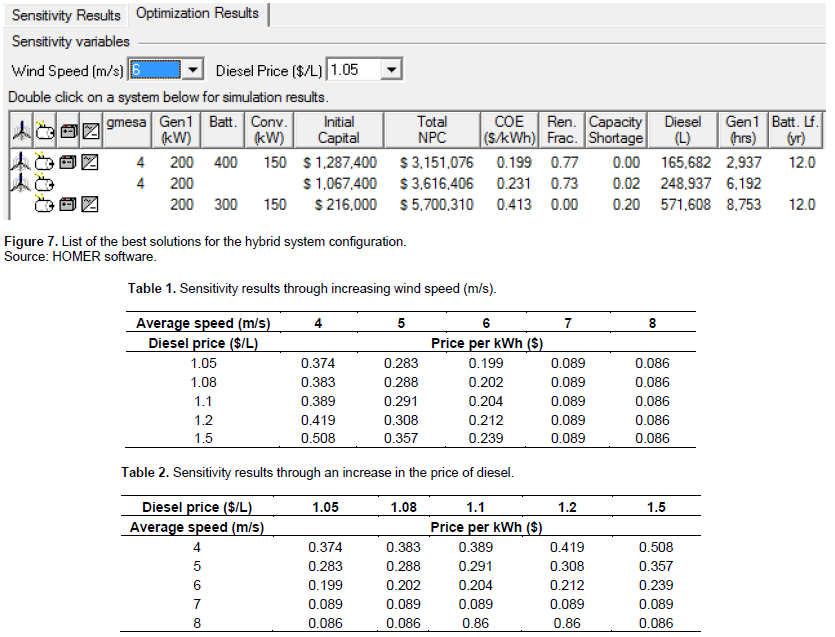
For simulation purposes, the hybrid system (wind/diesel and storage) of Figure 1 was designed in such a way that it consists of two diesel generators of 100 kW each, of a number of 4 wind turbines. We must add an inverter system and a storage system (batteries). It should also be noted that the load is powered from a network AC type (Alternating Current). The simulation result is given in Figure 6. This simulation is performed by simulation through the initial variant (Figure 2) for the site. The HOMER software has been used to conduct several simulations often to find the optimal system, one that can cover the demand of the locality. The most economical system is proposed according to "Net Present Cost" and the cost per kWh in $ among all simulated systems and configurations (Figure 6). Thus, the best solutions of the HOMER software are proposed as follows:
i) 1st configuration given in the case of the icon (wind / diesel / batteries): 4 wind turbines of 100 kW each, two generators of 100 kW each, 400 batteries of 4 V / 1900 Ah / 7.6 kWh each and a converter of 150 kW. This configuration records a total NPC of 3, 151,076 $, a cost per kWh of 0.199 $ with a renewable energy fraction of 0.77 (77%) and finally, the diesel generator runs 2,937 h.
ii) 2nd configuration given in the case of the icon (Wind / diesel): 4 wind turbines of 100 kW each and two generator of 100 kW each with a total NPC of 3, 616,406 $, a cost per kWh of 0.231 $ / kWh and a 0.73 renewable energy fraction (73%) and the diesel generator that can run 6,192 h.
iii) 3rd configuration given in the case of the icon (Wind / diesel / batteries): two generator of 100 kW each, 300 batteries of 4 V / 1900 Ah / 7.6 kWh and a converter of 150 kW with a total NPC of 5, 700,310 $, a cost of $ 0.413 / kWh and a renewable energy fraction of 0.00 (0%) and the diesel generator that can run 8 753 h.
In conclusion of this part, it is noticed that the price of the KWh increases by passing from the 1st configuration to the 3rd configuration. It should also be noted that if the initial capital, for example is 3, $ 151,076 in the 1st configuration, then it is $ 3, 616,406 in the 2nd configuration and it is proposed at $ 5,700,310 in 3rd configuration. In this same vision, the NPC shows the configurations in order: from the most economic to the least economic (Figure 6). To highlight the presence of the storage system or not, it was important to look at the influence of the wind speed (m/s) and the price of diesel ($/L) on the configurations. For the price of diesel, the reference value is used until today, which is given by the Mauritanian Company of Refining Industries (SOMIR). This value is $ 1.05 / L (I. B. Ramdhane et al., 2017).
Sensitivity analysis
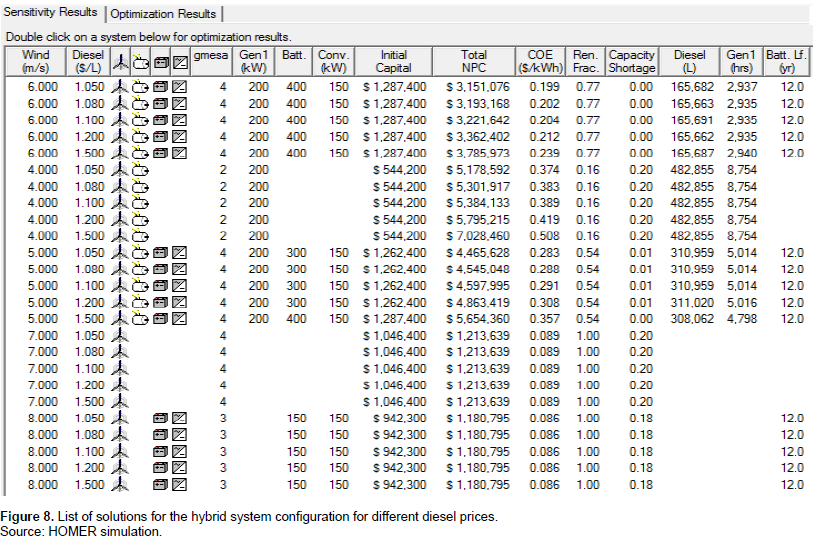
On the basis of the above, five (5) values are proposed for the sensitivity analysis for the study of the price sensitivity of the liter of diesel. These values are broken down as follows: 1.05 $/L (current), 1.08 $/L, 1.1, 1.2 and 1.5 $/L (maximum price). In parallel with the price per liter of diesel, simulations have also been carried out which take into account the wind speed (4, 5, 6, 7 and 8 (m/s)) to simulate the behavior of the configurations and see the proposals HOMER. For Figure 7, it is important to note that the average wind speed of 8 m/s privileges a wind system with storage and converter. On the other hand, the average wind speeds of 7 m/s bring out the wind component alone. While the range of average wind speeds of 6 m/s include the diesel group in the wind system with storage and converter. This phenomenon continues for average wind speeds of 5 m/s. Finally, once it arrives at average wind speeds of 4 m/s, preference is given to the wind system with diesel, without storage and without converter. Thus, for the sensitivity analysis, once-wind speeds are measured in the northern zone of Mauritania, allowing to propose the appropriate configuration to the site. In order to carry out the analysis of the sensitivity of Figure 7, a new reorganization of the values proposed therein by the HOMER software, was put forward in the form of two Tables (1 and 2). Then, the first table will display the sensitivity results through the increase of the wind speed (m/s). On the other hand, the second table will give the results of sensitivity through an increase in the price of diesel.

On the one hand, Table 1 shows that an increase in wind speed in m/s of 4, 5, 6, 7 and 8 (maximum to take into account values of more than 7 m/s) by keeping a value of five values of the following diesel price fixed each time: 1.05, 1.08, 1.1, 1.2 and 1.5 in $/L. Thus, there is a decrease in the price of kWh in $, following the increase in the average wind speed in m/s. So, we must look at the example of the price $ 1.05/L; therefore, for an average speed of 4 m/s, the price per kWh is $ 0.374, while it tends to a value close to $ 0.086/kWh for an average value of the wind speed of 8 m/s. In summary, it recorded a decrease of $ 0.288 (a value close to 77%). Indeed, it can be concluded for this part, that an increase in wind speed (m/s) will result in a decrease in the price of kWh. The characteristics of the site, in particular the wind speed (m/s) plays an important role in the price of the kWh of the HS. Therefore, weather characteristics are of great importance for the design of wind systems in general and hybrid systems (wind and diesel) in particular. Thus, any increase or decrease in the wind speed (m/s) on the site will be followed by a configuration with a corresponding ranking. For Table 2, in the same previous view, an increase in the price of diesel for the values (1.05, 1.08, 1.1, 1.2 and 1.5 $/L), for the same average wind speed in (m/s) will lead to an increase in the price of kWh. So, we have to take a look at the average speed of 4 m/s. Therefore, it is obtained at $ 1.05/L. The price per kWh is $ 0.374, while it tends to a value close to $ 0.508/kWh for a value of $ 1.5/L. Summarily, it records an increase in the price of kWh of $ 0.134 (a value close to 136%). Therefore, any increase in the price of diesel, by keeping the average wind speed (m/s) constant, will lead to an increase in the price per kWh. Similarly, any increase in the price of diesel will enhance the ranking of the wind system configuration and its storage compared to diesel alone or with storage. Overall, the electrical system to consider for this site is the wind system with storage, with a role of minimal diesel (backup).
Analysis of the annual electricity production of the HS
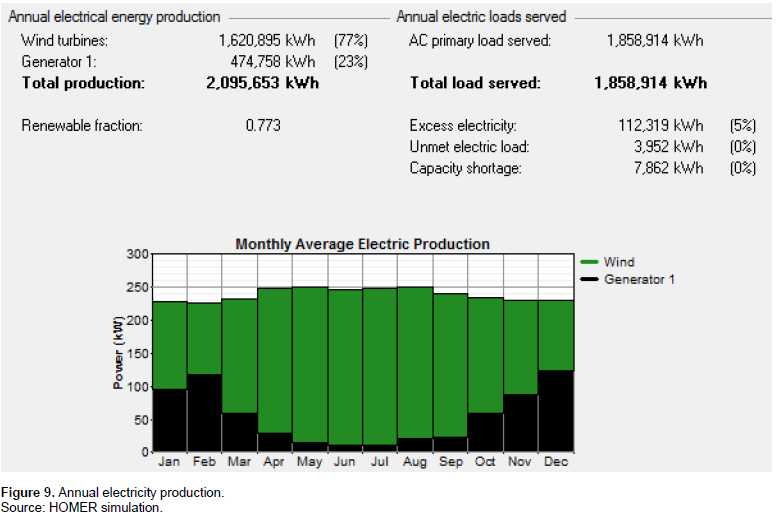
Wind energy is used as the basic source in this simulation to power the site load (Figure 7).
Analysis of average electrical production (Figure 6, 1st configuration retained)
It is noted that the contribution of wind power is considerable (Figure 8) as it constitutes the bulk of the energy consumed by the load. In this part, the aerogenerator participates in the average production of the site with 3.41 times that of the average production of the diesel. This is determined for a fraction of the wind generation system at 0.77. On the other hand, the excess energy produced will be used to recharge the storage system. The system manages to store a value of 112, 319 kWh or 5% of the total production.

Average electrical production: The analysis of the average electrical production (Figure 8, production histogram) revealed that participation of the emergency generator is more expressed in the least windy months (Figure 2: speed close to 5 m/s). These months are: January, February, March, November and December. Therefore, it is proposed for the site four wind turbines (1st configuration). This is important to point out that the diesel generator is sized to meet peak demand for power (Kusakana and Vermaak, 2013; Chen et al., 2015; Kumar et al., 2011). Since the peak demand of the system is close to 325 kW, its participation is more visible in the months of January, February, March, October, November and December. In these months, the average value that is recorded approaches 100 kW. Beyond these months, the wind is more present. So, it is necessary that a diesel generator with a total capacity slightly more than 100 kW per moment be available. This allows to say that a group of 100 kW could do the work of relief. It is necessary to add to this power of 4 wind turbines of 100 kW each. For the first configuration, there is an excess of 7862 kWh which is proposed for storage. The excess energy will be used to cover the starting of motor and other rotating reserves. HOMER proposed a storage solution accompanied by the converter. The excess energy will be stored in the storage system and will be delivered to the loads as requested.
Proposed HS production costs and emissions of greenhouse gas (GHGs)
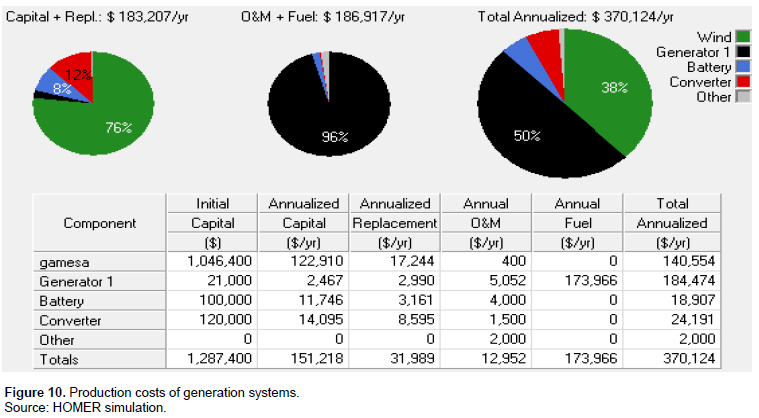
HS production costs (Figure 9): The total cost (capital + replacement) of the four wind turbines is close to 76% (the rest (24%) is shared between the generator, the storage, the converter and others). Also note that the electrical production dedicated to the site's wind turbines record an initial capital of $ 1,046,400 (Figure 10). These wind turbines give a total value analyzed of $ 140,554/year (Figure 10). However, their replacement cost is $ 17,244/year. It should also be remembered that wind turbines have a lifespan estimated at close to 20 years. The other parts of the system have an initial capital of $ 21,000 for the generator, an initial capital of $ 100,000 for the storage system and initial capital of $ 120,000 (Figure 10).


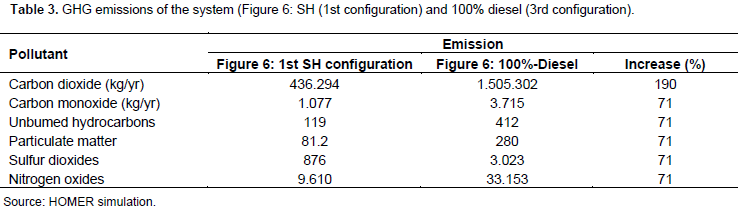
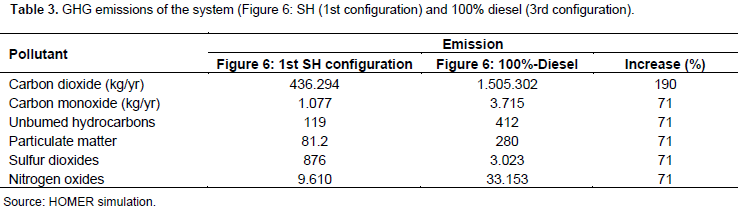
Reducing GHG Emissions from the HS: The HOMER software simulation also showed that the use of the hybrid wind/diesel with storage system can significantly reduce dependence on the available diesel resource (Figure 9). But HS on one side also helps reduce pollutants, such as carbon emissions, reducing the greenhouse effect. On the other hand, the study shows that the use of a hybrid wind/diesel system with storage can give the most economical configurations, if the price of diesel continues to increase. The emissions that are expected from most air pollutants are shown in Figure 9. These emissions are given by pollutant type per kg/yr. In this context, Table 3 is proposed for comparison of greenhouse gas emissions between a hybrid solution and 100% diesel. To better highlight the increases in GHG emissions, a reorganization of the simulation results for the components (GHG emissions of the system) was carried out. This led to Table 3 which shows a shift in GHG emissions especially for carbon dioxide from 436,294 to 1,505,302 (kg/yr), an increase of about 190%. These carbon dioxide emissions are the basis of GHGs. Emissions have also increased by around 71% for carbon monoxide. For the other components (Unbumed hydrocarbons, Particulate matter, Sulfur dioxides and Nitrogen oxides), a rise of 71% has to be recorded. Since the use of diesel usually leads to air pollution through pollutants harmful emissions of gas. It should be said that HOMER did not propose an analysis of the cost of the penalty to be imposed on the pollutant. It is important to note that if ever a cost penalty exists for a concrete pollutant, then HOMER will add the cost of this penalty to the total annual cost of the system that will exclude the 100% diesel variant.
A number of conclusions were reached as a result of this study. First, it was noted that the most economical system (proposed) is based upon the minimum "Net Present Cost" and the cost per kWh in $ of all simulated systems and configurations. Therefore, given the relationship between diesel consumption in liters and wind speed, it was important to go to the side of the study sensitivity analysis. Secondly, this study allows ascertaining the influence of the average wind speed (m/s) and the influence of the price of the diesel liter ($/L) on the classification of the different configurations. Thus, on the one hand, it has been noticed for each range of average speeds in m/s of the wind of the site, there are preferences for a given configuration. These configurations proposed by HOMER are different and respond to average speeds (4, 5, 6, 7 and 8 (m/s).) In this order of average wind speeds, preferences are proposed. These preferences are, for example, average wind speeds of 4 m/s a wind system with diesel, without storage and without converter. If the average wind speeds are of the order of 5 and 6 m/s, it is then proposed by HOMER the configuration which takes into account the diesel group with the wind system, the storage and the converter. On the other hand, for average wind speeds of 7 m/s, HOMER gives preference for the wind system alone and at the end, for 8 m/s. HOMER offers a wind-only system with storage and converter. On the other hand, a new reorganization of the values that are proposed by HOMER under two Tables 1 and 2 made it possible to draw the following results:
i) Any increase in wind speed (m/s) while keeping the price of diesel constant will result in a decrease in the price per kWh. It should be added that any increase or decrease in wind speed (m/s) on the site will be followed by a configuration with a corresponding ranking in the hierarchy of systems that are proposed by HOMER,
ii) Any increase in the diesel price, by keeping the average wind speed in (m/s) constant, will lead to an increase in the price per kWh. Similarly, any increase in the price of diesel will enhance the ranking of the wind system configuration and its storage compared to diesel alone or with storage. Thus, HOMER's feasibility analysis of a hybrid power generation system for the Mauritanian northern coast has been proposed. In addition, the HOMER software simulation has also shown that the use of the hybrid system (wind/diesel with storage) can significantly reduce the dependence on the available diesel resource. Besides, it also helps to reduce pollutants, such as carbon emissions, thereby reducing the greenhouse effect. Finally, it appears that this studied system is interesting in comparison with the conventional system of electricity production in the isolated sites existing in Mauritania. It is necessary to know how to choose the optimal variant to cover the loads of the localities which are proposed to the electrification. Finally, it is important to note also that the system that is retained can be popularized for this area and in particular to solve the problems of these localities.