Full Length Research Paper

ABSTRACT
This study estimated spatial variability of precipitation in the monthly and annual scales in Iran for the period of 1975 to 2014 in 140 stations using kriging interpolation methods. In precipitation variability analysis three procedures were used: Mann-Kendall test, Sen's slope estimator and spatial trend patterns. Results show that there are both increasing and decreasing trends in monthly precipitation in Iran. Based on the magnitude of the significant trend, there are three patterns of the significant trend (average, lower and upper) in the monthly precipitation of Iran that vary from -0.0785 mm/month in October to 0.1536 mm/month in November. As a result, in January, February, March, May, October, and December, the magnitude of negative trends and in April and November the random and positive patterns were estimated in the precipitation in 140 stations, respectively.
Key words: Spatial variations, trend variations, spatial variability, Mann-Kendall, precipitation.
INTRODUCTION
Precipitation is an important element to analyze the environmental process. There are various spatial-temporal methods which were employed for classifying simulations in climatic series. However, the trend pattern and its spatial simulations of precipitation is an important aspect in the analysis of climatic and environmental simulation patterns. Various parametric and non-parametric statistical tests (Sung et al.,2017) have been used in measurement of rainfall trend by many researchers (Javari, 2017b). The Mann-Kendall test, Sen's slope estimator test (Ahmad et al., 2015), and spatial trend analysis tools (ArcGIS10.3 tools) were used for trend analysis and forecast, and an upward and a downward trend in the precipitation were found on monthly, seasonal and annual periods (Tabari et al., 2011). The spatial variability and trend pattern of precipitation (Zilli et al., 2017) are important property in the regionalization of climatic condition. The trend patterns and its spatial simulations of precipitation (Guan et al., 2017) was considered by various aspects due to several benefits over spatial methods. Some of these aspects include: (1) does require the spatial variability of precipitation series using geostatistical methods (Cecinati et al., 2017) (Kriging method), (2) compare methods rather than temporal method, and (4) larger control is completed for the precipitation spatial distributions variability (Zeleke and Damtie, 2017). In spite of mentioned aspects, the effectiveness of the spatial variability in the precipitation series (Kutiel and TürkeÅŸ, 2017) on the results of trend spatial method has been analyzed using kriging interpolation methods. In addition, considering the Mann–Kendall method as a pattern of the temporal to simulate the precipitation series, Mann–Kendall method (Zarei and Eslamian, 2017) as a factor of the slope variability of precipitation at the significance level (Deng et al., 2017) and as a type of rainfall variability pattern. In the present study, the precipitation series were assessed to detect the data series quality aspects, including: (1) homogeneity over precipitation data (Javari, 2016; Santos and Fragoso, 2013), (2) checking temporally-spatially distribution (Ding, 2017; Javari, 2017b) of precipitation, and (3) long-term reconstruction of the precipitation series based on simulated data by using geostatistical (kriging) methods (Diodato and Ceccarelli, 2005; Ishida and Kavvas, 2017). After detection of data series quality aspects, the precipitation were evaluated for normality of the precipitation series using statistical tests (parametric and non-parametric tests).
To evaluate the homogeneity of the precipitation series (Javari, 2016), the Standard Normal Homogeneity test, Alexanderson’s SNHT test (Alexandersson, 1986) and the Pettitt-Whitney-Mann test (PWM) (Pettitt, 1979) were used at 5% significant level (Javari, 2017a). Finally, for each station series, trend values were analyzed using Mann - Kendall method and to analyze the precipitation spatial variability, geostatistical methods (Kriging method) were used. The major aims of this study are: (1) to analyze precipitation spatial variability across Iran using the statistical tests; (2) to predict the precipitation trend in Iran using the trend tests; (3) to detect and predict the variability patterns of precipitation using Kriging models; and (4) to forecast the spatial variability patterns of precipitation. The findings of this paper could be used, for the management of water resource and environmental planning in Iran. This study provides an extensive review of precipitation spatial variability at the region level and may help climatologists and environmental planners. Thus, the purpose of this study is to predict the spatial variability of precipitation of this region.
MATERIALS AND METHODS
Study area and data used
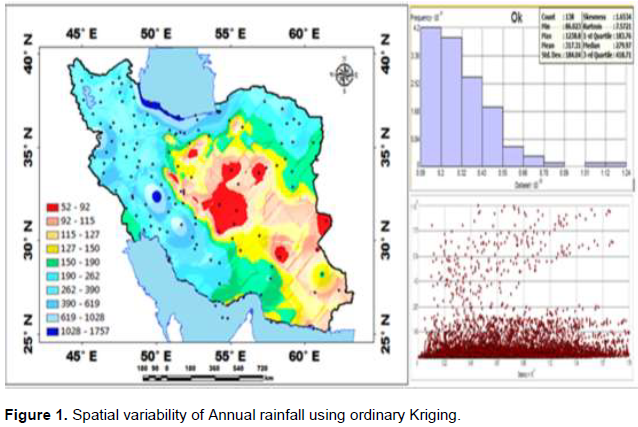
Iran, situated in the southwest of Asia, ranges from 25° 3’ to 39° 47’ N and from 44° 5’ to 63° 18’ E. The chosen variables were obtained from meteorological organization and included the monthly, seasonal and annual information of 140 stations in Iran for the period of 1975 to 2014 (Figure 1). The rainfall data used in this study comprise monthly, seasonal and annual series provided by the Iran Meteorological Organization. In addition, all the observed precipitation data were subject to strict quality control obtained from http://www.irimo.ir. Precipitation series quality control is the various tests; however, since tests are parametric and non-parametric tests, they are strong against outliers.
Methods
In this study, three types of patterns, that is, spatial and trend models with downward and upward components as spatial-temporal patterns are estimated. The following steps represent a spatial-trend model which consists of several stages and various parameters of measurement model: RMSE and R2 control how much validating of measurement model is imposed in each iteration. The spatial-trend model includes the following steps.
Normality measurement methods
In this study, normality was analyzed as temporal-spatial normality. The temporal normality of the precipitation series was tested by using the Kolmogorov-Smirnov and Chi-Squares tests. The spatial normality of the precipitation series was tested by using the exploratory spatial data analysis (ESDA) tools (measures of location, spread and shape) in the ArcGIS. There are two ways to check for normality of residual and is normally carried out through graphical and numerical means. These tests are used to test the normality of the residuals. The detail mathematical basis of these normality test statistics is extensive and is available subsequently.
Application of tests: To study the decision to use spatial-trend models, depending on the nature of precipitation in the stations, two approaches were suggested: first, the parametric tests, use of spatial-trend forecasting. Secondly, non-parametric tests, use of spatial-trend forecasting. In addition, the assessment methods following the order for the analyses; namely, (1) the initial analysis of descriptive statistics of point annual precipitation series was estimated for each station in the period of 1975 to 2014, (2) series are tested for data quality, (3) series are tested by MK test and Sen Slope estimator test are used to detect the direction and magnitude of a trend, (4) root mean square error (RMSE), and geostatistcal tools to predict the spatial variability applied. Kendall’s Tau test and runs test were used as non-parametric tests and t test as parametric tests to explore precipitation spatial-trend variations patterns. Model selection criteria were used in this study. Hence, root mean square error (RMSE) and coefficient of determination (R2) were considered. Hence, the results in R2 to additive model equal 0.883 and have an acceptable condition and the mentioned constructs of research have a suitable diagnostic validity.
The spatial trend analyzing of monthly rainfall
Spatial trend method is the based linear model and generally used by predicted point layer for the first order data to detect spatial variability of precipitation series. The various geostatistical interpolation types can be obtained from the linear model by applying the generalized least-squares estimation of the expected values. The type of Kriging method depends on the model assumed for the expected values. Kriging methods depend on mathematical and statistical models. The geostatistcal analysis offers several types of Kriging, which are suitable for different types of data and have different underlying assumptions: Ordinary, Simple and Universal. In addition, to investigate the precipitation spatial variability, variogram should be used to predict the spatial characteristics of the precipitation series. The cross-variogram was utilized to identify the spatial relationship of two precipitation series.
RESULTS AND DISCUSSION
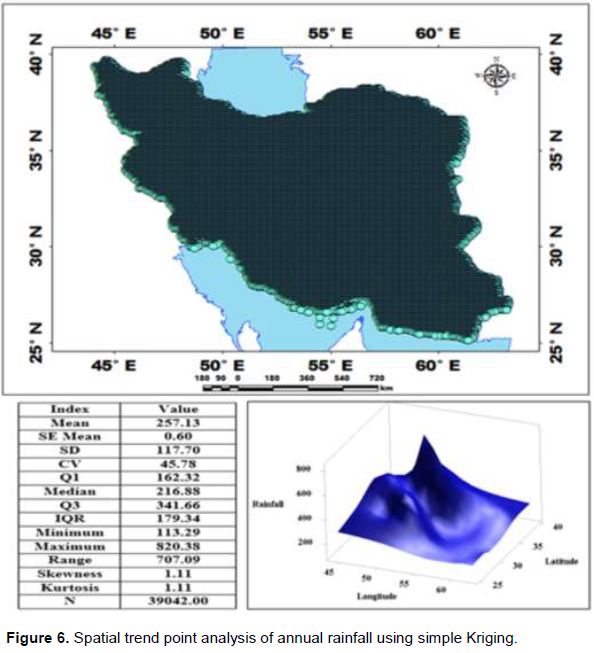
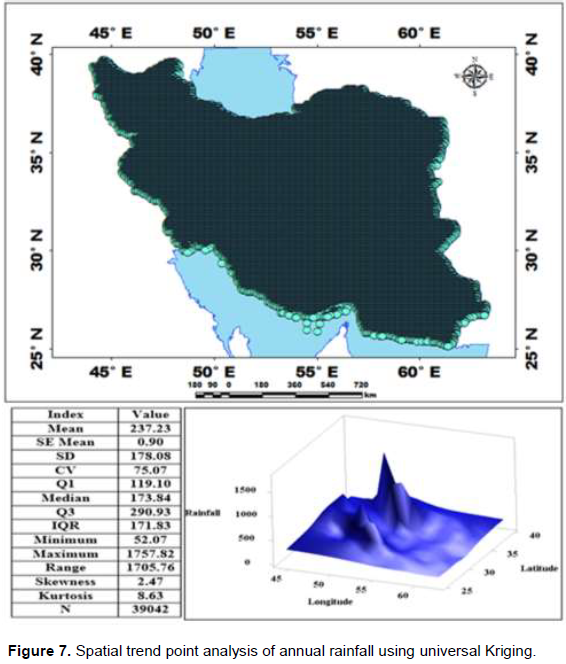
The spatial point pattern of the precipitation series is extracted from Kriging models (ordinary, simple and universal). The distribution of point pattern (39042 points) on annual precipitation using OK is presented in Figure 2, which shows a mean of 237.2 mm, with a minimum of 52.06 mm, with a maximum of 1757.8 mm with a standard deviation of 178.09 mm and a variations coefficient of 75.07% in the precipitation using OK across Iran’, however, it must be taken into account that the precipitation was not equally concentrated in the latitudes and longitudes. Figure 2 shows result of spatial variability of annual precipitation using the OK methods. The spatial variability of annual rainfall patterns was more irregular with distribution of point patterns by OK. The most possible variability in the annual precipitation was in the Caspian Sea. This was also evident from the distribution of point patterns of 10 regions. Figure 3 demonstrated that no important spatial trend was observed using trend Tools in ArcGIS in annual precipitation data over the entire points series. The most possible distribution of rainfall trend pattern over entire points series was confirmed by monthly precipitation in Iran. The distribution of rainfall point pattern by using SK shows the mean of 257.13 mm, with a minimum of 113.29 mm, with a maximum of 820.38 mm, and with a standard deviation of 117.7 mm and with a variations coefficient of 45.78% in the precipitation using SK across Iran’; however, it must be taken into account that the precipitation was lower ranged in the latitudes and longitudes (Figure 3). Figure 4 shows the spatial trend variability analysis of precipitation series on annual series for entire time period (1975 to 2014) using UK. The universal kriging (UK) changes for the annual precipitation from north and northwestern to central parts and from west to east showing a variability decreasing slope in Iran. The distribution of point pattern (39042 points) on annual precipitation using UK is presented in Figure 4, which shows a mean of 237.23 mm, with a minimum of 52.07 mm, with a maximum of 1757.82 mm, and with a standard deviation of 178.08 mm and with a variations coefficient of 75.07% in the precipitation using UK across Iran’; however, it must be taken into account that the precipitation was similar to OK in the latitudes and longitudes. The rainfall points analysis results showed that the average annual precipitation increased from 35 to 39° N latitude and from 45 to 50° E longitude in the three models. In this study, the temporal trend and trend slope was investigated by using the Mann-Kendall (MK) and Sen.’s slope estimator, respectively. However, the patterns of precipitation series were evaluated through the trend spatial tools (TST) by using the ordinary Kriging. The results of spatial statistical analysis for point series using ordinary Kriging (OK) and point latitude and longitude distribution is as shown in Figure 5. Figure 5 shows the increased variability of the trends in annual over the 35 to 39° N latitude and from 45 to 50 ° E longitude. Figure 5 demonstrates the annual series estimated by the TST method for each station over the time period of 1975-2014. Figure 5 shows a decreasing spatial trend in the annual precipitation with a different trend slope range from north to south and a regular and steady spatial pattern from west to east (52 to 1757 mm) by using the OK in Iran. Furthermore, the results showed that northwest than central and southeast parts, revealed two spatial variability patterns with a maximum of 202.76 mm (southern parts) in the annual precipitation series with a maximum increase of 1394.5 mm (northern parts); while two regions, presented different spatial variability patterns, with a range of 1312 mm in Iran.
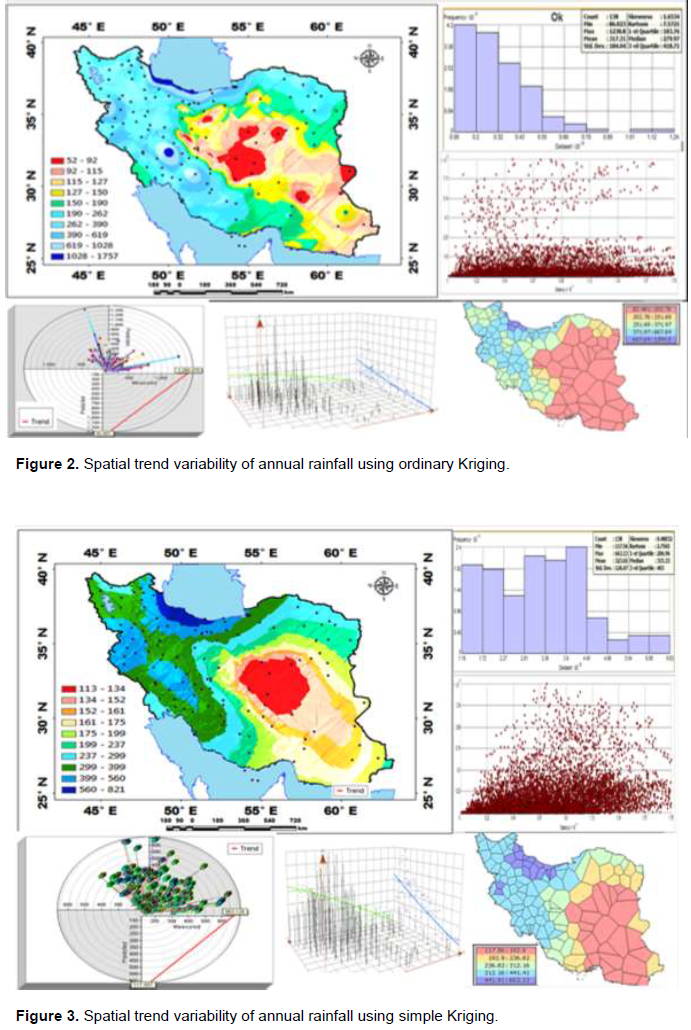
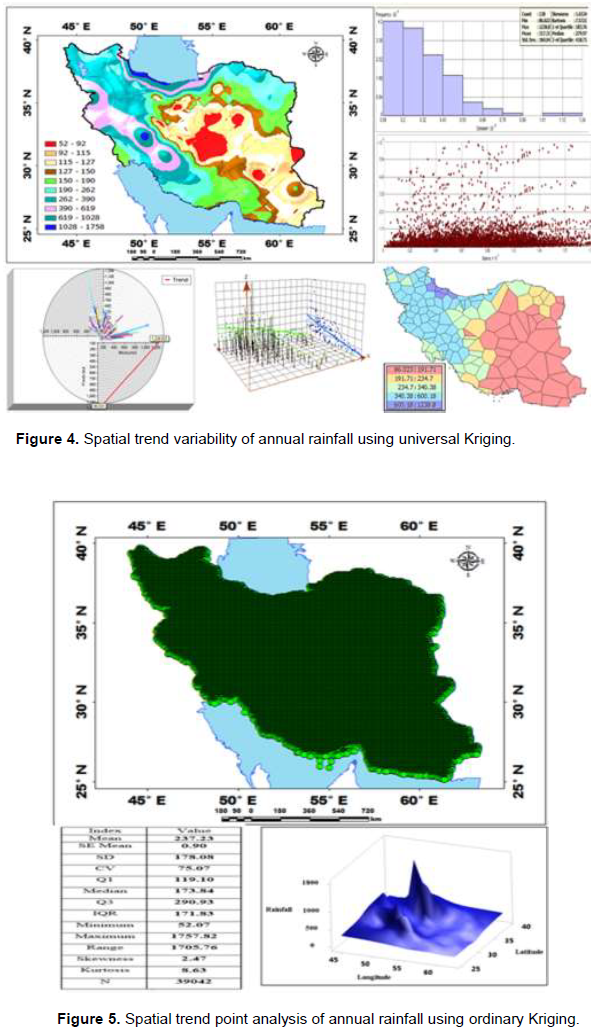
Figure 6 showed a decreasing spatial trend in the annual precipitation with a different trend slope range from northwest to southeast and a regular spatial pattern from west to east (113 to 821 mm) by using the SK in Iran. Furthermore, the results showed that northwest than southeast parts, revealed two spatial variability patterns with a maximum of 192.9 mm (southern parts) in the annual precipitation series with a maximum increase of 663.1 mm (northern parts); while two regions, presented discrete spatial variability patterns, with a range of 708 mm in Iran. The maximum rise in annual precipitation variability was (820.38 mm) monitored by minimum (113.29 mm) precipitation series. The precipitation spatial variability range (707.09 mm) displayed more increase in precipitation than seasonal precipitation (Figure 6) using SK. Figure 7 shows a decreasing spatial trend in the annual precipitation with a different trend slope range from north to south and a regular spatial pattern from west to east (52 to 1758 mm) by using the UK similar to the OK pattern in Iran. The maximum growth in annual precipitation variability was (1757.82 mm) observed by minimum (52.07 mm) precipitation series. The precipitation spatial variability range (1705.76 mm) displayed more spread in precipitation than SK (Figure 7) using UK. Furthermore, the results showed that northwest than central and southeast parts, revealed two spatial variability patterns with a maximum of 191.71 mm (southern parts) in the annual precipitation series with a maximum increase of 1238.8 mm (northern parts); while two regions, presented different spatial variability patterns and similar to OK pattern, with a range of 1152.8 mm in Iran. However, the spatial variations of the trends in annual rainfall were important using the Kriging and a trend interpolation technique. Kriging and trend technique results showed decreasing trends on an annual scale in most of the west and western north of Iran and no-trend in east and eastern north in Iran. In addition, three orders magnitude of the significant trend (lowest, average and upper) of monthly rainfall varied from -2.176 to 1.4847 mm/month for January. The average slope of trends in rainfall for January showed significant decreasing trends (-0.347) on a monthly scale in most parts of Iran. The spatial variations of the trends on a monthly scale on January rainfall were definite using the Kriging and a trend interpolation technique. Kriging and trend technique results showed decreasing trends on a monthly scale in most of the west and western north of Iran in January and increasing trends in the center parts in Iran and no-trend in east and eastern north in Iran. The magnitude of the significant trend of monthly rainfall varied from -1.43 to 0.77 mm/month for February. The average slope of trends in rainfall for February showed significant decreasing trends (-0.255) on a monthly scale in most parts of Iran. The spatial variations of the trends on a monthly scale on February rainfall were definite using the Kriging and a trend interpolation technique. Kriging and trend technique results showed decreasing trend on a monthly scale in most of the western north of Iran in February and increasing trends in the center parts in Iran and no-trend in eastern south in Iran. The magnitude of the significant trend of monthly rainfall varied from -2.098 to 0.523 mm/month for March. The average slope of trends in rainfall for March showed significant decreasing trends (-0.758) on a monthly scale in most parts of Iran.
The spatial variations of the trends on a monthly scale on March rainfall were definite using the Kriging and a trend interpolation technique. Kriging and trend technique results showed no-trend pattern on a monthly scale in most of the west, Iran in March and increasing trend pattern in the center parts in Iran and decreasing trend pattern in east in Iran. The magnitude of the significant trend of monthly rainfall varied from -0.98 to 1.057 mm/month for April. The average slope of trends in rainfall for April showed significant increasing trends (0.818) on a monthly scale in most parts of Iran. The spatial variations of the trends on a monthly scale in April rainfall were definite using the Kriging and a trend interpolation technique.
Analytical results showed decreasing pattern on a monthly scale in most of the west, Iran in April and increasing trend pattern in the center parts in Iran and no-trend pattern in east in Iran. The magnitude of the significant trend of monthly rainfall varied from -0.633 to 0.471 mm/month for May. The average slope of trends in rainfall for May showed significant decreasing trends (-0.607) on a monthly scale in most parts of Iran. The spatial variations of the trends on a monthly scale on May rainfall were definite using the Kriging and a trend interpolation technique. Kriging and trend technique results showed that decreasing pattern on a monthly scale in most of the west and western north of Iran in May and increasing trend pattern in the center parts in Iran and no-trend pattern in east and eastern north in Iran. The magnitude of the significant trend of monthly rainfall varied from -0.506 to 0.293 mm/month for October. The average slope of trends in rainfall for October showed significant decreasing trends (-0.079) on a monthly scale in most parts of Iran. The spatial variations of the trends on a monthly scale on October rainfall were definite using the Kriging and a trend interpolation technique. Trend analysis results showed no-trend pattern on a monthly scale in most of the west and western north of Iran in October and increasing trend pattern in the center parts in Iran and decreasing trend pattern in east and eastern north in Iran. The magnitude of the significant trend of monthly rainfall varied from -0.757 to 1.064 mm/month for November. The average slope of trends in rainfall for November showed significant increasing trends (0.154) on a monthly scale in most parts of Iran.
The spatial variations of the trends on a monthly scale on November rainfall were definite using the Kriging and a trend interpolation technique. Trend analysis results showed decreasing (downward) pattern on a monthly scale in most of the west and western north of Iran in November and increasing (upward) trend pattern in the center parts in Iran and no-trend pattern in east and eastern north in Iran. The magnitude of the significant trend of monthly rainfall varied from -1.522 to 1.147 mm/month for December. The average slope of trends in rainfall for December showed significant decreasing trends (-0.199) on a monthly scale in most parts of Iran. The spatial variations of the trends on a monthly scale on December rainfall were definite using the Kriging and a trend interpolation technique. Trend analysis results showed no-trend pattern on a monthly scale in most of the west and western south of Iran in December and increasing (upward) trend pattern in the center parts in Iran and decreasing (downward) pattern in east and eastern north in Iran. The magnitude of the significant trend of rainfall varied from -6.059 to 2.474 mm/year for annual rainfall. The average slope of trends in annual rainfall showed significant decreasing trends (-1.526) on a monthly scale in most parts of Iran. The spatial variations of the trends in annual rainfall were definite using the Kriging and a trend interpolation technique. Trend analysis results showed that no-trend pattern on a year scale in most of the west and western north of Iran in annual and increasing (upward) trends, pattern in the center parts in Iran and decreasing (downward) pattern in east and eastern north in Iran.
CONCLUSIONS
This study showed a trend analysis and its spatial variability of precipitation series in Iran. This trend analysis and its spatial variability occur at various patterns and levels of intensity. Variogram analysis revealed that precipitation series particularly, spatial patterns are important to predict the spatial variability in Iran. Among the precipitation series’ patterns studied, winter and autumn precipitation series showed spatial variability indicating the regularity of factors monitoring the trended precipitation spatial variability. Spatial patterns of precipitation series show an overall decreasing trend from the north and northwest to the south and southeast. The precipitation variability is larger in the various regions; the monthly, seasonal and annual precipitation have different spatial-temporal patterns.
CONFLICT OF INTERESTS
The authors has not declared any conflict of interests.
ACKNOWLEDGEMENT
The authors thank PayameNoor Management and Research Committee of PayameNoor University.
REFERENCES
|
Ahmad I, Tang D, Wang T, Wang M, Wagan B (2015). Precipitation Trends over Time Using Mann-Kendall and Spearman’s rho Tests in Swat River Basin, Pakistan. Adv. Meteorol. P 15. doi:10.1155/2015/431860 |
|
|
Alexandersson H (1986). A homogeneity test applied to precipitation data. J. Climatol. 6(6):661-675. |
|
|
Cecinati F, Rico-Ramirez MA, Heuvelink GBM, Han D (2017). Representing radar rainfall uncertainty with ensembles based on a time-variant geostatistical error modelling approach. J. Hydrol. 548:391-405. |
|
|
Deng S, Li M, Sun H, Chen Y, Qu L, Zhang X (2017). Exploring temporal and spatial variability of precipitation of Weizhou Island, South China Sea. J. Hydrol. Regional Stud. 9:183-198. |
|
|
Ding Y (2017). Sea-Level Rise and Hazardous Storms: Impact Assessment on Coasts and Estuaries. In W.-Y. Chen, T. Suzuki, & M. Lackner (Eds.), Handbook of Climate Change Mitigation and Adaptation. Cham: Springer International Publishing. pp. 621-656 |
|
|
Diodato N, Ceccarelli M (2005). Interpolation processes using multivariate geostatistics for mapping of climatological precipitation mean in the Sannio Mountains (southern Italy). Earth Surf. Process. Landforms 30(3):259-268. |
|
|
Guan Y, Zheng F, Zhang X, Wang B (2017). Trends and variability of daily precipitation and extremes during 1960-2012 in the Yangtze River Basin, China. Int. J. Climatol. 37(3):1282-1298. |
|
|
Ishida K, Kavvas ML (2017). Climate change analysis on historical watershed-scale precipitation by means of long-term dynamical downscaling. Hydrol. Process. 31(1):35-50. |
|
|
Javari M (2016). Trend and Homogeneity Analysis of Precipitation in Iran. Climate 4(3):44. |
|
|
Javari M (2017a). Assessment of Temperature and Elevation Controls on Spatial Variability of Rainfall in Iran. Atmosphere 8(3):45. |
|
|
Javari M (2017b). Spatial variability of rainfall trends in Iran. Arab. J. Geosci. 10(4):78. |
|
|
Kutiel H, TürkeÅŸ M (2017). Spatial and temporal variability of dryness characteristics in Turkey. Int. J. Climatol. |
|
|
Pettitt A (1979). A non-parametric approach to the change-point problem. Appl. Stat. pp. 126-135. |
|
|
Santos M, Fragoso M (2013). Precipitation variability in Northern Portugal: Data homogeneity assessment and trends in extreme precipitation indices. Atmos. Res. 131:34-45. |
|
|
Sung JH, Chung E-S, Kim Y, Lee B-R (2017). Meteorological hazard assessment based on trends and abrupt changes in rainfall characteristics on the Korean peninsula. Theor. Appl. Climatol. 127(1):305-326. |
|
|
Tabari H, Somee BS, Zadeh MR (2011). Testing for long-term trends in climatic variables in Iran. Atmos. Res. 100(1):132-140. |
|
|
Zarei AR, Eslamian S (2017). Trend assessment of precipitation and drought index (SPI) using parametric and non-parametric trend analysis methods (case study: arid regions of southern Iran). Int. J. Hydrol. Sci. Technol. 7(1):12-38. |
|
|
Zeleke TT, Damtie B (2017). Temporal and Spatial Climate Variability and Trends Over Abay (Blue Nile) River Basin. In K. Stave, G. Goshu, & S. Aynalem (Eds.), Social and Ecological System Dynamics: Characteristics, Trends, and Integration in the Lake Tana Basin, Ethiopia. Cham: Springer International Publishing. pp. 59-75. |
|
|
Zilli MT, Carvalho LMV, Liebmann B, Silva Dias MA (2017). A comprehensive analysis of trends in extreme precipitation over southeastern coast of Brazil. Intl. J. Climatol. 37(5):2269-2279. |
|
Copyright © 2024 Author(s) retain the copyright of this article.
This article is published under the terms of the Creative Commons Attribution License 4.0


