ABSTRACT
Possible cause of gravity anomalies in parts of the Niger Delta Basin, Nigeria was investigated using three methods of gravity data interpretation; Euler-3D deconvolution, source parameter imaging (SPI) and forward and inverse modeling. The estimated depths from the interpretation techniques used show much similarity. Quantitatively, the results obtained from the SPI method showed a minimum to maximum depth of 1264.11 to 9354.57 m to the anomalous body. The results obtained from Euler-3D deconvolution method showed a depth range of 2136.40 to 9167.57 m to the anomalous body using a structural index of 3. The results from the forward and inverse modeling revealed a depth range of 793 to 7586 m to the anomalous body. Qualitatively, the gravity signatures in profiles 1, 2 and 3 possibly depict antiformal geologic features whereas the gravity signatures in profiles 4 and 5 possibly depict synformal features/basin geometries.
Key words: Gravity data, Niger Delta, source parameter imaging, Euler deconvolution, forward and inverse modeling, anomalous body.
Gravity method is one of the oldest geophysical survey methods used by geophysicists. It was the first geophysical technique to be used in oil and gas exploration and despite being eclipsed by seismology, it has continued to be an important method in a number of exploration areas. Like magnetics, radioactivity and some electrical techniques, gravity method is a natural-source method.
Local variations in densities of rocks near the surface cause minute changes in the gravity field. Gravity method is often regarded as a potential field method. Gravity is an inherent property of mass and the gravity effects of local masses are very small compared with the effect of the background field of the earth as a whole.
In the mining industry, gravity method is still widely used as an exploration tool to map subsurface geology and estimate ore reserves for some massive ore bodies (Biswas and Sharma, 2016; Mandal et al., 2015; Biswas et al., 2014a; b; Mandal et al., 2013). Gravity method is sometimes applied to specialized shallow applications including archaeology (Lakshmanan and Montlucon, 1987; Deletie et al., 1988; Brissaud et al., 1989), weapons inspection (Won et al., 2004) and detection of faults and paleo-channels in hydrologic investigations (Hinze, 1991; Grauch and John, 2002).
Gravity prospecting involves measurements of variations in the gravitational field of the earth. The variation arises from the differences in density between subsurface rocks. The causative body has a different density from the surrounding bedrocks or sediments and represents a subsurface zone of anomalous mass responsible for gravity anomalies. In as much as this method involves changes in the force of gravity at the surface due to lateral density changes in the subsurface, it is actually the difference in acceleration due to gravity that is being measured. The strength of the gravitational field is directly proportional to the mass and hence to the density of the subsurface features.
Interpretation of gravity data can be carried out both quantitatively and qualitatively. It is aimed at mapping the surface and subsurface regional structures (intrusive bodies, syncline structures, anticline structures, contacts, faults, basement rocks, mineralization and thickness of sedimentations or depth to anomalous bodies). Qualitative interpretation involves the description of the survey results and the explanation of the major features revealed by a survey in terms of the types of likely geological formations and structures (intrusive bodies, syncline structures, anticline structures, contacts, faults, basement rocks and mineralization).
Quantitative interpretation involves making numerical estimates of the depth and dimensions of the sources of anomalies and this often takes the form of modeling of sources which could, in theory, replicate the anomalies recorded in the survey (Biswas et al., 2017; Singh and Biswas, 2016; Biswas, 2016; Biswas, 2015). Several methods of interpretation in gravity prospecting include: the Euler-3D method, local wave number method, analytical signal method, source parameter imaging (SPI) method, forward and inverse modeling method (Biswas, 2016; Biswas, 2015). The beginning stages of gravity data interpretation generally involve the application of mathematical filters to observed data after ensuring that the gravity data has been reduced (corrected). The specific goals of these filters vary, depending on the researcher’s interest. The general purpose is to enhance anomalies of interest and/or to gain some preliminary
information on location of the source anomalies.
The purpose of this study is to investigate the possible causes of gravity anomalies in parts of the Niger Delta Basin, Nigeria, by employing three methods of gravity interpretation. This will include the determination of; the depth to anomalous bodies, the isolated/prominent shallow depth anomalous bodies, and the possible type of geophysical feature/structure describing the anomalous bodies.
Location and geology of the study area
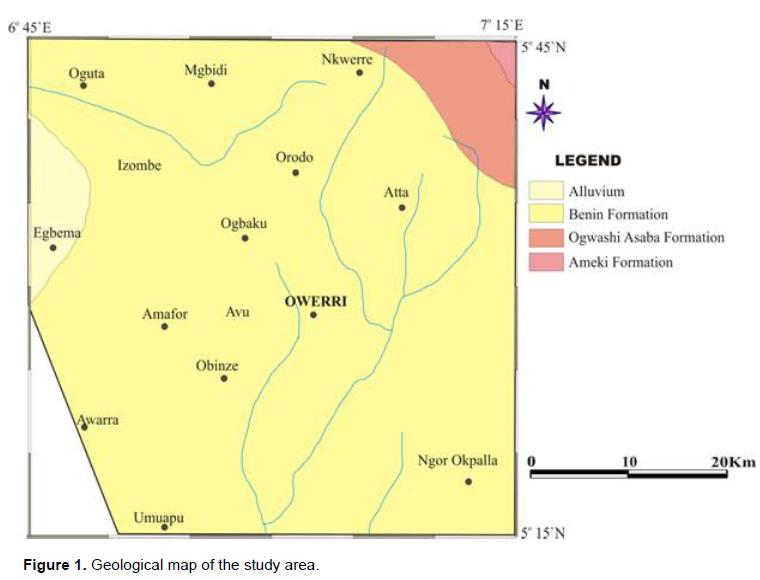
The study area which lies between latitudes 5°15’N and 5°45’N and longitudes 6°45’E and 7°15’E, falls within the Niger Delta Basin (sedimentary Basins) of Nigeria. It consists of three geologic formations. These formations include: Benin formation, Ogwashi-Asaba formation and Ameki Formation (Figure 1).
Stratigraphically, the Benin formation (Pliocene) is overlain by a lateritic overburden and underlain by the Ogwashi-Asaba formation which is in turn underlain by the Ameki formation of Eocene to Oligocene age. The Ameki formation overlies the impervious Imo shale group characterized by lateral and vertical variations in lithology. The Imo shale of Paleocene age is underlain in succession by Nsukka formation, Ajali Sandstones and Nkporo Shales of the Anambra Basin of Southern Nigeria (Reyment, 1965; Uma, 1989; Mbonu et al., 1990; Amajor, 2005; Nwankwo et al., 2011) (Figure 1).
Source of data
The land gravity data used in this work was obtained from Bureau Gravimetrique Internationale (BGI). The information contained in the data include longitudes, latitudes, altitudes, observed gravity values, free-air corrected values and Bouguer gravity values. The Bouguer gravity values signify that all necessary corrections have been applied to the data.
Interpretation of gravity data is aimed at mapping the subsurface regional structures. This was performed qualitatively and quantitatively. Quantitative interpretation was done by employing three methods: Euler-3D method, source parameter imaging (SPI) and forward and inverse modeling method to estimate the depths to source anomalies.
Qualitative interpretation of the gravity data was carried out by applying standard filters using the magmap module in geosoft Oasis Montaj. The early stages of interpretation exercise involve the application of mathematical filters (downward and upward continuation, derivative based filters, polynomial fitting or trend surfaces and analytical signals) to observed data.The general purpose is to enhance anomalies of interest and/or to gain some preliminary information on source location. The Bouguer anomaly contour map of the study area was produced. The residual Bouguer anomaly contour map of the study area was also produced after polynomial fitting filtering was applied to the Bouguer values. To show clearly areas of isolated anomalies with either the high or low Bouguer values, a 3D view of the residual Bouguer anomaly map was produced. For location purposes, a residual anomaly base map was also produced.
Oasis montaj software was employed in computing the SPI image and depth. SPI method made the task of interpreting gravity data significantly easier. Source parameter imaging technique (SPI) is an extension of the local wave-number method (Thurston and Smith, 1997). This method estimates the depth of source anomalies from the local wave number of the analytical signal. In 2D, the local wave number K is defined as the derivative of the phase of the analytic signal ( ) with respect to distance (Bracewell, 1965; Nabighian, 1972).
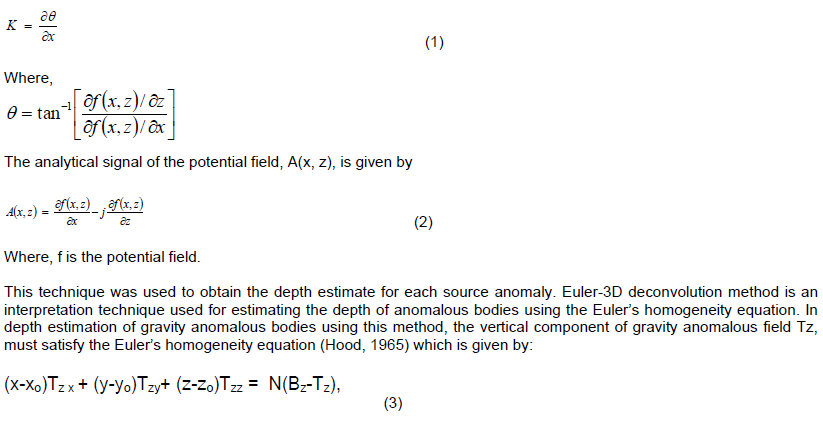
Where, Tz is the gravity anomalous field (vertical component) of a body having a homogeneous gravity field. xo, yo and zo are the unknown coordinates of the source body centres or edges to be estimated and x, y and z are the known coordinates of the observation point of the gravity and the gradients. The values Tzx, Tzy and Tzz are the measured gravity gradients along the x, y and z directions. N is the structural index, which is a measure of the rate of change with distance of a field (Thompson, 1982) and Bz is the regional value of the gravity to be estimated (Reid et al., 1990; Changyou et al., 2000). Oasis montaj software was also employed in computing the Euler-3D image and depth.
Forward and inverse modeling technique involves the comparison or fitting of the calculated field of a hypothetical source (models) with that of the observed data; the model is adjusted in order to improve the fit for a subsequent comparison or fit. Once a reasonable fit is obtained and the model results are guided by the geology of the area, certain deductions can be made. These include depth to the source anomalies, positions and dimensions of the anomalous bodies, density of the anomalous bodies and the type of geological feature/structure representing or describing the anomalous bodies
The forward and inverse modeling was employed with the aid of the potent-3D program contained in the Oasis montaj software. Interpretation of gravity data using Potent starts with observation of the image of the observed data. The first step in interpreting the observed data was to take profiles on the residual Bouguer map. In interpreting the observed data, five profiles were taken along different parts of the residual Bouguer map.
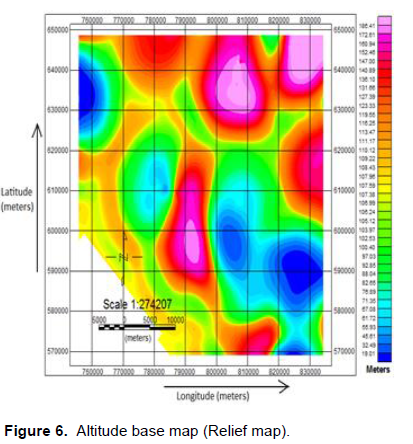
Figures 2, 3, 4 and 5 show the results of the application of the first vertical derivative, second vertical derivative, analytical signal and upward continuation, respectively to the Bouguer values. The results from filtering and the altitude values were gridded using the minimum curvature (O’connel et al., 2005) in Oasis montaj software with a grid cell size of 160 meters (Figures 2, 3, 4, 5 and 6).
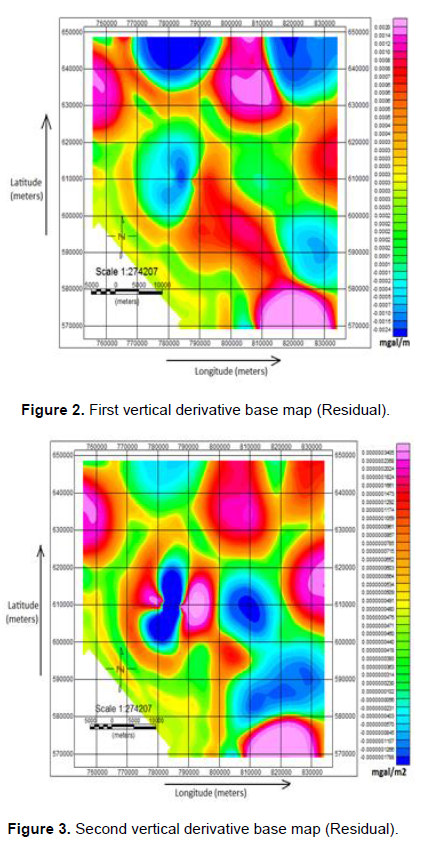
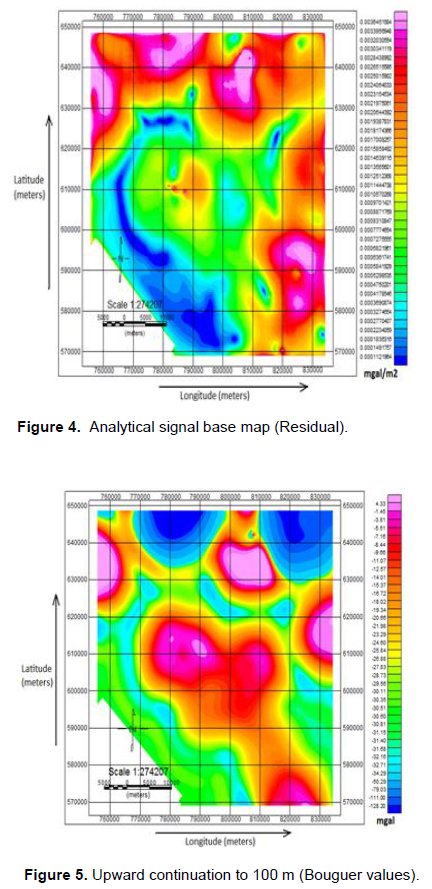
In upward continuation, gravity field data from one datum surface were mathematically projected upward to level surfaces above the original datum (Figure 5). The upward continuation achieves spatial resolution, by increasing the signal to noise ratio thereby attenuating the effect of noise. The first and second vertical derivatives filters compute the vertical rate of change in the gravity field with depth. The derivative filters (Figures 2 and 3) suppressed the effects of the long wavelengths (low frequencies). The analytical signal (quaternion) relates the vertical derivative of the gravity field to the horizontal derivative of the same gravity field and this was used to define the edges and boundaries of anomalous densities (Figure 4). Figure 6 reveals the height of each gravimeter observation site from the geoid (WGS84 terrestrial reference system). The effect of any gravity anomaly depends on the lateral variation in the density of the area.
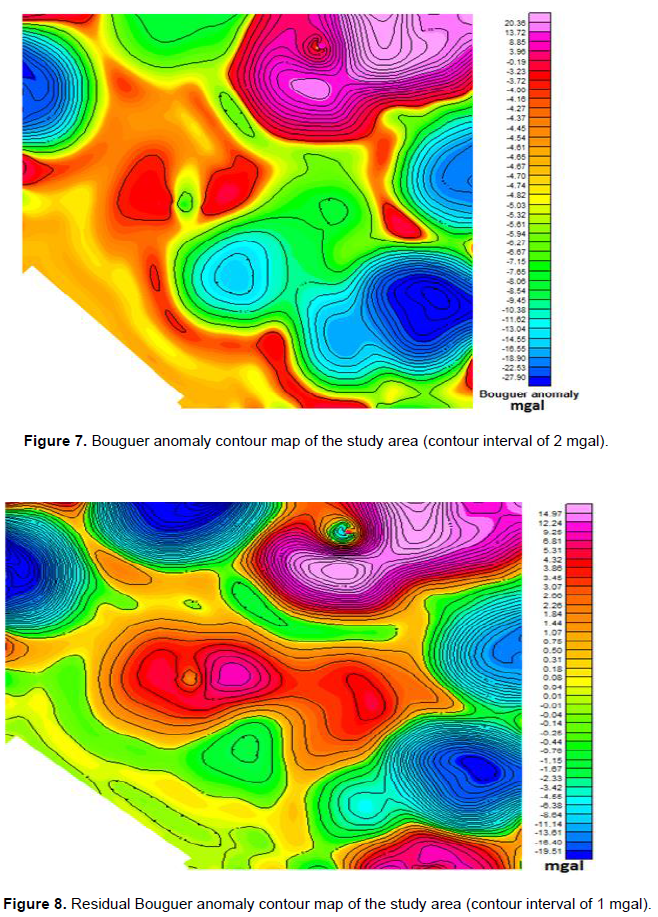
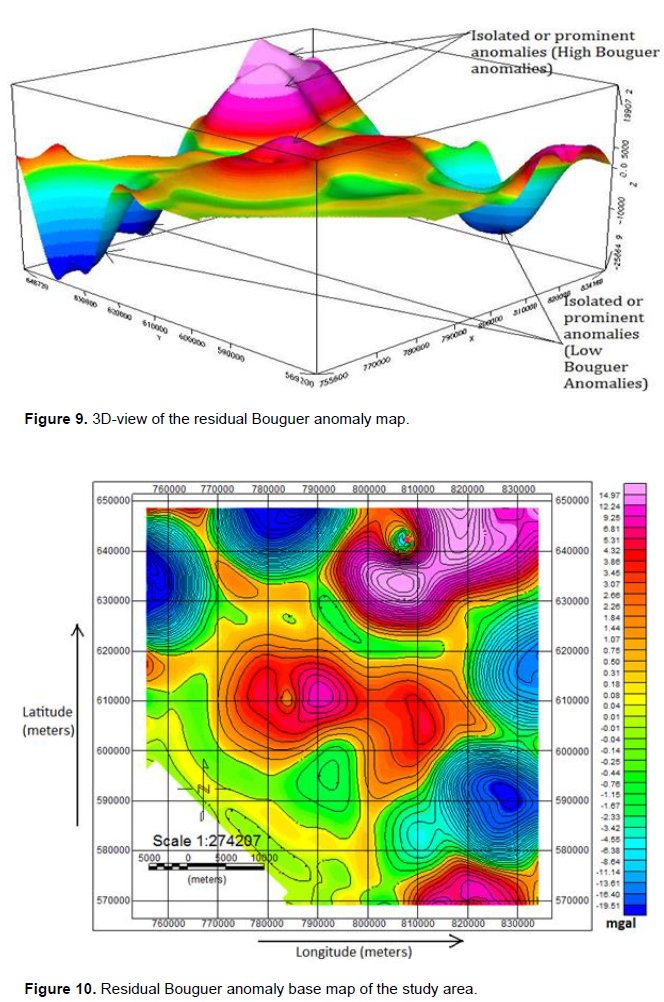
The Bouguer gravity data was gridded using a grid cell size of 160 m. The result was then contoured using the contouring option in Oasis montaj software. Figure 7 shows the Bouguer anomaly contour map with a contour interval of 2 mgal indicating a maximum of 20 mgal and a minimum of -28 mgal. The high anomaly values roughly occupy the northern and central part of the study area while the low anomaly values occupy mostly the southern part of the study area. Residual Bouguera nomaly map was also produced after a polynomial fitting. Filtering of second-order was applied to the Bouguer values to separate regional anomaly from local anomaly. The result of the filtering was contoured after gridding using a grid cell size of 160 m (Figure 8). A 3D-view diagram of the residual Bouguer anomaly map (Figure 9) was produced to show clearly areas of prominent or isolated anomalies with either high and low Bouguer values. Figure 10 shows the residual Bouguer anomaly base map of the study area where the vertical and horizontal lines represent the longitude and latitude, respectively.
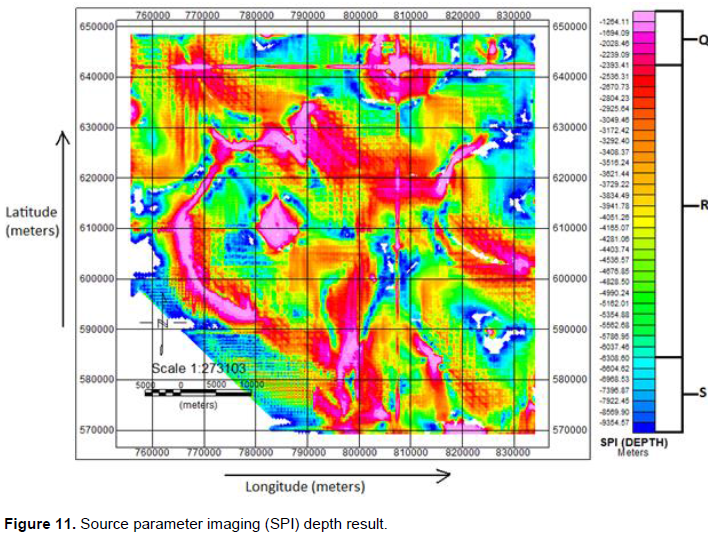
Oasis montaj software was used in computing the SPI depth distribution for the study area. The SPI grid and its legend in Figure 11 present a set of colours, indicating different depths to gravity anomalous bodies with different density contrasts. The light blue to deep blue colours at the lower end of the legend show areas of deepest lying anomalous bodies (that is the depth range ‘S’ from 6308.60 m to 9354.57 m). The light pink to dark pink colours indicates areas of shallowest depth lying anomalous bodies (that is the depth range ‘Q’ from 1264.11 m to 2393.41 m). The colours (green, yellow, orange and red) in between the pink and blue colours represent areas of less deep to shallow depth lying anomalous bodies (that is the depth range ‘R’ from 6308.60 to 2393.41 m). The negative sign attached to the values in the legend signifies depth (vertical distance below the earth’s surface).
The Euler-3D deconvolution depth result for the study area was produced using the Euler deconvolution module in the Oasis montaj software. This was done using the structural index (SI) of 3, because most of the models used in this research were sphere-like models. Sphere or compact body at a distance is normally associated with structural index of 3 (Reid, 2002). From the Euler-3D result in Figure 12, the light to dark pink colours at the upper end of the legend portray areas of shallowest depth lying gravity anomalous bodies (that is the depth range ‘T’ from 2136.40 to 4367.35 m) whereas the light to dark blue colours indicate areas of deepest seated gravity anomalous bodies (that is the depth range ‘V’ from 8182.77 to 9167.57 m). The colours (red, orange, yellow and green) in between the pink and blue colours signify areas of shallow to less deep seated gravity anomalous bodies (that is the depth range ‘U’ from 4367.35 to 8182.77 m). The negative sign attached to the values in the legend signifies depth (vertical distance below the earth’s surface) (Figure 13).
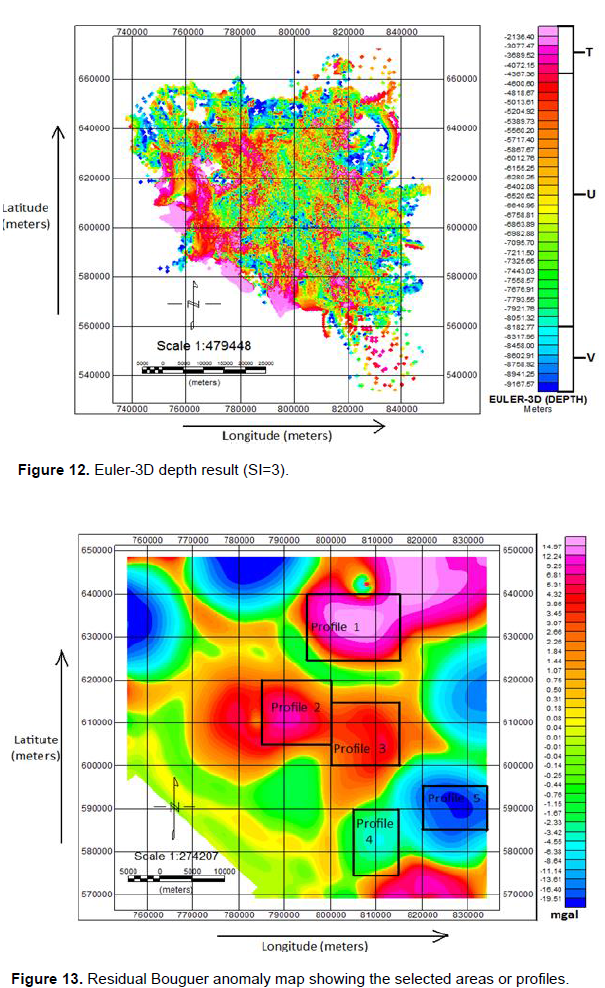
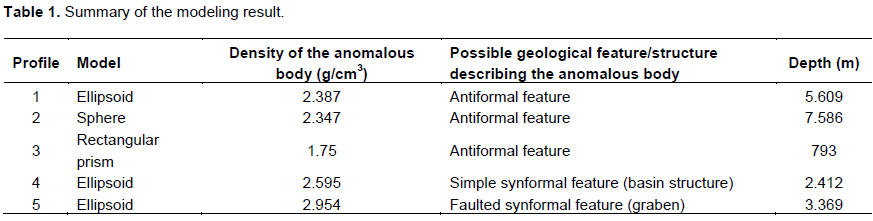
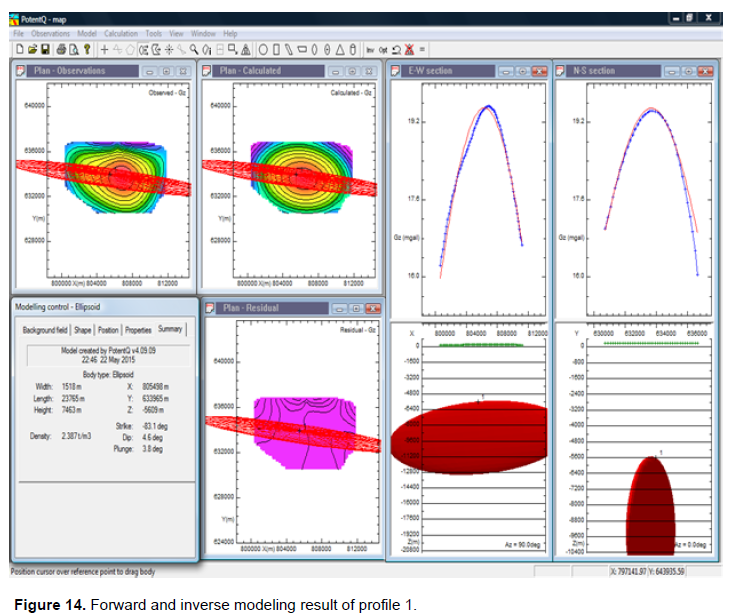
Profile 1 lies approximately between 795,000 and 815,000 m Easting and 625.000 and 640.000 m Northing on the residual Bouguer anomaly base map (Figure 13). From gravity interpretation studies (Dobrin, 1976; Carmichael, 1984; Dobrin and Savit, 1988; Corine, 1996), the gravity profile in Figure 14 possibly describes an antiformal feature. The model (ellipsoid) showed a depth of 5609 m (5.6 km) to the anomalous body. The density of the anomalous body was revealed to be 2.387 g/cm3. The gravity signature shown in Figure 14 suggests that the anomalous body is denser than the surrounding bedrocks.
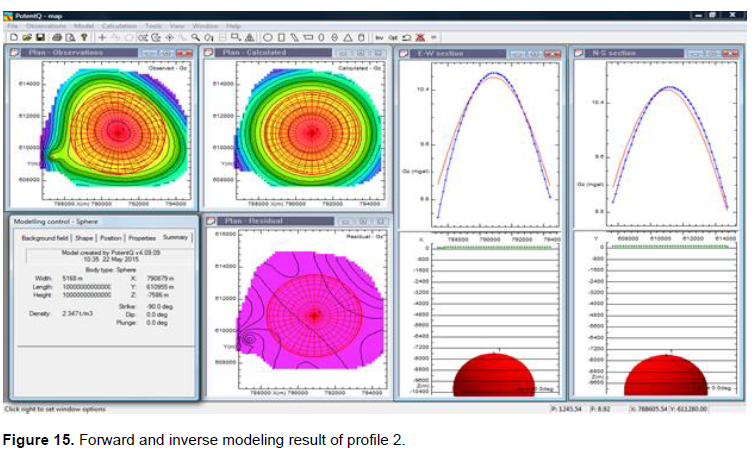
Profile 2 roughly lies between 785,000 and 800,000 m Easting and 605,000 and 620,000 m Northing on the residual Bouguer anomaly base map (Figure 13). According to these gravity interpretation studies (Dobrin, 1976; Carmichael, 1984; Dobrin and Savit, 1988; Corine, 1996), the gravity signature in profile 2 possibly describes an antiformal subsurface feature (Figure 15). The model (sphere) revealed the density of the anomalous body to be 2.347 g/cm3. The depth to the anomalous body was 7586 m (7.6 km).
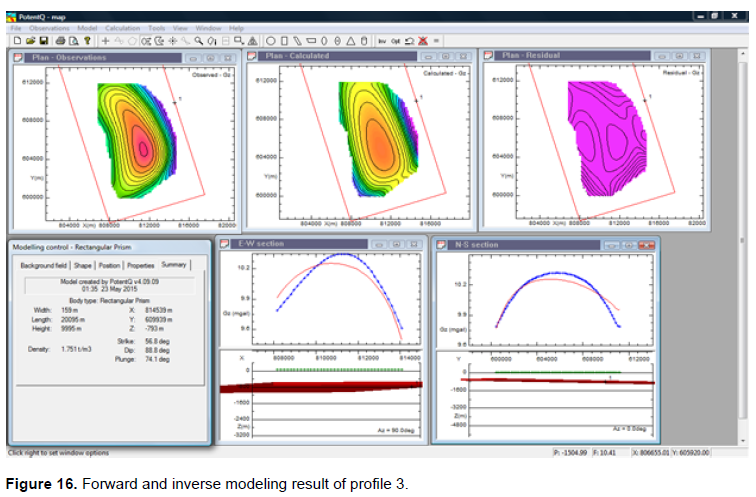
Profile 3 lies roughly between 800,000 and 815,000 m Easting and 600,000 and 615,000 m Northing on the residual Bouguer anomaly map (Figure 13). From gravity interpretation studies (Dobrin, 1976; Carmichael, 1984; Dobrin and Savit, 1988; Corine, 1996), the gravity profile in Figure 16 possibly depicts an antiformal geologic feature. The model (prism) revealed the density of the anomalous body to be 1.751 g/cm3. The depth to the anomalous body was revealed to be 793 m (0.79 km).
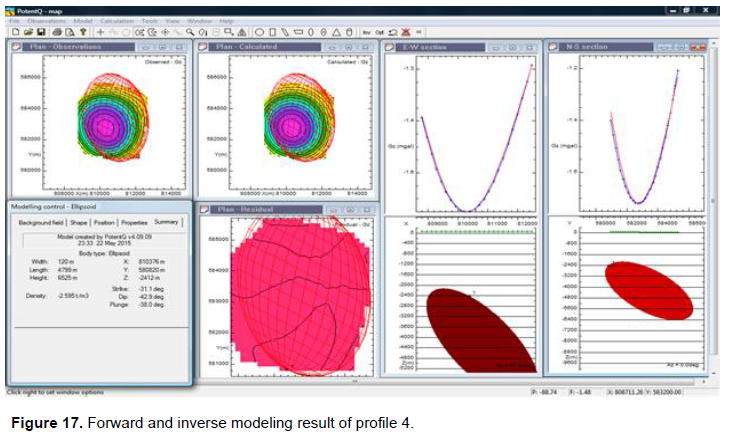
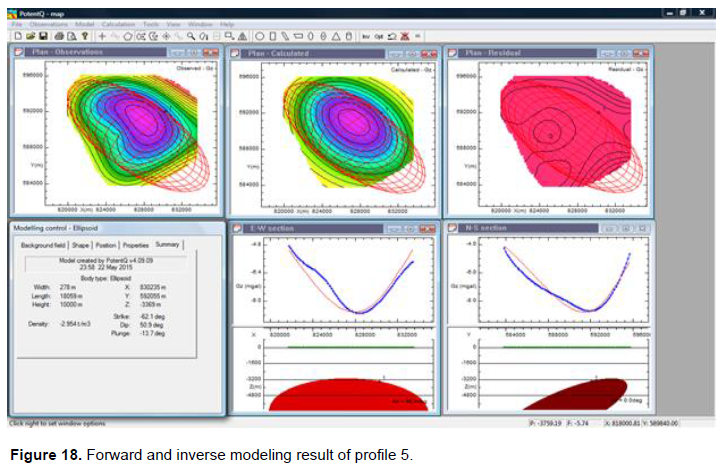
Profile 4 is located on the Southeastern part of the study area (Figure 13). It lies approximately between 805000 and 815000 m Easting and 575000 and 590000 m Northing. From gravity interpretation studies (Corine, 1996), the gravity profile in Figure 17 possibly depicts a synformal geologic feature (basin structure). The model (ellipsoid) revealed the density of the anomalous body to be 2.595 g/cm3. The depth to the anomalous body was depicted to be 2412 m (2.4 km). Profile 5 is located on the Southeastern part of the study area (Figure 13). It lies approximately between 820000 and 835000 m Easting and 585000 and 595000 m Northings.
According to these gravity interpretation studies (Dobrin, 1976; Carmichael, 1984; Corine, 1996), the gravity profile in Figure 18 possibly depicts a faulted synformal geologic feature. The model (ellipsoid) revealed the density of the anomalous body to be 2.954 g/cm3 and the depth to the anomalous body was revealed to be 3369 m (3.4 km).
The gravity signature shown by the model result suggests that the anomalous body is less dense than the surrounding bedrocks. The model result is shown in Figure 18. Table 1 is the summary of the modeling results.
Land gravity data of parts of the Niger Delta, Nigeria has been interpreted using Euler-3D deconvolution, source parameter imaging (SPI) and forward and inverse modeling techniques in order to study the possible cause of gravity anomalies in the area. Some of the results obtained from these interpretation techniques are in agreement with results obtained by some previous researchers who worked in the study area. Hospers (1965) revealed a sediment thickness of about 8 km in the Niger Delta Basin and is similar to the depth obtained in this research (the maximum depths of 9.4 km from SPI, 9.2 km from Euler 3D deconvolution and 7.6 km from forward and inverse modeling).
Jacques et al. (2003) revealed major shale structures and faults within the Niger Delta Basin which were also revealed in this study. Ali et al. (2012) also revealed a depth to basement range between 0 to 10.7 km in the lower Niger Delta Basin which is similar to the depth range obtained in this research (1.3 to 9.4 km for SPI, 2.1 to 9.2 km for Euler 3D deconvolution and 0.8 to 7.6 km for forward and inverse modeling). Ezekiel et al. (2013) revealed grabens and faults in Njaba sub-basin in Imo state and such features were also revealed by this research.
Quantitatively, the results obtained from the SPI method showed a minimum to maximum depth of 1264.11 to 9354.57 m to the anomalous bodies. The results obtained from Euler-3D deconvolution showed a depth range of 2136.40 to 9167.57 m to the anomalous body using a structural index of 3. These results from the forward and inverse modeling as shown in Table 1 indicate a depth range of 793 to 7586 m. The estimated depths from the interpretation techniques employed fairly agree.
Qualitatively, the gravity signatures in profiles 1, 2 and 3 possibly depict antiformal geologic features whereas the gravity signatures in profiles 4 and 5 possibly suggest synformal features.
The authors have not declared any conflict of interests.
REFERENCES
|
Ali I, Olatunji S, Nwankwo LI, Akoshile CO, Johnson LM, Edino F (2012). Geomagnetic modeling of potential hydrocarbon traps in the lower Niger Delta. Arch. Appl. Sci. Res. 4(2):863-874.
|
|
|
|
Amajor LC (2005). Aquifers in the Benin formation (Miocene-Recent), eastern Niger Delta; lithostratigraphy, hydraulics and water quality. Environ. Geol. 1:85-101.
|
|
|
|
|
Biswas A, Parija MP, Kumar S (2017). Global nonlinear optimization for the interpretation of source parameters from total gradient of gravity and magnetic anomalies caused by thin dyke. Ann. Geophys. 60(2):G0218, 1-17.
|
|
|
|
|
Biswas A (2016). Interpretation of gravity and magnetic anomaly over thin sheet-type structure using very fast simulated annealing global optimization technique. Model. Earth Syst. Environ. 2(1):30.
Crossref
|
|
|
|
|
Biswas A, Sharma SP (2016). Integrated geophysical studies to elicit the structure associated with Uranium mineralization around South Purulia Shear Zone, India: A Review. Ore Geol. Rev. 72:1307–1326.
Crossref
|
|
|
|
|
Biswas A (2015). Interpretation of residual gravity anomaly caused by a simple shaped body using very fast simulated annealing global optimization. Geosci. Front. 6(6):875-893.
Crossref
|
|
|
|
|
Biswas A, Mandal A, Sharma SP, Mohanty WK (2014a). Delineation of subsurface structure using self-potential, gravity and resistivity surveys from South Purulia Shear Zone, India: Implication to uranium mineralization. Interpretation 2(2):T103-T110.
Crossref
|
|
|
|
|
Biswas A, Mandal A, Sharma SP, Mohanty WK (2014b). Integrating apparent conductance in resistivity sounding to constrain 2D Gravity modeling for subsurface structure associated with uranium mineralization across South Purulia Shear Zone. Int. J. Geophys. Article ID 691521:1-8.
Crossref
|
|
|
|
|
Bracewell RM (1965). The Fourier transformation and its applications. McGraw-Hill, Inc., New York.
|
|
|
|
|
Brissaud P, Deletie P, Lakshmanan J, Lemoine Y, Montlucon J (1989). Site of Tanis (Egypt): Geophysical investigations and their archaeological follow-up. SEG Expanded Abstracts 8:292.
Crossref
|
|
|
|
|
Carmichael RS (1984). CRC handbook of physical properties of rocks. CRC Press, Florida
|
|
|
|
|
Changyou Z, Martin FM, Alan BR, Derek JF, Mark EO (2000). Euler deconvolution of gravity tensor gradient data. Geophysics 65(2):512-520.
Crossref
|
|
|
|
|
Corine P (1996). Gravity/magnetic signatures of various geologic models – an exercise in pattern recognition. Integrated Geophysics Corporation, footnotes on interpretation 4:4.
|
|
|
|
|
Deletie P, Lemoine Y, Montlucon J, Lakshmanan J (1988). Discovery of two unknown pyramids at Saqqarah, Egypt by a multimethod geophysical survey. SEG Expanded Abstracts 7:335-337.
Crossref
|
|
|
|
|
Dobrin MB (1976). Introduction to geophysical prospecting, 3rd edition. McGraw-Hill, New York.
|
|
|
|
|
Dobrin MB, Savit CH (1988). Introduction to geophysical prospecting. McGraw-Hil Book Co. Inc., New York.
|
|
|
|
|
Ezekiel JC, Onu NN, Akaolisa CZ, Opara A (2013). Preliminary interpretation of gravity mapping over the Njaba sub-basin of south eastern Nigeria- An implication to petroleum potential. J. Geol. Min. 5(3):75-87.
Crossref
|
|
|
|
|
Grauch VJS, John CS (2002). Gradient window method: A simple way to separate regional from local horizontal gradients in gridded potential-field data. SEG Expanded Abstracts 21:762-765.
Crossref
|
|
|
|
|
Hinze WJ (1991). The role of gravity and magnetic methods in engineering and environmental studies. In: Geotechnical and Environmental Geophysics, ed. Wards SH. Review and tutorial. Investigations in Geophysics No. 5, SEG, pp. 75-126.
|
|
|
|
|
Hood P (1965). Gradient measurements in aeromagnetic surveying. Geophysics 30:891-902.
Crossref
|
|
|
|
|
Hospers J (1965). Gravity field and structure of the Niger Delta, West Africa. Geol. Soc. Am. Bull. 76:407-422.
Crossref
|
|
|
|
|
Jacques JM, Parsons ME, Price AD, Schwartz DM (2003). Improving geologic understanding with gravity and magnetic data: Examples from Gabon, Nigeria and Gulf of Mexico. First Break 21:57-62.
|
|
|
|
|
Lakshmanan J, Montlucon J (1987). Microgravity probes of the great pyramid. The Leading Edge 6:10-17.
Crossref
|
|
|
|
|
Mandal A, Mohanty WK, Sharma SP, Biswas A, Sen J, Bhatt AK (2015). Geophysical signatures of uranium mineralization and its subsurface validation at Beldih, Purulia District, West Bengal, India: A case study. Geophys. Prospecting 63:713-726.
Crossref
|
|
|
|
|
Mandal A, Biswas A, Mittal S, Mohanty WK, Sharma SP, Sengupta D, Sen J, Bhatt AK (2013). Geophysical anomalies associated with uranium mineralization from Beldih mine, South Purulia Shear Zone, India. J. Geol. Soc. India 82(6):601-606.
Crossref
|
|
|
|
|
Mbonu PDC, Ebeniro JO, Ofoegbu CO, Ekine AS (1990). Geoelectric sounding for determination of aquifer characteristics in parts of the Umuahia area of Nigeria. Geophysics 56(2):284-291.
Crossref
|
|
|
|
|
Nabighian MN (1972.) The analytical signal of two dimensional magnetic bodies with polygonal cross section – Its properties and use for automated anomaly interpretation. Geophysics 37:507-517.
Crossref
|
|
|
|
|
Nwankwo C, Nwosu L, Emujakporue G (2011). Determination of Dar Zarouk Parameters for the Assessment of Groundwater Resources Potential: Case Study of Imo State, South Eastern Nigeria. J. Econ. Sustain. Dev. 2(8):57-71.
|
|
|
|
|
O'Connel MD, Smith RS, Vallee MA (2005). Gridding aeromagnetic data using minimum curvature operator. The Leading Edge 42:142-145.
Crossref
|
|
|
|
|
Reid AB, Allsop JM, Granser H, Millett AJ, Somerton IW (1990). Magnetic interpretation in three dimensions using Euler deconvolution. Geophysics 55:80-91.
Crossref
|
|
|
|
|
Reid AB (2002). Short note Euler magnetic structural index of a thin bed fault; School of Earth Sciences, University of Leeds, United Kingdom.
|
|
|
|
|
Reyment RA (1965). Aspect of the geology of Nigeria. Ibadan University Press, Nigeria.
|
|
|
|
|
Singh A, Biswas A (2016). Application of global particle swarm optimization for inversion of residual gravity anomalies over geological bodies with idealized geometries. Nat. Resour. Res. 25(3):297-314.
Crossref
|
|
|
|
|
Thompson DT (1982). EULDPH − A new technique for making computer − assisted estimates from magnetic data. Geophysics 47:31-37.
Crossref
|
|
|
|
|
Thurston JB, Smith RS (1997). Automatic conversion of magnetic data to depth, dip and susceptibility contrast using the SPI (TM) method. Geophysics 62(3):807-813.
Crossref
|
|
|
|
|
Uma KO (1989). Appropriate investigation techniques for water supplies to rural communities in Nigeria. Second Proceedings of the Nigerian Water Sanitation Association (NIWASA) Conference, pp. 3-8.
|
|
|
|
|
Won IJ, Murphy V, Hubbard P, Oren A, Davis K (2004). Geophysics and weapons in spection. The Leading Edge 23:658-662.
Crossref
|
|