Full Length Research Paper

ABSTRACT
The radiation coming from the sun to the earth is the only form of incoming radiant energy that determines the heat balance and thermal regime of the earth. Variation of solar radiation is the single most important factor affecting the earth’s surface temperature. This study seeks to investigate the relationship between ambient temperature and soil temperature with a view to determine the existence of space-earth coupling. With a view to achieving this aim, the research was narrowed to the correlation between air temperature and soil temperature for the Nsukka area of Enugu State in Nigeria. The data used in this study was a two-year data of air temperature and soil temperature measurements collected by the Nigerian Environmental Climactic Observing Program (NECOP) station situated at Nsukka, which carried out simultaneous basic measurements of meteorological and climatological variables, in real time, through telemetry technology, with 5-min update cycles. In order to visualize the relationship between the two variables under study, the soil and air temperatures were co-plotted with time for each month of the year for 2011 and 2012, daily and annual range using Microsoft Excel, OriginPro 2018 64-Bit and Python Programming. From the findings of this work, the air and soil temperature variation patterns over each day, month, and year depict a pattern of correlation. The soil temperature fluctuated alongside the variations observed in air temperature with the addition of time lags (response time) due to difference in their thermal conductivities and heat capacities. This time lag was observed from this work to be up to 2 to 3 h for Nsukka region. On cooling, a delay was also observed in the air temperature, as the air temperature cools about an hour after the reduction in soil temperature was observed in a daily cycle.
Key words: Solar radiation, thermal conductivity, correlation, response time, soil temperature, air temperature.
INTRODUCTION
The electromagnetic waves coming from the sun into our planet earth, called solar radiation and how it interacts with the physics of the earth is principally what gave rise to the characteristic features the earth possesses. Locally, the atmosphere may be heated by processes that do not rely directly on the sun, such as volcanic eruptions, lightning strikes, forest fires or human activity, such as power generation and heavy industry, but these heat sources are insignificant compared to solar radiation. Variation of solar radiation is the single most important factor affecting the earth’s surface temperature. Air temperature correlates well with soil temperature because both are determined by the energy balance at the ground surface (Zheng et al., 1993). Therefore, variations in air temperature could also affect the soil temperature and variations in soil temperature could also affect the air temperature. Regional weather and climate in land areas are affected by processes which involve exchanges of energy and water between the atmosphere and the earth’s surface. The rates of these exchanges are dependent on several factors, including soil temperature, air temperature and moisture (Hu and Feng, 2003). Air temperature is a very important variable in meteorology and its variations affect all other weather parameters, thereby strongly influencing the weather and long term climatic conditions of a region. Although influenced by atmospheric circulation anomalies, variations in soil temperature result primarily from the radiation and sensible and latent heat exchanges at the surface and heat transfer in soils of different thermal properties in the vertical direction. Variations in soil temperature and moisture alter the partitioning of sensible and latent heat from the surface and affect atmospheric boundary layer processes and regional circulation (Pan and Mahrt, 1987; Peters-Lidard et al., 1998).
Many studies have investigated the variations of air and soil temperatures, but examination of the relationship between the changes of air temperature and soil temperature remains largely comparative. The question of whether there are regional differences between air and soil temperatures and the reasons for such differences remain unclear. Salamene et al. (2010) investigated how atmospheric physical factors (air temperature, precipitation, solar radiation, air moisture and wind) contribute to soil temperature in Keller Peninsula, King George Island, Antarctica. According to the study, the air temperature was the factor that most influenced the soil temperature. However, the correlation between soil and air temperature decreased with increasing the soil depth. Ming-jin Zhan et al. (2019) carefully studied the changes in daily air and soil temperatures at depth of 0, 20, 80, and 320 cm, recorded at the Nanchang Weather Station (1961-2018). The results of their study showed close correlations between air temperature and soil temperature at different depths with the rates of increase in air temperature and soil temperature (depth: 0, 20, and 80 cm) being most obvious in spring and the most significant increase in soil temperature at the depth of 320 cm was in summer. Also, in the work by Fayose et al. (2021), a year data of air temperature and soil temperature measurements were analysed using method of regression used to establish a relationship between the two data sets and generate equations for determining the dependent variable from the independent variable. Sharma et al. (2010) noted in their review that soil temperature generally follows the increase in air temperature, but the relationship is often nonlinear and depends on the soil type and soil cover.
In this study however, the relationship between soil temperature variation and air temperature was investigated and a depth of 10-20 cm was selected for soil temperatures because most soil ecosystem processes occur within the top layers of soil (Buringh, 1984, Pritchett and Fisher, 1987) and also, shallow layers interact faster with atmospheric circulations. The overall variation, abrupt changes, abnormal months/seasons of temperature, and the relationship between air and soil temperatures were analyzed for the Nsukka area of Enugu State, Nigeria. The research results will provide a scientific basis for improved understanding and assessment of the impact of climate change due to increased solar radiation on terrestrial ecosystems.
Location, climate and geology of Nsukka
This study was done in Nsukka area of Enugu State. Nsukka region is located in the northern part of southeastern Nigeria, approximately between latitudes 6°51' and 7°00' N of the equator, and longitudes 7°23' and 7°45' E of the Greenwich Meridian (Ali and Agbiogwu, 2014). Nsukka has a land area of 40,750 km² with a mean elevation of 1,810 ft (552 m) above sea level and has an estimated population of 309,448 as of 2006 (NPC, 2010). Nsukka is one of the 17 local government areas of Enugu State, Nigeria. Communities that make up Nsukka are Edem Ani, Ibagwa Ani, Opi, Eha-lumona Orba and Ede-Oballa and Obimo.
Based on Koppen’s climatic classification scheme, the climate of Nsukka is classified as the tropical wet and dry climate (Phil-Eze, 2004). The area receives enough sunshine throughout the year. It has an average daily maximum and minimum temperature of 27 and 23.3°C, respectively, while its average monthly maximum temperature is about 31.5°C (Inyang, 1978). Rainfall in Nsukka is very high and intense. The average monthly rainfall ranges from 250 mm in April to 380 mm in October, with a mean annual total of 1500 mm (Inyang, 1978). The rainless period of the year (dry season) in this region lasts from November to March while the wet season spans from April to October. The harmattan season characterized by the dry and dusty northeasterly trade wind occurs between end of November and end of February.
It is underlain mainly by two geologic formations, that is, the false bedded sand stone (Ajalli sandstone) and Lower Coal Measure (Nsukka Formation). The soils of Nsukka L.G.A are classified into two major groups, namely: ferrallitic soils (deep porous red soils derived from sandy deposits, and the red and brown soils derived from sandstones and shales), and hydromorphic soils. Agriculture is the most predominant socio-economic activities engaged by the inhabitants of the area. The farmers in the area plant different species of crops like yams, cassava, cocoyam, pigeon peas, pepper, maize, and vegetables. Cash crops like palm produce, tobacco, kola, oranges, mangoes and so many other fruit plants grow very well in the region too.
METHODOLOGY
The data used in this study was a two-year data of air temperature and soil temperature measurements collected by the Nigerian Environmental Climatic Observing Program (NECOP) station situated at Nsukka. The NECOP project was designed to establish a network of meteorological observing stations, spatially located across Nigeria. The aim of NECOP is to create a network of stations that can carry out simultaneous basic measurements of meteorological and climatological variables, in real time, through telemetry technology, with 5-min update cycles (Falodun and Okeke, 2013).
For the purpose of this work, ambient temperature and soil temperature data spanning from 2011 and 2012 were obtained from the Centre for Basic Space Science (CBSS), Nsukka. The data were presented at an update cycle of 5 min. This high resolution will afford the capture of transient changes of the parameters under investigation. The sampling time of the instrument used in gathering the data is 1 min. Data under review covers all seasons in Nigeria which is the dry, harmattan and wet seasons.
Analysis of data
The air and soil temperature data for the period under study was taken at 5 min interval. The average which is the arithmetic mean was calculated by adding a group of numbers and then dividing by the count of those numbers.

Hence, the average of the soil and air temperatures was obtained for every 30 min interval.
The dataset were processed using Microsoft Excel for statistical analyses of the data, Python programming language and OriginPro 2018 64-Bit, for plotting the graphs.
The air and soil temperatures were co-plotted with the time interval aiming at recognizing anomaly at which two variables are unable to continue linearity. The results obtained are being analyzed.
RESULTS AND DISCUSSION
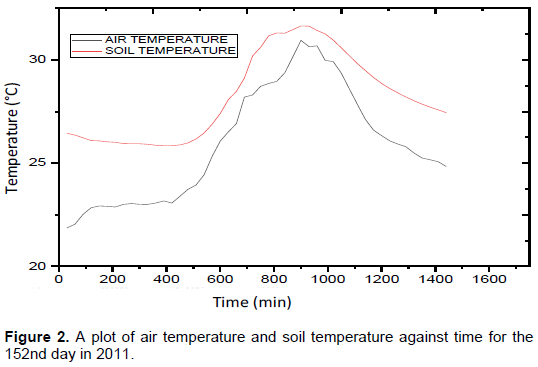
For the years under review (2011-2012), monthly time series of the air temperature was co-plotted with the soil temperature in order to show the interdependencies that exist between them as shown in Figures 1 and 2.
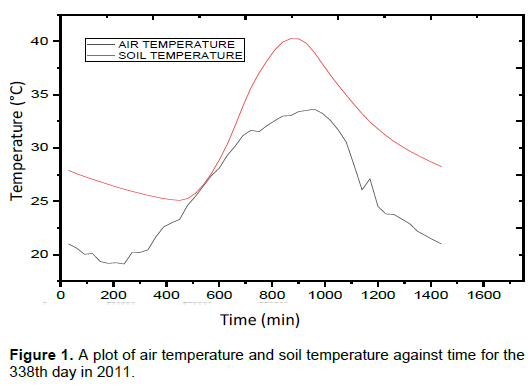
Diurnal variations in air and soil temperatures
From the plots, it was observed that the soil temperature is usually higher than the air temperature. This is due to the fact that the soil holds more heat than air as it has higher heat capacity than air and also because of its dense composition. From Figure 1, both the air temperature and soil temperature gradually decrease for about 300 min (5 h) from midnight. At sunrise, around 5 am [Local time], the air temperature starts increasing by a factor of 1.3°C, while the soil temperature still decreases very slowly by 0.3°C up to 8 am [Local time] (480 min from midnight) when the soil has absorbed energy and then increases gradually. So, a response time of the soil temperature to an increase in air temperature is 3 h. This phase lag in the diurnal variation of soil temperature with air temperature shows energy propagation downward in form of a wave among air-land-soil. The air temperature increases faster than the soil temperature up till 11 am [Local time] when the reverse situation occurs and the soil temperature increases by about 2°C per hour. The maximum daily soil temperature is observed in the evening around 3 pm [Local time] after which it re-radiates its heat upwards causing the increase in air temperature and reduction in soil temperature. The maximum daily soil temperature is observed around 4 pm [Local time] above which the both temperatures reduce steadily as the sun sets and steeply through the night due to radiation cooling that takes place at the top and cool air comes downward, with the air temperature dropping faster than the soil temperature.
A similar trend is also observed in Figure 2 with the difference that the time lag by the soil temperature is lesser (1 h, 45 min) than in Figure 1. This shows an increase in solar energy absorption and higher heat storage capacity at that time of the year. So, the overall balance in both the soil and air temperature shows that there is net heat gain during the day due to the absorption of solar radiation and net heat loss during the night due to convection.
Monthly variations in air and soil temperature for some months in the year 2011
The plot of temperature verses time for some months in 2011 was carried out, the results are as shown in Figure 3.
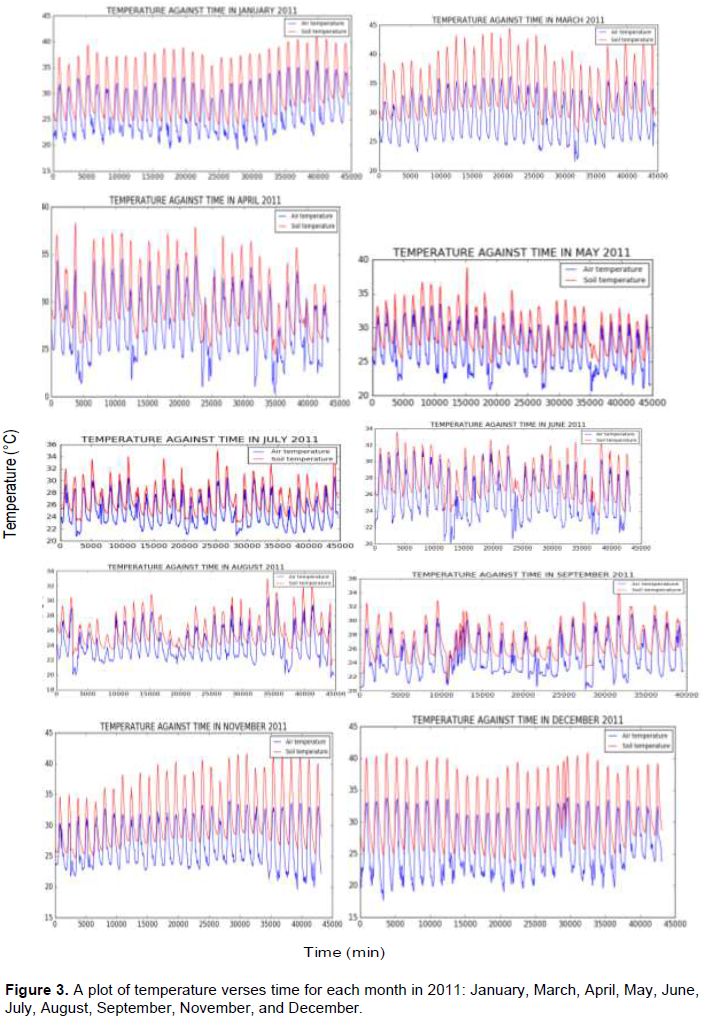
In 2011, months like November, January, and March have maximum air temperatures of 33.98, 36.32 and 36.24°C, respectively and minimum air temperatures of 19.62, 19.18 and 21.59°C, respectively. The maximum and minimum soil temperatures for these month are 41.66, 41.17, 44.48°C and 24.75, 23.99, and 26.72°C respectively. Months like April, June, and September have maximum air temperatures of 34.85, 31.69 and 31.05°C, respectively and minimum air temperatures of 20.32, 20.10 and 21.19°C, respectively. The maximum and minimum soil temperatures for these month are 38.31, 33.56, and 34.70°C and 24.46, 23.54, and 21.69°C respectively.
Monthly variations in air and soil temperature for some months in the year 2012
Again, plot of temperature verses time for some months in 2012 were carried out, the results are as shown in Figure 4.
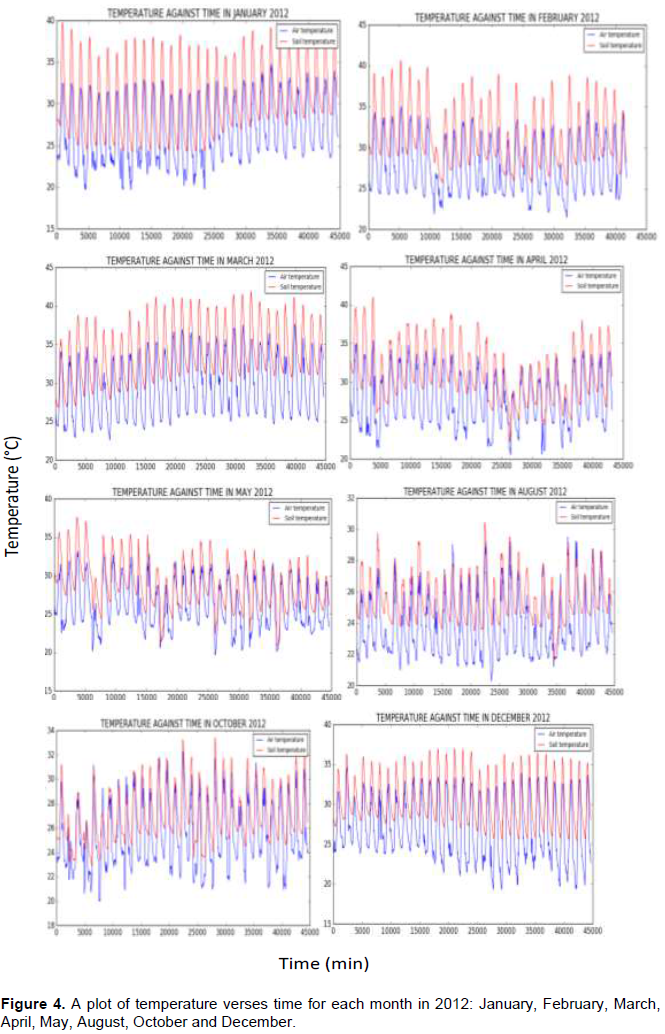
For the months in 2012, the highest recorded air temperatures for the month of December, February and March are 34.67, 35.01 and 37.67°C with minima of 19.67, 21.47 and 22.58°C, respectively. Also, the highest recorded soil temperatures for the month of December, February and March are 36.98, 40.65 and 41.90°C with minima of 25.43, 25.41 and 26.84°C respectively.
From these monthly plots (2011-2012), the air and soil temperature variation patterns over each month depict a pattern of correlation. The soil temperature fluctuates alongside the variations observed in air temperature. The soil is observed to hold more heat than the air because of its thermal capacity, leading to higher value of soil temperature as seen in all the plots in 2011 with little deviation observed in some wet months (Figure 4) in 2012 which could be due to changes in climatic conditions.
However, the selection of the months of the year to be analyzed was based on the fact that these months duly represent the seasons (dry, wet and harmattan) experienced in the location of study.
Seasonal variations in air and soil temperature
In dry season which spans from around November to March in the region under study, there is a noticeably increase in the maximum and minimum values of both the air and soil temperature with the maximum peaks of 36.24°C observed in March, 2011 and 37.67°C for March, 2012 for the air temperature and 44.48 and 42.0°C for the same month in each of the years, respectively for the soil temperature. This is because March is the peak of dry season. During the wet seasons, that is, from April to October, there is a gradual reduction in the maximum and minimum values of the air and soil temperature. In this season, the month with the least maximum peak value of temperature is August with its maximum air temperature being 30.47°C in 2011 and 29.51°C in 2012. The primary reason for the wet season cycle being less smooth is the precipitation events and minimum sunshine hours observed during this period of time. Rainfall and cloud formation realistically reduces the temperature of air and soil for a certain while of the day in the zone. On the other hand, cloudy weather interrupts the energy transfer from the sun to the earth. Cloud which is characterized by neutral conductivity not only inhibits energy transfer from the sun but also restrains released energy from the earth in the atmosphere. Its effect in absorption and scattering of solar radiation and subsequently solar dimming, affects the air and soil temperatures.
The reduction in the magnitude of temperatures in wet season is also accounted for from the fact that wet soils warms up slowly than dry soils (in dry seasons). As the soil warms up on receiving solar radiation, some of the heat is used to dry wet soil while the rest of the heat goes towards raising the soil temperature. If the available heat is being shared between the latent (heat that dries the soil) and sensible (the heat that warms the soil) heat, the soil temperature will take longer time to warm up.
Annual changes in air and soil temperature
The graph of air and soil temperature was plotted against time (min) for the years 2011 and 2012 as shown in Figures 5 and 6.
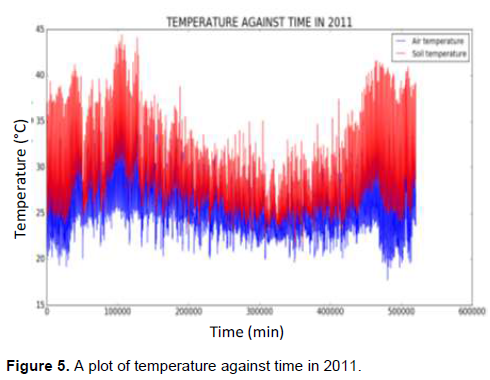
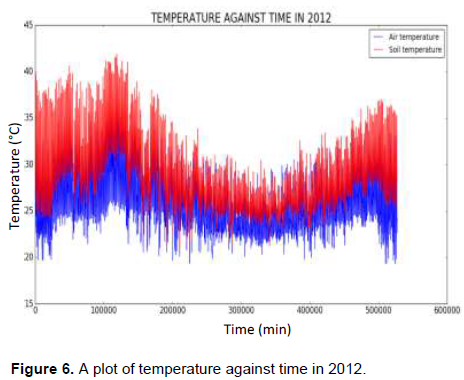
Over this period of study (2011-2012), the annual mean air temperature has remained lower than the annual mean soil temperatures. For the year 2011, the mean annual air temperature is 26.05°C and the mean annual soil temperature is 29.25°C while for the year 2012, the mean annual air temperature is 26.10°C and the mean annual soil temperature is 28.95°C. The temperature difference between the air and the soil has remained positive.
For the years under study, it was observed from the graphs that the trends of variation between the soil and air temperature at the chosen depth (10-20 cm) remained the same with very high temperatures generally observed at the end and beginning of each year, though the observed peak temperatures for both air and soil is higher in 2011 and 2012.
However, from the findings of this analysis, a significant relationship exists between the air temperature and soil temperature at the shallow depth of 10-20 cm as the soil temperature followed a similar pattern of the air temperature with the magnitude of the soil temperature, different from that of the air temperature. This behaviour is expected, since it is in direct contact with the soil surface. Also, there is observable trait in the trend of the daily variations which is the response time of the soil to the increase in air temperature. This time lag was observed from this work to be up to 2-3 h for Nsukka region. On cooling, a delay was also observed in the air temperature, as the air temperature cools about an hour after the reduction in soil temperature was observed.
CONCLUSION
This research work investigated the Space-Earth coupling at Nsukka, Enugu State, Nigeria. It showed the interaction between the space phenomena (which is the variations of solar radiation) with thermal capacity of the earth. As buttressed in this work, the radiation coming from the sun to the earth is the only form of incoming radiant energy that determines the heat balance and thermal regime of the earth. This radiation enters the earth in varying amounts depending on factors like the time of the day, the season, the geographical location, etc. Solar radiation is the main source of heat for the atmosphere, so its intensity determines the air temperature and then the soil temperature of a given region. With regard to this, both soil and air temperatures are dynamic in nature, having yearly, seasonal and diurnal cyclic variations (Hasfurther et al., 1972). The temperature of the soil depends on the ratio of the energy absorbed to that lost from the soil. Hence, it is subject to annual and daily fluctuations, affected mainly by variations in air temperature and solar radiation.
From the analysis of this study, there is a strong positive correlation between these two variables as increase in one variable leads to a corresponding increase in the other with the addition of time lags due to their different thermal conductivities and heat capacities.
The knowledge of the relationship between the air temperature and soil temperature is very vital to researchers, students and most especially to farmers in the agricultural sector who are the key stakeholders for economic growth of a nation. It is important for farmers to have enough knowledge of the temperature of the soil (which is driven by atmospheric conditions) on which they plant and also to affirm the suitability of any crop whose performance at different atmospheric or temperature conditions for optimal crop yield.
RECOMMENDATIONS
Model development
Since a significant relationship has been established between the air and soil temperature at the depth of 10 to 20 cm as successfully explained in this work, the development of models for direct estimation and prediction of the soil temperature from the air temperature is very possible. This will help create a large database of soil temperature which can be localized in specific areas and used by different researchers.
Spatial investigation
As a result of diverse soil composition across Nigeria, further studies should be carried out to establish a correlation between the soil temperature and the air temperature for other regions in the country and the results can be compared with that obtained for Nsukka.
CONFLICT OF INTERESTS
The authors have not declared any conflict of interests.
ACKNOWLEDGEMENT
The authors are grateful to Centre for Basic Space Science (CBSS), Nsukka and all the authors of the materials consulted while preparing this work.
REFERENCES
|
Ali AN, Agbiogwu O (2014). Map of Nsukka Local Government Area Showing the Major Communities. In: poverty and socioeconomic development in Nsukka local government area, Enugu State, Southeastern Nigeria. Innovare Journal of Social Sciences 2(4):35-41. |
|
|
Buringh P (1984). Organic carbon in soils of the world. In: Woodwell GM (ed.). The role of terrestrial vegetation in the global carbon cycle: measurement by remote sensing. Scope 23, John Wiley & Sons. Chichester pp. 91-109. |
|
|
Falodun SE, Okeke PN (2013). Radiowave Propagation Measurements in Nigeria (preliminary reports). Journal of Theoretical and Applied Climatology 113(1):127-135. |
|
|
Fayose RS, Agunloye AO, Tomiwa AC (2021). Determination of Soil Temperature Variations with Time Based on Air Temperature and Effects on Climate. Department of Physics and Electronics, Adekunle Ajasin University, Akungba Akoko, Nigeria. In: IOSR Journal of Applied Physics 13:11-25. |
|
|
Hasfurther V, Burman, RD, Nunn J (1972). A Model for Predicting Soil Temperature from Air Temperature. Agricultural Engineering Division, University of Wyoming, Laramie, Wyoming. Technical report No. 178. |
|
|
Hu Q, Feng S (2003). A daily soil temperature dataset and soil temperature climatology of the contiguous United States. Journal of Applied Meteorology 42(8):1139-1156. |
|
|
Inyang, PEB (1978). The climate of Nsukka and Environs, in Ofomata, GEK (ed). The Nsukka Environment. Fourth Dimension Publishing Company, Enugu pp. 86-94. |
|
|
Ming-jin Z, Lingjun X, Longfei Z, Yuanhao W (2019). Recognition of Changes in Air and Soil Temperatures at a Station Typical of China's Subtropical Monsoon Region (1961-2018). |
|
|
National Population Commission (NPC) (2010). Federal Republic of Nigeria 2006 Population and Housing Census Priority Table Volume Iv Population Distribution by Age and Sex (State & Local Government Area). |
|
|
Pan HL, Mahrt L (1987). Interaction between soil hydrology and boundary-layer development. Bound-Layer Meteorology 38(1):185-202. |
|
|
Peters-Lidard CD, Blackburn E, Liang X, Wood EF (1998). The effect of soil thermal conductivity parameterization on surface energy fluxes and temperatures. Journal of Atmospheric Science 55:1209-1224. |
|
|
Phil - Eze PO (2004). The Vegetation of the Nsukka Plateau: Empirical Analysis of Forms and Patterns. In Nwafor JC et al. (eds), Geographical Report of the University of Nigeria pp. 128-146. |
|
|
Pritchett WL, Fisher RF (1987). Properties and Management of Forest Soils. 2nd edition. John Willey & Sons, New York P 494. |
|
|
Salamene S, Francelino MR, Mercandelle R (2010). Correlation between atmospheric physical factors and soil temperature of Keller Peninsula, King George Island, Antarctica. In: 19th World Congress of Soil Science, Soil Solutions for a Changing World. Brisbane, Australia. Published on DVD. |
|
|
Sharma P, Shukla MK, Sammis TW (2010). Predicting soil temperature using air temperature and soil, crop, and meteorological parameters for three specialty crops in Southern New Mexico. Applied Engineering in Agriculture 26(1):47?58. |
|
|
Zheng D, Hunt ER, Running SW (1993). A Daily Soil Temperature Model Based on Air Temperature and Precipitation for Continental Applications. Climate Research 2(3):183-191. |
|
Copyright © 2024 Author(s) retain the copyright of this article.
This article is published under the terms of the Creative Commons Attribution License 4.0


