Full Length Research Paper

ABSTRACT
In this work, a real time blood pressure, temperature measurement and reporting system for inpatients was developed. The function of this system is to constantly measure the blood pressure and temperature of a patient and send the measured values to the medical doctor or other relevant care givers through wireless link. The system is built around the STM32F103C8 Microcontroller programmed in C language which performs the overall control action and interfaces with other peripherals like MPX5050GP and the DS18B20 which acts as primary sensors for blood pressure and temperature respectively. The health monitoring system was designed, constructed and tested. The results of blood pressure and body temperature measurements were compared with those of an OMRON blood pressure monitor and a clinical thermometer respectively. The deviations in measurements are on average ±4 mmHg and ±0.17°C for blood pressure and temperature respectively. This is considered satisfactory as the measurement error is found to be within tolerable limits.
Key words: Microcontroller, blood pressure sensor, temperature sensor, wireless link.
INTRODUCTION
Patients are dying of high blood pressure or hypertension around the world especially in Africa because of lack of timely health care (WHO, 2013; Davies et al., 2014).
Hypertension is defined as increased blood pressure (BP) above 140 mmHg systolic and 90 mmHg diastolic when measured under standard conditions (Wagner et al., 2012; Pickering, 1996). The World Health Organization (WHO) considers hypertension to be a major chronic disease and a leading cause of death and disability in developing countries and it is estimated to affect a quarter of the world’s adult population. (Lopez, 2006; Hansen et al., 2005). Blood pressure should be therefore be kept within safe limits (<130 mmHg systolic, < 80 mmHg diastolic (Chobanian et al., 2003).
Fever which results in high body temperature is also adding its death toll on patients (Garmel and Gus, 2012; Harry, 2015). Body temperature is one of the key parameter indicators of a person’s health (Rush and Wetherall, 2003). For example, during the ebola disease outbreak in Nigeria, abnormal rise in a patient’s body temperature was one of the suggestive signs that the patient may have contracted the dreaded virus. Body temperature cab also be used to monitor the pain level of a patient after an operation (Jiann et al., 2007). High body temperatures could also be a symptom of other ailments. For children, high temperature could result in convulsion and eventual death, if not properly managed.
The normal temperature of the human body is approximately 370C, with variations depending on the person’s age and environment (Malhi et al., 2012).
Most patients are not well versed with manual treatment which doctors normally use for tracking blood pressure. So there must be some device which would help patients to keep track on their health by themselves and to enable doctors or paramedical staff to monitor patients’ health remotely. There are various instruments available in the market to keep track on internal body changes. But there are many limitations regarding their maintenance due their heavy cost, size of instruments, and mobility of patients.
To overcome these limitations, a device used to keep track on blood pressure and body temperature of a patient should be easy to use, portable, light weighted, etc so that it gives freedom of mobility for the patient. The device can be carried everywhere to keep track on patient’s health. This device would help to keep track of the blood pressure and the body temperature of a patient and check for any abnormalities which will be promptly reported. The blood pressure and temperature monitoring system developed in this work uses information technology to provide continuous blood pressure and temperature readings to a medical expert located either within or outside a defined measurement area. This notification would help caregivers to take appropriate action when necessary. This timely intervention could help to avert fatalities that could otherwise have resulted.
Quite a great deal of work has been done in the area of remote health monitoring. For example, Zhang et al. (2013) designed an electronic blood pressure monitoring system based on mobile telemedicine system. Their design included a zigbee wireless transmission module for sending measured blood pressure data in real time. Challenge with this design is that zigbee has low memory capacity thus limited patients data van only be transmitted and stored.
Obahiagbon and Odigie (2015) developed a frame work for intelligent remote blood pressure monitoring and control system. Here, measurements are sent in form of electronic pulses from the wireless sensor to a mobile device equipment with Wireless Application Protocol (WAP). The challenge with this design is that the mobile sensor device must be equipped with WAP and signals must be transmitted through WAP gateways.
Cheng et al. (2015), developed a remote temperature monitoring device. Their device uses a patient and coordinator approach involving measurement, transmission, receipt and recording patient temperatures via WiFi wireless network. The challenge with this design is that the device can only monitor temperature which has to be transmitted through a WiFi network which is complex and has inherently high power consumption.
METHODOLOGY
The sections that follows presents the features of the designed system, and the methods adopted for the design of each block that makes up the complete circuit.
Main features of the designed system
The design is that of an electronic system which is able to perform a non-invasive measurement of the blood pressure based on the principle of oscillometry, thus limitations resulting from auscultatory measurement systems is avoided in this design. The system is designed in such a way that it measures the blood pressure (BP) and temperature simultaneously and transmits same in real time to a medical personal within a defined location or RF coverage. The system can be programmed to transmit the measurands once in every minute. Moreover the proposed system is able to evaluate both the systolic and diastolic blood pressure values, temperature values and by means of a microcontroller evaluate them, and send an alarm signal to medical personnel should the measured values be abnormal. Above all, the design is simple, cheap portable and has very low power consumption.
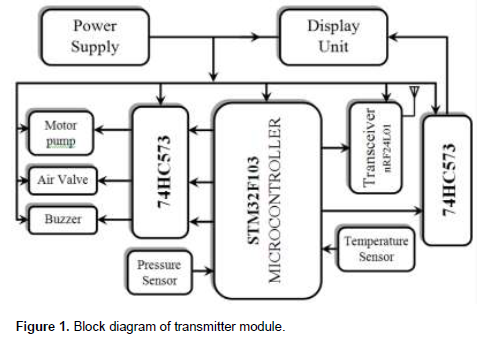
The developed system is divided into two parts – Hardward and Software. The hardware unit is further divided into two modules – Transmmitter and Receiver. The transmitter module consists of a microcontroller, two 74HC573 integrated circuits, power supply, LCD, nRF24L01+ transceiver module, dc motor pump, buzzer, blood pressure and temperature sensors etc. The receiver module also consists of a micrcontroller, two 74HC573 integrated circuits, power supply, LCD, buzzer, nRF24L01+ transceiver module etc.
Transmitter module
The transmitter module interfaces with the primary sensing devices, signal conditional elements and then send the measured values of temperature and blood pressure to the receiver module via a wireless link. The block diagram of the transmitter module is presented in Figure 1 and the descrioption/design of the transmitter module is subsequently presented.
Body temperature sensor – DS18B20
The DS18B20 temperature sensor is a precision integrated-circuit temperature sensor, whose output voltage is linearly proportional to the Celsius (Centigrade) temperature. The DS18B20 thus has an advantage over linear temperature sensors calibrated in ° Kelvin, as the user is not required to subtract a large constant voltage from its output to obtain convenient Centigrade scaling. The DS18B20 operates from -55 to +125°C temperature range, with  0.5 accuracy from -10 to +85°C (Dallas Semiconductor Data Sheet, 2000). Some features of DS18B20 are:
i) Calibrated directly in ° Celsius (Centigrade)
ii) Linear + 10.0 mV/°C scale factor
iii) Suitable for remote applications
iv) Low cost due to wafer-level trimming
v) Operates from 3.0 to 5.5 Volts
Blood pressure sensor – MPX5050GP
The MPX5050 series piezoresistive transducer is a monolithic silicon pressure sensor designed for a wide range of applications, particularly those employing a microcontroller or microprocessor with A/D inputs. This transducer combines advanced micromachining techniques, thin film metallization, and bipolar processing to provide an accurate, high-level analog output signal that is proportional to the applied pressure (Freescale Semiconductor Data Sheet, 2000). The analog output of this sensor can be fed directly into a microcontroller with inbuilt ADC thus avoiding the need for an external analog filter. The following are some features of MPX5050GP:
i) 2.5% Maximum Error Over 0° to 85°C
ii) Patented Silicon Shear Stress Strain Gauge
iii) Temperature Compensated Over –40° to +125°C
iv) Ideally suited for microprocessor or microcontroller-based systems
v) Sensitivity is 90 mV/kPa (≈12 mV/mmHg)
The pressure sensor output pressure range is 0 to 50 kPa (0 to 7.25 psi) which is equivalent to 0.2 to 4.7V output range. Since the unit of blood pressure is usually in mmHg, there is need for conversion.
1 kPa = 7.51164 mmHg
50 kPa = 375.582 mmHg
Therefore, the pressure sensor output pressure range is 0 – 375.582 mmHg. This is particularly useful for this design as blood pressure measurements falls within this range.
The blood pressure measurement is based on the principle of oscillometry (Neil, 2001). In this method, the pressure sensor MPXV5050GP senses the pressure in the cuff attached to the patient’s arm. The cuff is inflated and deflated by an electrically operated pump and valve. Initially the cuff is inflated in excess of the systolic arterial pressure, and then the cuff pressure reduces to below the diastolic pressure. Once the blood is present, but restricted, the cuff pressure will vary periodically in synchrony with the cyclic expansion and contraction of the brachial artery (Hartmann, 2016).
It has been shown that the pressure, Pm, at which the oscillations have the maximum amplitude, Am, is the mean arterial pressure (MAP). Empirical and theoretical work has shown that the systolic and diastolic pressures, Ps and Pd respectively, occur when the amplitudes of oscillation, As and Ad respectively, are certain fractions of Am:
- Ps is the pressure above Pm at which As/Am = 0.55
- Pd is the pressure below Pm at which Ad/Am = 0.85
Using this method, it is therefore possible to design a device for measuring Blood Pressure non-invasively.
Therefore, based on the oscillometric method, the values of systolic and diastolic pressures are computed from the raw data of cuff pressures sensed by the pressure sensor, using an algorithm.
The nRF24L01 transceiver
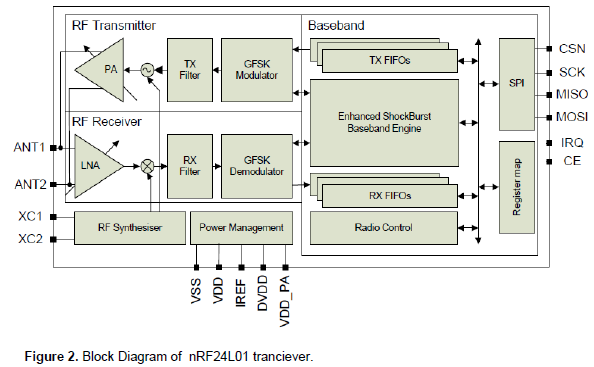
This RF module comprises of an nRF24L01+ transceiver. The nRF24L01+ is a single chip 2.4 GHz transceiver with an embedded baseband protocol engine (Enhanced ShockBurst), suitable for ultra low power wireless applications. The nRF24L01+ is designed for operation in the world wide ISM frequency band at 2.400 – 2.4835 GHz. It operates at a 1.9 to 3.6 V supply range (Nordic Semiconductor Data Sheet, 2008).
The proposed application is based on wireless networking. Therefore, nRF24L01+ transceiver is found to be suitable for this application. At least two nRF24L01+ modules are required, one for the transmitter and one for the receiver. The block diagram of the transceiver is presented in Figure 2.
The nRF24L01 transceiver has been programmed to transmit and receive signals of blood pressure and body temperature values after measurements from the transmitter unit to the receiver unit.
The integrated circuit 74HC573 is a buffer IC operating with a 5V power supply which is used to interface with the microcontroller STM32F103C8 which has an operating voltage range of 2.0V to 3.6V (Hartmann, 2016). A bypass capacitor is connected directly to the power source and to ground of each 74HC573 integrated circuit. The bypass capacitor helps to filter electrical noise out of the circuit. Datasheet recommends a 100 nF (0.1 μF) capacitor to compensate for current ripples on the power supply (Lopez, 2006).
The entire transmitter module is built around the STM32F103C8 microcontroller programmed in C language. It performs control actions for the system that interfaces with other peripherals, that is, 74HC573buffer IC (NPX Semiconductor Data Sheet, 2016), DC motor pump and solenoid valve for inflating and deflating the cuff respectively, IRF3205 MOSFET and 2N222 BJT transistor for switching the motor and power amplification respectively. The values of base resistors of the 2N222 transistors can be any value within the typical recommended range of 1 – 10K.
STM32F103C8 is a 32-bit that provides a highly-flexible and cost-effective solution to many embedded control applications. It can operate with operating voltage levels from 2.0V to 3.6V (ST Microelectronics Semiconductor Data Sheet, 2007). The push buttons connected to the microcontrollers of both the transmitter and receiver units have pull resistors of 1k each between power supply of 3.3V and each of the push buttons. The values of these resistors can be any value within the typical recommended range of 1 – 10k. The pull resistors ensure a well-defined logical high state and prevents a high impedance state.
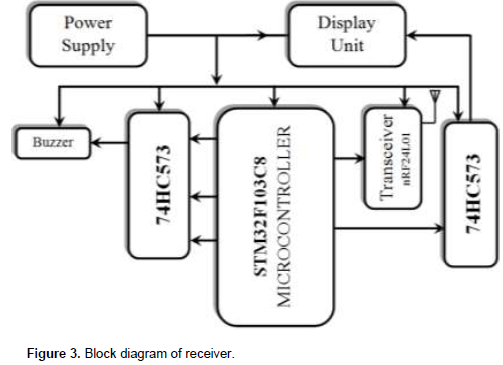
The receiver module
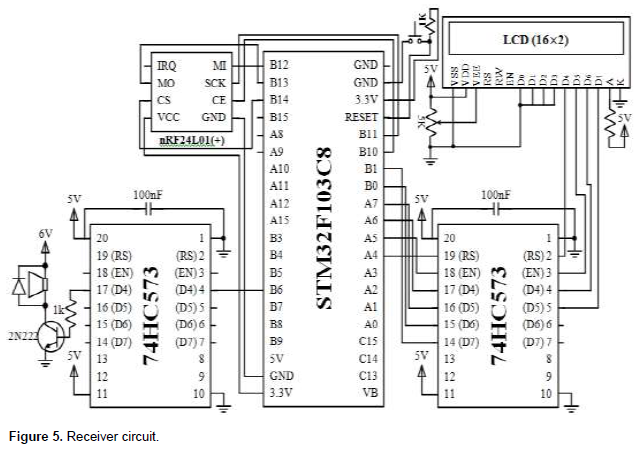
The function of the receiver unit (Figure 3) is to receive data from the air and then display the data as per the requirements on an LCD screen. The receiver can also receive data and transfer them into a PC with the help of a USB communication port for debugging of the circuit.
The microcontroller of the receiver has been programmed to monitor the values of body temperature and blood pressure received so as determine whether they are in range of predetermined limits, that is, lower limit and upper limit. This is achieved by comparing the incoming data of each channel with both limits. If the values are not within range, then the microcontroller will send a command to the buzzer to alert the doctor or any other medical staff of the abnormal readings for necessary action.
The buzzer has been programmed to come up when the systolic pressure, PS, and the diastolic pressure, PD, do not satisfy the conditions: 
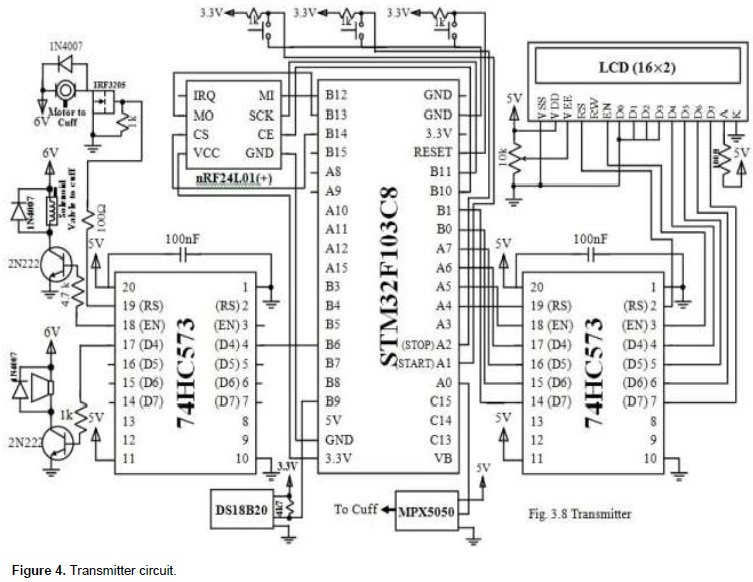
CIRCUIT IMPLEMENTATION
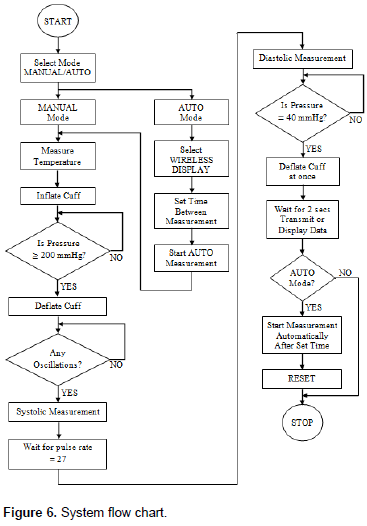
The designed circuit was replicated in a PCB using The EAGLE (Easily Applicable Graphical Layout Editor) software. The circuit diagram for the transmitter and receiver module is presented in Figures 4 and 5 respectively. The operation of the measurement system is presented in the flowchart of Figure 6.
TEST RESULTS
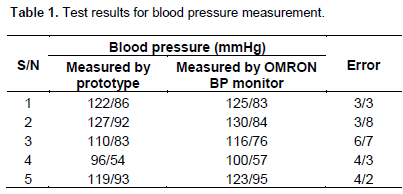
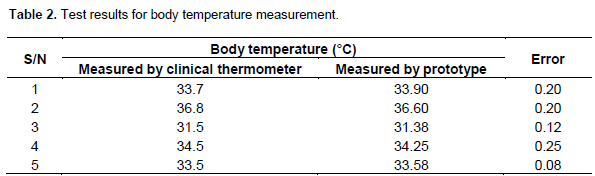
After the design and construction of the prototype, measurements of body temperature and blood pressure of five (5) volunteer patients were taken (one BP and one temperature measurement for each volunteer) and compared with measurements immediately taken from a conventional temperature and blood pressure measurement kit for the same patients. The results of the measured body temperature, blood pressure, and error in both systolic and diastolic (for BP) and error in temperature measurement were tabulated and are shown in Tables 1 and 2.
DISCUSSION
As seen in Tables 1 and 2, the Real Time Blood Pressure, Temperature Measurement and Reporting System was able to measure the temperatures and blood pressure of the five (5) participants.
The temperature and blood pressure readings of the participants who wore the portable device were transmitted wirelessly to the main station (doctor’s office) where they were monitored and evaluated.
From Table 1, it can be seen that the error in systolic values measured is approximately 4 mmHg. While the error in diastolic values, it is approximately 5 mmHg. Since the readings are not simultaneously taken, the time elapsed between the measurements by the prototype and the OMRON blood pressure monitor contributes to the deviation in measurement. Literature has it that because of the patient’s position, his anxiety or expectations coupled with the unstable pulse rate of the human heart, no two blood pressure measurements taken one immediately after the other will give exactly the same results (Taram and Mike, 2012). Even when a conventional blood pressure monitor is used to measure a patient’s blood pressure at two consecutive times, the measurements will not have exactly the same values.
The sensitivity of the temperature and the blood pressure sensors, and the performance of the blood pressure pumping motors all contribute to errors in measurement of the patient’s body variations. The transmitter antenna power also limits the transmission range or distance of the measured values. The measurement errors are however within tolerable limits as they do not vary significantly for reading taken with conventional measurement kits.
On the average the error margin for the proposed prototype is 0.17 which is a tolerable deviation.
CONCLUSION
The Automatic Wireless Patient Health Monitoring System for measurement of patients’ temperature and blood pressure has been designed, built and tested using embedded technology. It is proposed to replace the existing manual systems with an integrated system. It uses temperature and blood pressure sensors to measure temperature and blood pressure respectively and automatically. The measured values are transmitted and displayed on an LCD screen placed in the doctor’s office or that of any of the paramedical staff in charge of monitoring patients’ health. Any abnormalities in health conditions are informed via a display unit (LCD) and an alarm unit in the doctor’s or paramedical staff’s office. The hardware was implemented and it worked satisfactorily when tested.
CONFLICT OF INTERESTS
The authors have not declared any conflict of interest.
REFERENCES
|
World Health Organization (2013). Nigerians Wake Up to High Blood Pressure. Bull. World Health Organization 91(4):237-312. |
|
|
Cheng SC, William A, Lok WW, Ehsan M (2015) Remote temperature monitoring device using a multiple patients-coordinator set design approach. ROBOMECH J. 2(4). |
|
|
Chobanian AV, Bakris GL, Black HR (2003). Seventh report of the joint national committee on prevention, detection, evaluation, and treatment of high blood pressure. Hypertension 42(6):1206-1252. |
|
|
Dallas Semiconductor Datasheet (2000). DS18B20 Programmable Resolution 1-Wire Digital Thermometer, www.dalsemi.com, [Accessed: April 2, 2016]. |
|
|
Davies AO, Catriona B, Adewale VA, Jacueline YT, Felix AO (2014). An Estimate of the Prevalence of Hypertension in Nigeria. J. Hypertens. |
|
|
Freescale Semiconductor Datasheet (2010). Integrated Silicon Pressure Sensor On-Chip Signal Conditioned, Temperature Compensated and Calibrated, MPX5050, www.freescale.com. [Accessed: April 2, 2016]. |
|
|
Garmel T, Gus M (2012). An Introduction to Clinical Emergency Medicine, (2nd ed.), Cambridge: Cambridge University Press P 375. ISBN 0521747767. |
|
|
Hansen NE, Haunsø S, Schaffalitzky de Muuckadell OB (2005). Hypertensio arterialis"Medicinsk kompendium, Nyt Nordisk Forlag Arnold Busck, Copenhagen, Denmar pp. 314-315. |
|
|
Harry HO (2015). Fever: Its Biology, Evolution, and Function. Princeton University Press, page 57. ISBN 9781400869831. |
|
|
Hartmann P (2016). "Oscillometric Measurement Devices," |
|
|
Jiann SS, Chun YD, Yeong RW, Wei ZS (2007). A novel fuzzy pain demand index derived from patient-controlled analgesia for postoperative pain. IEEE Trans. Biomed. Eng. 54(12):2123–2132 |
|
|
Lopez AD (2006). Global and regional burden of disease and risk factors, 2001: systematic analysis of population health data. Lancet. 367(9524):1747-57. |
|
|
Malhi K, Mukhopadhyay SC, Schnepper J, Haefke M, Ewald H (2012). A zigbee-based wearable physiological parameters monitoring system. IEEE J. Sens. 12(3):423-430. |
|
|
Neil T (2001). Oscillometry. Michael Mas pub. pp. 48-54. |
|
|
Nordic Semiconductor Datasheet (2008). "nRF24L01+ Single Chip 2.4GHz Transceiver," www.nordicsemi.no, accessed April 5, 2016. |
|
|
NPX Semiconductors Product Data Sheet (2016). "74HC573; 74HCT573 Octal D-type Transparent Latch. 3-State. |
|
|
Obahiagbon K, Odigie B (2015). A Framework for Intelligent Remote Blood Pressure Monitoring and Control System for Developing Countries. J. Comput. Sci. Appl. 3(1):11-17. |
|
|
Pickering T (1996). Recommendations for the use of home (self) and ambulatory blood pressure monitoring. Am. J. Hypertens. 9(1):1-11. |
|
|
Rush M, Wetherall A (2003). Temperature measurement: practice guidelines. Paediatr. Nurs. 15(9):25-28. |
|
|
ST Microelectronics Preliminary Data Sheet (2007). STM32F103x6, STM32F103x8 STM-32F103xB, www.st.com. [Accessed: April 5, 2016]. |
|
|
Wagner S, Toftegaard TS, Bertelsen O (2012). Challenges in Blood Pressure Self-Measurement. Int. J. Telemedicine Appl. ID 437350:1-8. |
|
|
Zhang Jl, Liu Y, Wen J (2013). Design of electronic blood pressure monitoring system based on mobile telemedicine system. Proc. Int. Conf. Complex Med. Eng. pp. 145-149. |
|
Copyright © 2024 Author(s) retain the copyright of this article.
This article is published under the terms of the Creative Commons Attribution License 4.0


