Full Length Research Paper

ABSTRACT
Using household survey data, this paper examines the case of three villages in rural Egypt to shed light on the determinants of income distribution. We first employ decomposition techniques to identify the contribution of farm and non-farm income to overall household inequality. We then use regression analysis to identify the role of different factors in determining the level of farm and non-farm income. Based on the analysis of household income structure and its determinants, we clarify the strong effect of land holding on rural household income distribution, and the differing effects of non-agricultural employment opportunities through the linkage to non-agricultural labor markets. Overall, while non-farm employment is obviously an important determinant of income distribution in rural Egypt, the relationship between land, non-agricultural sector, and household income levels assume different patterns according to the specific socio-economic (village) setting.
Key words: Egypt, rural household, income distribution, land, case study.
INTRODUCTION
One of the most important constraints hindering development in rural Egypt is the limited availability of irrigated land. The land in Egypt is fertile but scarce and densely populated, as it depends on the Nile River. With scarcely any rainfall and almost all of the population living along the Nile River, the population density in Egypt is one of the highest in the world. In addition, with continuing population growth combined with Islamic hereditary law, rural land in Egypt is increasingly fragmented.
One result is that land in rural Egypt continues to be the most influential determinant of the household income distribution (Adams, 2002)[i]. For example, Adams 2002) analyzed the household income distribution in rural Egypt based on a nationwide household survey conducted by the International Food Policy Research Institute in 1997 and found that overall inequality in rural Egypt was because of high levels of income inequality in the agricultural sector, largely through land ownership.
However, we should understand the survival strategy of rural Egyptian households in relation to the ocioeconomic settings that differ within rural Egypt. In fact, there are substantial regional variations in poverty and opportunities between and within Lower and Upper Egypt (Ghanem, 2014; World Bank, 2006)[ii]. For instance, Lokshin et al. (2010) revealed significant differences in the rate of growth and poverty dynamics between the two regions. In Upper Egypt, where most of the country’s rural poor live, household expenditure did not grow, despite thesignificant increase in average household expenditures in Egypt as a whole (Lokshin et al., 2010).Thus, the question outstanding for the future development of rural Egypt is: what are the mechanisms underlying income generation in each of the different possible socioeconomic settings? Egyptian villages are under the same condition of being constrained by land and water. Nonetheless, as the Sustainable Rural Livelihoods Framework (Scoones, 1998; 2009) suggests, the endowments of assets (human, financial, and physical and social capital) upon which rural Egyptian households build their livelihoods may differ within rural Egypt. However, because the available data have been limited to official statistics derived from nationwide sample surveys or agglomerated data at the village level, this issue has not yet been the subject of attention[iii].
In this paper, we employ household survey data and examine the income distribution pattern in three villages as a case study to shed light on the factors that influence income generation in rural Egypt. First, we apply decomposition techniques to pinpoint the contribution of farm and nonfarm income to overall household inequality. This is useful to analyze the contribution of different income types to income inequality in each village. Second, we use regression analysis to identify the role of different factors in determining the level of farm and nonfarm income.
The three villages included in this study were part of a 2007 survey and joint research project between the Graduate School of Economics at Hitotsubashi University and the Central Agency for Public Mobilization and Statistics (CAPMAS).[iv] The villages were from different regions within the Nile Basin: Central (or Southern) Lower Egypt, Middle Egypt, and Upper Egypt[v].
[i] There are many studies dealing with poverty and income distribution in rural Egypt, as rural poverty has been considered to be one of the most important social problems since the mid-20th century. Studies such as Abdel-Fadil (1975) and Radwan and Lee (1986) relate to the 1960s and 1970s. These share the view that land distribution is the core problem for income distribution and poverty in rural Egypt. From the 1980s, attention has focused on raising agricultural productivity through increasing agricultural technology, capital, and labor inputs as a means of improving household income (Dyer, 1997; Richards and Martin, 1983). However, the findings of these more recent studies largely agree with those of the 1960s and 1970s, in that land area remains the most important determinant of the rural income distribution.
[ii] UNDP Cairo Office (UNDP and INP, 2003) and Roushdy and Assaad (2007) identify the substantial disparities in the incidence of poverty, even between individual localities, especially in Upper Egypt, using poverty maps.
[iii] Recently, some raw data have become available from surveys such as the Income and Expenditure Household Survey conducted by CAPMAS, likely as part of changes relating to the democratic movement in Egypt since the 2011 revolution. See Verme et al. (2014).
[iv] The Graduate School of Economics at Hitotsubashi University conducted household surveys in 19 villages, including the three villages in this analysis. See the website for the Project for Database on Egyptian Socio-Economy (http://middleeast-asia.com/Egypt).
[v] For classification of the regions, see Iwasaki (2008) and Kato & Iwasaki (2011).
LITERATURE REVIEW
In rural Egypt, nonfarm employment currently accounts for most employment, and nonfarm employment opportunities continue to increase. However, the empirical evidence on the effect of nonfarm income on rural income inequality is mixed. In fact, a study in a 2006 World Bank report provides contrasting findings to that of Adams (2002). Adams (2002) found that nonfarm income reduces poverty and improves income distribution, because in Egypt where land is highly productive, the poor lack access to land and are thus “pushed” to work in the nonfarm sector. In the 2006 World Bank report, on the other hand, El-Laithy et al. (2003) concluded that households in Upper Egypt that earned higher incomes from nonfarm employment belonged to high-income classes, whereas the poor remained in the agricultural sector.
This contradictory result may be because of the heterogeneity of the nonfarm sector. According to the World Bank, nonfarm opportunities in Upper Egypt are not only limited but also narrow,undiversified, and skewed toward microenterprises (World Bank, 2006, pp. 10-11). Thus, as Sato (2003) pointed out for China, analyzing aggregate nonfarm income at the national level may fail to reveal the differential income–inequality effects according to the different socioeconomic settings.
Studies on other developing countries have shown that nonfarm income affects the rural income distribution pattern differently because the nonfarm activities are diverse (Lanjouw and Feder, 2001). For instance, Zhu and Luo (2006) found that self-employment income in China worsens income inequality, while wage employment has an equalizing effect on income distribution. Adams (2002) obtained similar results for Egypt. Conversely, Senadza (2011) indicated the opposite for rural Ghana, suggesting that nonfarm income increased income inequality. Elsewhere, Stifel (2010) found mixed results for rural Madagascar, mainly because low-income households tended to be engaged in low-return nonfarm activities. As Senadza (2011) noted, these findings perhaps confirm the existence of entry barriers in nonfarm activities. That is, because the poor lack the necessary human or financial capital, they predominantly engage in lower-skill casual wage employment; hence the inequality-reducing effect of wage income.
As for migration, while it is also widely agreed to influence nonfarm activity, there is no consensus on its impact on income distribution. In the case of rural Egypt, labor migration to the oil-producing Arab countries in the 1980s particularly attracted the attention of researchers, with studies such as Adams (1986; 1991) and Richards and Martin (1983) confirming the large revenues derived from emigration as a factor underlying improvements in the consumption levels of rural inhabitants. However, the case studies in this area provide divergent findings and no guidance as to the effect on income distribution.
Thus, it is critical to identify the availability and type of nonfarm employment opportunities, along with the human, financial and other capital that households possess, in order to understand better the rural household strategies used for income generation. In this regard, the sustainable livelihoods framework is a useful framework for analysis (DFID, 1999). This assumes that people may have access to five categories of assets (human, financial, physical, social, and natural) and combine these to achieve their objectives through livelihood strategies. Complex socio-institutional webs as well as the politico-economic environment in which they operate influence these strategies.
In the case of rural Egypt, all villages share a common natural context in that they are all dependent on the Nile River. However, they differ in many aspects, and each has its own unique characteristics. In the case of our three study villages (Abu Senita, Homa, and Awlad Sheykh), although all are dependent on the Nile River and have fertile but scarce land, they differ in terms of market access, sociopolitical environment, and human capital endowment. For example, Abu Senita has better human capital (in terms of the level of education) than the two other villages and has more nonfarm employment opportunities available in the locality or in nearby towns. Similar to Awlad Sheykh, Homa has a lower educational level but is located not far from Cairo. Finally, Awlad Sheykh is located in a remote area and has the least nonfarm employment opportunities nearby, but there are many village migrants abroad, as explained in detail later[i].
[i] As to the difference in the cultural context, as exemplified in family system, see Iwasaki (2006).
METHODOLOGY
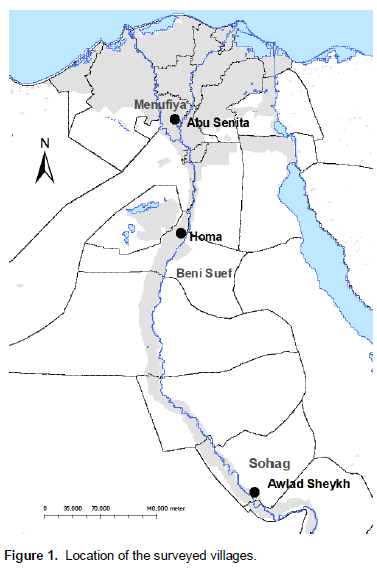
We selected these three villages for analysis following the advice of CAPMAS staff. The first criterion for selection was a medium or small population size so that the survey covers most of the households in the village. The second criterion was similarity to the average characteristics of the three regions (Lower, Middle, and Upper Egypt) based on the basic indicators available at the village level, notably age structure, employment, and educational level[i]. We did not select the villages to make the results of this study generalizable to rural regions as a whole but to be indicative of the income distribution in the specific rural Egyptian locales.
According to the 2006 population census, there are 4,408 villages in Lower and Upper Egypt, with an average population size of 9,253. Compared with this average population size, the three villages (Abu Senita, Homa, and Awlad Sheykh) share the common feature of being relatively small, with populations of just 5,376, 7,398, and 6,757 persons, respectively.
Household members are those declared as such by household heads. According to the CAPMAS definition, a household comprises members who had lived and eaten together in the same residence for more than six months during the 12 months prior to the survey (CAPMAS, 2006). Therefore, the definition of households is in terms of consumption. However, because we aim to study the income generation behavior of households, we prefer to define households as units of income pooling. We therefore include those members who were absent from the household for more than six months.
The randomly sampled number of households for each village is 600. For each household, CAPMAS staff interviewed the household head using the questionnaire[ii]. If the household head was absent because of migration abroad or some other reason, the spouse of the household head was interviewed. The numbers of household members are 2,743 persons for Abu Senita, 3,644 persons for Homa, and 3,068 persons for Awlad Sheykh. When members absent for more than six months are excluded, the corresponding figures are 2,683, 3,283, and 2,738, respectively. As discussed, according to the 2006 population census, the respective village populations are 5,376, 7,398, and 6,757 persons, respectively. Therefore, our survey covers 50.8, 43.2, and 42.3% of the population in the three villages, respectively. Among the population, the percentage absent for more than six months is 2.2% in Abu Senita, 9.9% in Homa, and 10.8% in Awlad Sheykh. Among the households, the percentage of households with one or more members absent for more than six months is 9.0% in Abu Senita, 44.2% in Homa, and 48.8% in Awlad Sheykh.
Table 1 summarizes the main socioeconomic characteristics of the three villages as drawn from the 2006 population census. As shown, the households in Abu Senita have a lower rate of dependency than the national rural average and Homa and Awlad Sheykh, as we can see from the proportion of the population aged under 15 years and 64 years or older. The population in Abu Senita has a generally higher educational level.
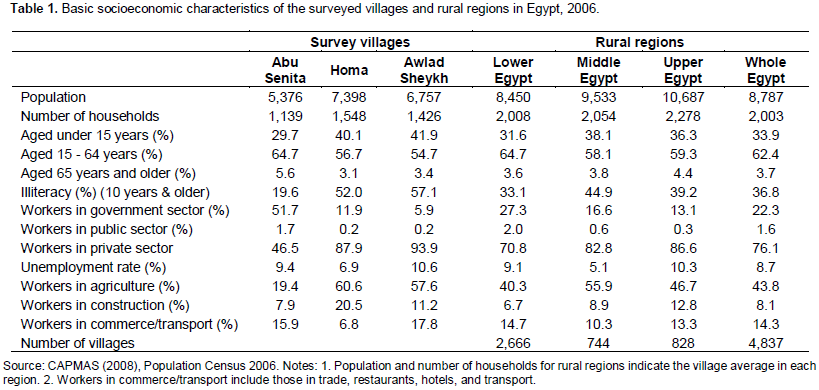
As for nonfarm employment, there are also differences between the three villages as to the volume as well as the type of nonfarm activities[i]. Nonfarm activities are much more common in Abu Senita than in other two villages. The main form of nonfarm employment is as an employee or schoolteacher in the government sector; that is, employees of government institutions in either the village itself or a local town. In the other two villages, agriculture is the main economic activity, nonfarm employment opportunities are fewer than in Abu Senita, and the male labor force in nonfarm activities chiefly comprise agricultural wageworkers and those employed in the private construction sector as temporary workers.
According to the household survey data, more than 80% of the private sector nonfarm workers in these two villages are construction workers working in the village, in a local town or in Cairo. In Homa, most work in Greater Cairo or in other Arab countries such as Jordan, Libya, Saudi Arabia and the UAE[ii]. In Awlad Sheykh, the labor force mainly comprises male agricultural workers and those working abroad in construction, especially in the UAE[iii]. Therefore, unlike Abu Senita, the urban unskilled labor markets within and outside Egypt play an important role in shaping the employment structure in these two villages. The proportions of agricultural wageworkers are also higher in Awlad Sheykh and Homa. In fact, agricultural wageworkers constitute between 29.7% (Homa) and 30.7% (Awlad Sheykh) of all wageworkers, compared with only 4.7% in Abu Senita.
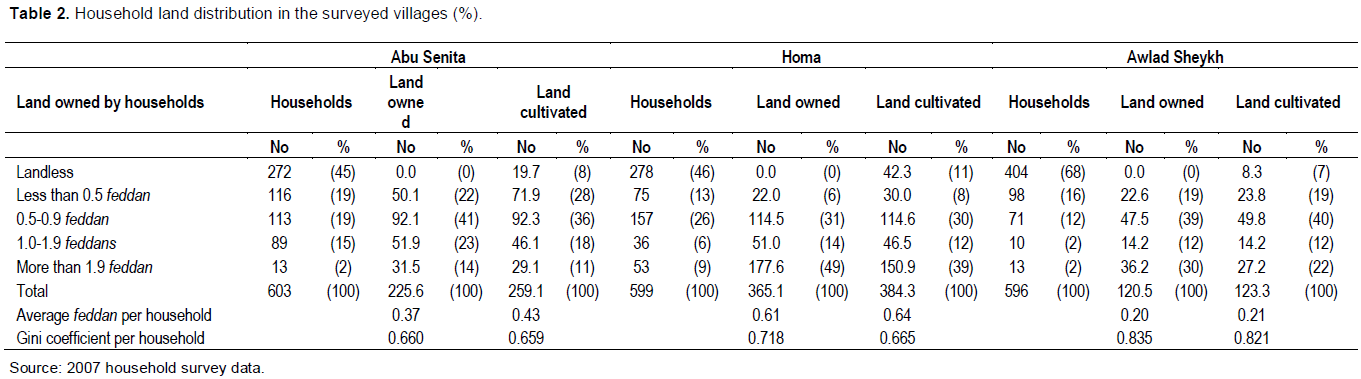
In terms of land distribution, the average area of cultivated land per household, including landless households is 0.4 feddans (1 feddan equals 0.42 hectares) in Abu Senita, 0.6 feddans in Homa and 0.2 feddans in Awlad Sheykh (Table 2)[iv]. The Gini coefficient of cultivated land per household is 0.66 for Abu Senita and Homa, and 0.82 for Awlad Sheykh. Thus, Awlad Sheykh has a very limited area of cultivated land owned by only 32% of the households compared with Homa, which has a larger area of land and more households who own land[v]. This severe land constraint alone may have pushed the households in Awlad Sheykh into nonfarm employment.
(1) Farm income. Farm income is gross agricultural revenue minus material costs. Gross agricultural revenue is the gross value of cash derived from agricultural activities including cultivation, livestock husbandry, forestry, and fishery. It includes the value of agricultural products consumed by the household.
(2) Nonfarm wage income. Nonfarm wage income is the sum of wages, bonuses and allowances received from employers such as government institutions and public and private enterprises. In this analysis, we further classify wage income into wage income from nonfarm and farm activities.
(3) Nonfarm self-employment income. The total value of net cash income (sales minus material costs) from nonfarm self-employment activities in commerce, manufacturing, construction, transportation, services, etc.
(4) Income from real estate.?This includes rental income from land,
apartments or buildings and other real estate. It also includes imputed rent (the estimated value of the property where the household rents).
(5) Financial income.?This is income derived from bonds, deposit interest from banks, post offices, “investment certificates,” etc.
(6) Other income.?Other income is mainly transfer income comprising retirement pensions, social security, social welfare payments to poor families, and private transfers from within Egypt or from abroad (gifts from relatives and money sent by migrants). In most cases, other income is from retirement pensions[i].
Based on the estimates of income implied by these definitions, Awlad Sheykh (4412 LE) (Livre Egyptienne or Egyptian pounds) has the highest per capita income among the three villages, followed by Abu Senita (3,338 LE) and then Homa (2,833 LE). According to the CAPMAS “Income and Expenditure Household Survey 2004/2005,” average per capita income for rural households was 2,372 LE (CAPMAS, 2006, p. 6). Therefore, the three villages have above-average household income levels for rural Egypt. Household incomes are particularly high in Awlad Sheykh, while those in Homa are similar to the average for rural Egypt.
The Gini coefficient of per capita income for Awlad Sheykh is the largest (0.395), whereas that for Abu Senita is the smallest (0.229), with Homa having an intermediate Gini coefficient (0.305). According to the UNDP Cairo Office’s “Egypt Human Development Report 2008,” the Gini coefficient of per capita GDP for rural Egypt (2004/2005) was 22.3 (UNDP, 2008, p.297). Therefore, although village- and aggregate-level comparisons are crude, it appears that the levels of income inequality in Abu Senita and Homa are about average, whereas Awlad Sheykh has a relatively high level of income inequality.
With regard to the sources of income, farm income represents less than 25% of all income in all three villages. The main source of income in the three villages is nonfarm wage income. However, its share of income varies greatly between the three villages. At 60% of total income, the proportion of nonfarm wage income is unusually high in Awlad Sheykh.
The Gini coefficient is probably the most intuitive measure of inequality, with its neat correspondence to the Lorenz curve and easy-to-interpret decompositions of the farm and nonfarm income effects. Following Lerman and Yitzhaki (1985), the Gini coefficient for total income inequality, G, is:
K
G = S Rk Gk Sk
K=1
where Sk is the share of component k in total income, Gk is the source Gini, corresponding to the distribution of income from source k, and Rk is the Gini correlation of income from source k with the distribution of total income.
Gini decomposition enables us to identify how much of any overall income inequality is because of a particular income source. It thus permits us to question whether an income source is inequality increasing or decreasing based on whether an enlarged share of that income source leads to an increase or decrease in overall income inequality. The influence of income component upon total income inequality can be decomposed to produce the following three easily interpreted terms:
a) how important the income source is with respect to total income (Sk),
b) how equally or unequally distributed the income source (Gk) is, and
c) whether the income source correlates with total income (Rk).
While Gini decomposition permits us to know whether an income component increases or decreases income inequality, it does not allow us to ascertain what factors contribute most to the inequality-increasing or inequality-decreasing effect in a given income component. One way of investigating this question is by conducting regression analysis to identify the factors that influence the participation of households in farm and nonfarm activities and the income derived from them.
The method used for the regressions is the two-step Heckman procedure[ii]. In our case, this is suitable because many households in our sample have no farm or nonfarm income. From the estimated probit equation, we compute the Inverse Mills Ratio, which is the expected value of the contribution of the unobserved characteristics to the decision to participate, conditional on the observed participation. This enables us to examine two dimensions together: whether the household selects farm or nonfarm activities; and if it does select these activities, how much household income changes as a result.
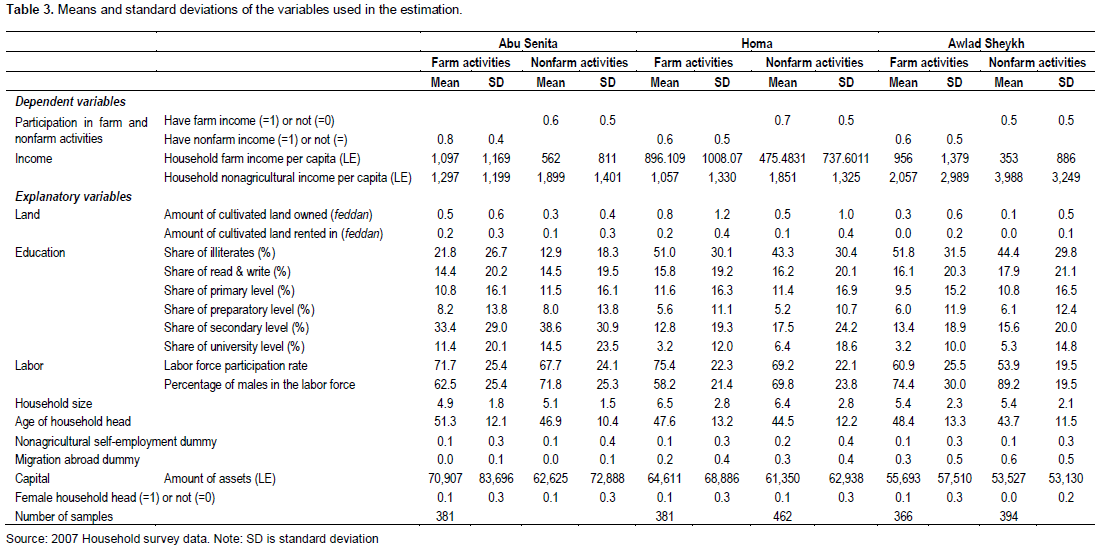
We assume that the capacities to participate in farm and nonfarm activities are determined by the household’s endowment in physical and human capital and by the environment where the household is located. As the focus of our study is on three villages, we omit the environmental factors and introduce the following independent variables in the participation equation (Table 3).
(i) Land holding (cultivated land). The cultivated land area of the land owned by the household and its squared value, or of the land rented out by the household, in feddans. For a rural household, land is the main form of physical capital. We consider it as exogenous[iii].
(ii) Human capital. The level of education of household heads and household members aged 10 years and older. We assume that households with a higher education level engage in more nonfarm activities and that human capital has an important effect on the level of nonfarm income.
(iii) Household structure and labor force. Gender of household head (female = 1, male = 0), household size (number of household members), labor force rate (ratio of labor force to total number of household members aged 15 years and older) and gender composition of the labor force (ratio of number of male workers to total number of workers). We define as workers household members who are at least 15 years old and in the labor force. In addition, we include the age of the head of household and its squared value to account for life cycle effects.
(iv) Employment structure. Engagement of the household member in nonfarm self-employment (having a member engaged in nonfarm self-employment = 1, otherwise 0)[iv].
(v) Emigration[v]. To control for the influence of emigration, we specify a dummy variable indicating whether household member (s) work outside Egypt (having an employed migrant abroad = 1, otherwise = 0).
(vi) Capital. Total amount (in Egyptian pounds) of assets including bank deposits, estimated price of nonfarm real estate, and other financial assets.
The probit model in the first stage of the estimation is:
Pr (y1) = f (x1, x2, …, e) (1)
where Pr(y1) is a participation dummy equal to 1 if a household engages in farm/nonfarm activity and 0 otherwise, x1 ??? are the variables specified in Table 3 and e is a normally distributed error term[vi].
In the second stage of the Heckman model, we use ordinary least squares (OLS) regression to estimate the determinants of farm and nonfarm income per capita, with the Inverse Mills Ratio as a control variable. This second-stage regression uses the same independent variables but excludes the age and gender of the household head and household size in the income equations to reduce the problem of collinearity[i]. The dependent variables are the logarithms of farm and nonfarm incomes per capita. Nonfarm income combines wage income and income from self-employment.
[i] The participation equation can have exactly the same regressors as the income equation and can therefore be collinear through inclusion of the Inverse Mills Ratio as a nonlinear function of the regressors. Therefore, the recommendation is to include variables that are not determinants of nonfarm income to enhance the identification of the Inverse Mills ratio in the second-stage regressions.
[i] The proportion of other income, comprising mainly retirement pensions, is high in Abu Senita. This village includes many government employees, and these are more likely to be covered by the retirement pension.
[ii] We also estimated a tobit model. However, we strongly rejected the null hypothesis of the normality of the error term in all regressions. Nonetheless, the signs and magnitudes of the estimates for the explanatory variables were similar to our main results.
[iii] Land is in most cases exogenous in the three villages because most of the farmers own the land through inheritance.
[iv] We removed the nonfarm self-employment dummy in some cases because of collinearity in the probit analysis and income equations. The estimated effect of this variable in the standard regression of overall household income equation is as follows. Nonfarm self-employment in the three villages behaves similar to nonfarm wage employment in the sense that households pushed off the land mostly do this type of work. The evidence is that the nonfarm self-employment dummy significantly negatively correlates with farm income. In addition, second only to the emigration dummy variable, the nonfarm self-employment coefficient is the largest in magnitude. This implies that nonfarm self-employment significantly affects nonfarm income.
[v] We estimate an OLS regression using the same variables and excluding migrant households. We conducted the probit analysis to consider the self-selection bias problem through which households divide themselves into migrant or nonmigrant households, using a dummy variable indicating whether the household has a migrant as a dependent variable and the characteristics of the households available in the data set (land size, education, and age) as independent variables. Even though the probit analysis yielded unsatisfactory results, this estimation yielded similar results to the main analysis.
[vi] We checked the variables used in both stages for normality using the coefficient of kurtosis and skewness and variance inflation factors (VIFs) to test for multicollinearity. By convention, if the value of a VIF is greater than 10, the variables are highly collinear. We employed Breusch–Pagan/Cook–Weisberg tests to test for heteroscedasticity.
[i] The proportion of households engaged in nonfarm activities is 58.5% in Abu Senita, 42.1% in Homa, and 61.5% in Awlad Sheykh, based on an estimation of working days/year in farm and nonfarm activities.
[ii] Of those working in the nonfarm sector, 37% work in Greater Cairo, 8% in Jordan, 5% in the UAE, 4% in Saudi Arabia, and 3% in Libya.
[iii] Of those working abroad in Awlad Sheykh, 60% work in the UAE, 19% in Saudi Arabia, and 10% in Kuwait. According to the villagers, most of those in the UAE work in Abu Dhabi. Migration to Abu Dhabi started in the early 1980s and increased following the Gulf War. Although the number of migrants decreased after 9/11, many continue to work in Abu Dhabi.
[iv] According to Adams (2002), the average area of land per household for rural Egypt is 0.43 feddans. Therefore, relative to rural Egypt as a whole, Abu Senita household land areas are at the average, Homa households are above average and Awlad Sheykh are below average.
[v] Moreover, in contrast to Abu Senita, whose land is owned mostly by small peasants of less than 1 feddan, the 49% of the land in Homa is owned by 9% of the households having 2 feddans or more land.
[i] In addition, we collected the histories of the candidate villages in order to discern the type of village, especially whether they were ‘qarya’ (natural villages) or ‘izba’ (historically large landowners’ villages). The three villages dealt in this article are of the ‘qarya’ type.
[ii] The multipurpose questionnaires included sections on education, employment, agriculture including livestock, nonfarm enterprises, housing, agriculture, household expenditure, assets, and attitudinal questions.
[i] Prior to the land reforms of the late 1950s, half of the land in the village belonged to a large landowner living in Cairo. However, following the land reform, most inhabitants are either small farmers or landless.
[i] The participation equation can have exactly the same regressors as the income equation and can therefore be collinear through inclusion of the Inverse Mills Ratio as a nonlinear function of the regressors. Therefore, the recommendation is to include variables that are not determinants of nonfarm income to enhance the identification of the Inverse Mills ratio in the second-stage regressions.
EMPIRICAL RESULTS
From a decomposition analysis based on the pseudo-Gini coefficient, the components of total income have the following characteristics (Table 4). To start with, according to the pseudo-Gini coefficient, farm income is unequally distributed in Abu Senita. The pseudo-Gini coefficient for other income (mainly retirement pensions) is also high. These values imply that farm income and social security allowances have much more influence than the other components on overall income inequality in Abu Senita.
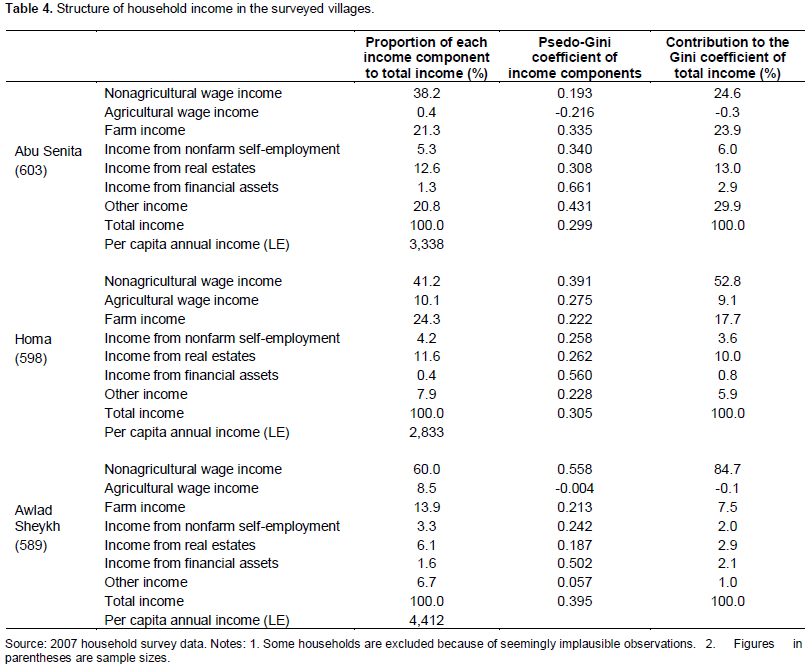
Homa and Awlad Sheykh have contrasting income distribution patterns to Abu Senita. Their nonfarm wage incomes are extremely unequally distributed. Moreover, in Homa and especially Awlad Sheykh, the percentage contributions to overall income inequality are extremely high. This implies that overall income inequality is mainly the result of an unequal distribution of nonfarm wage income.
Because emigration could affect the income distribution patterns described in the previous section, in this section, we exclude migrant households before comparing the household income level and structure across the three villages.
Migrant households constitute households in which one or more members work outside Egypt as wage earners. Wage earners working abroad account for 24.4% (Homa) and 64.1% (Awlad Sheykh) of all wage earners, including agricultural wage laborers. The proportions of households with members working abroad are 0.3% in Abu Senita, 19.9% in Homa and 42.8% in Awlad Sheykh. The percentage shares of the wages of these migrant household members in household wage income are 1.5% in Abu Senita, 48.3% in Homa, and 83.9% in Awlad Sheykh. Therefore, emigration is a unique source of nonfarm wage employment and income, especially in Awlad Sheykh.
Table 5 reports the estimation of the income levels excluding migrant households. It shows that the level of household income decreases and the Gini coefficient falls when we exclude migrant households. This change is particularly remarkable in Awlad Sheykh. As a result, the household income level in Awlad Sheykh becomes much lower than in Abu Senita. Therefore, emigration contributes greatly to raising household income. We draw two findings from the Gini coefficients of total income when excluding migrant households.
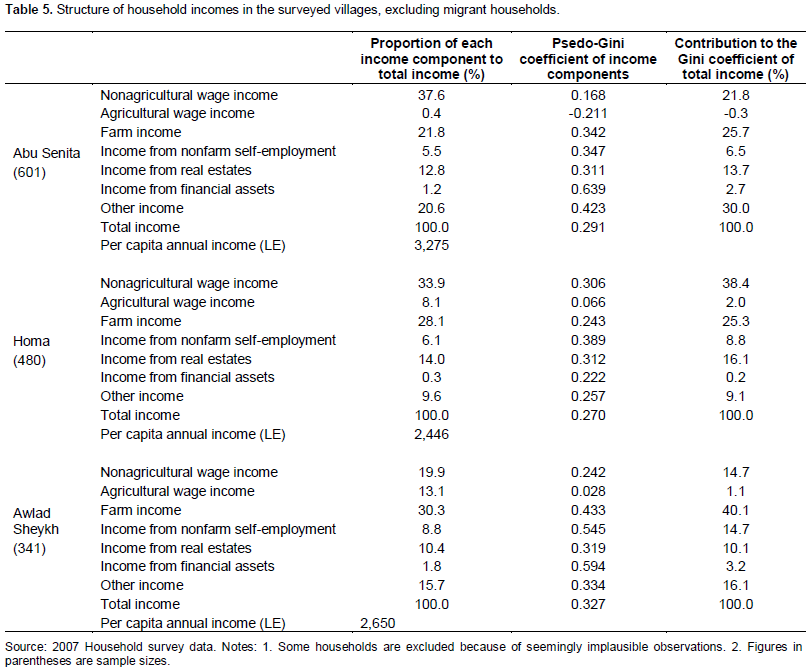
One is that because the Gini coefficients for Homa and Awlad Sheykh decline, emigration contributes to increasing household income inequality. The second is that the Gini coefficient for Awlad Sheykh remains high when we exclude migrant households. This implies that Awlad Sheykh would have high-income inequality, even without emigration. By contrast, income inequality in Homa would be lower without emigration.
The decomposition analysis based on the pseudo-Gini coefficients reveals the following. As previously pointed out, nonfarm wage income is the single most important source of income contributing to overall income inequality. However, when excluding migrant households from the analysis, nonfarm wage income contributes to decreasing income inequality. By contrast, farm income contributes to increasing income inequality in Awlad Sheykh. The change in the pseudo-Gini coefficient of nonfarm wage income for Homa is therefore not as marked as that for Awlad Sheykh.
As explained in the previous section, one reason for this difference between Homa and Awlad Sheykh is that migrant households tend to be landless in Awlad Sheykh and landowners in Homa. Hence, excluding migrant households could result in an overestimation of income inequality in Awlad Sheykh and an underestimation in Homa. However, judging from the pseudo-Gini coefficient of farm income, although its evaluation is difficult, we consider inequality in farm incomes as the most important contributor to overall income inequality in Awlad Sheykh. This is not the case for Homa.
This dissimilarity relates to the difference in the distribution of nonfarm wage incomes between the three villages. In fact, the pseudo-Gini coefficient of nonfarm wage income is smaller than that of total income in all three villages. However, closer examination of nonfarm wage income reveals considerable differences in the income structure in all three villages. The share of nonfarm wage income is largest in Abu Senita, but its pseudo-Gini coefficient is extremely small. By contrast, in the absence of migrant households, Awlad Sheykh has a low share of nonfarm wage income. Even when excluding migrant households, Homa has almost the same share as Abu Senita, but its pseudo-Gini coefficient is higher than that of Abu Senita.
The question is: why is there more uneven distribution of nonfarm wage income in Homa and Awlad Sheykh than in Abu Senita, even when we exclude migrant households? One reason could be that the predominant form of nonfarm employment is government employment in Abu Senita but private sector employment in Homa and Awlad Sheykh, as explained in the previous section.
Table 6 details the farm and nonfarm wage distributions by income category, excluding migrant households. In Abu Senita, income from the government sector accounts for a large share of nonfarm wage income. Although this is also true of Homa and Awlad Sheykh, the share is particularly high in Abu Senita, especially among low-income households.
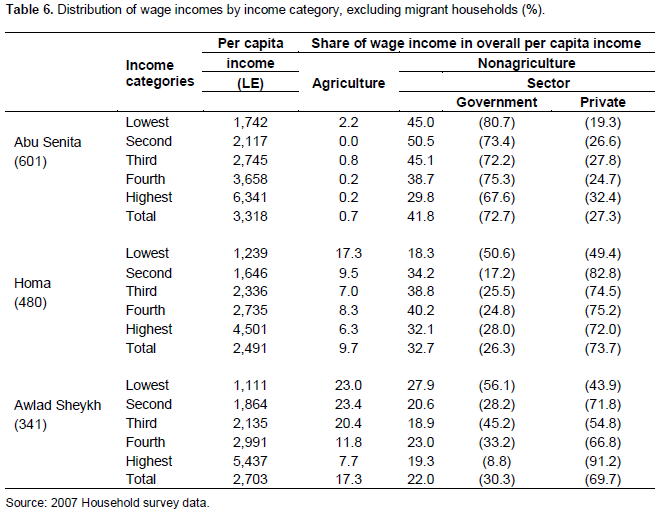
Another reason, specifically for Homa, is that even the households with higher incomes tend to rely on nonfarm activities as their main source of income. This is not the case for Abu Senita and Awlad Sheykh when excluding migrant households. In these two villages, households with higher incomes rely on farm income, whereas those with low incomes survive by undertaking nonfarm activities, such as government employees in Abu Senita and agricultural wageworkers or construction workers in Awlad Sheykh.
In this subsection, we first examine the determinants of household participation in farm and nonfarm activities. We then turn our attention to the determinants of income in each of these activities. Tables 7 and 8 present the results of the household participation probit regressions.
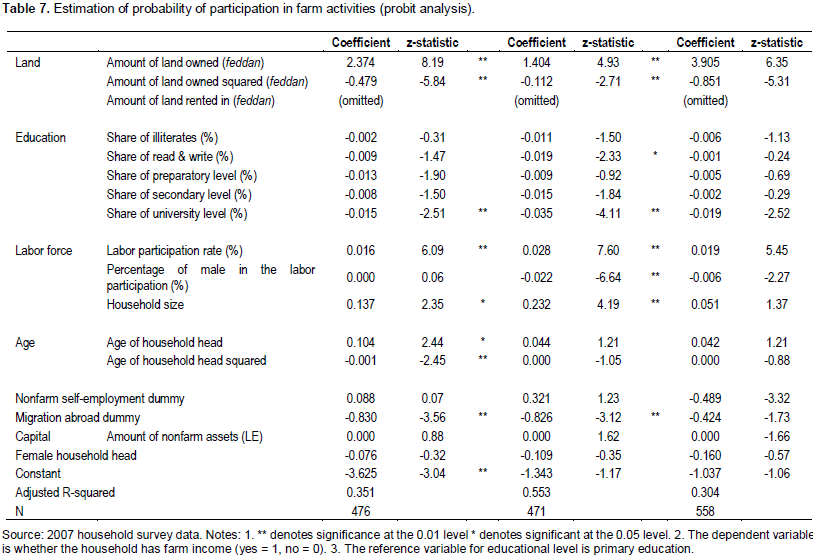
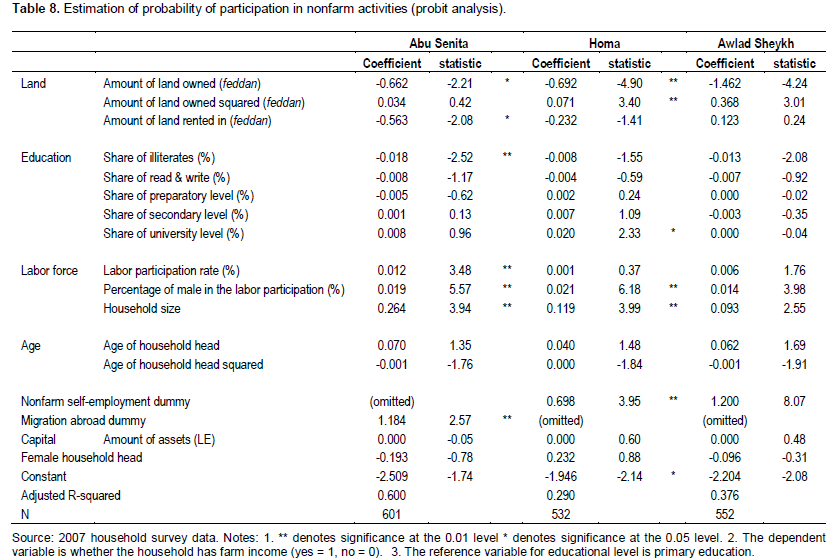
We find that household land area plays a positive role in participation in farm activities, and a negative role in participation in nonfarm activities in all of the three villages. With a 1 feddan increase in land, the probability of participating in nonfarm activities decreases by 66.2% in Awlad Sheykh, 69.2% in Homa, and 146.2% in Awlad Sheykh. As the estimated coefficient for land is much larger than that for human capital and the labor force, it is clear that access to land is the most determinant factor for participation in farm activities and for encouraging households to look for alternatives to farming-only. It plays an especially strong role as a pull-and-push factor for farm and nonfarm activities in Awlad Sheykh, as its coefficient is higher than the other two villages (390.5% higher for farm activities and 146.2% higher for nonfarm activities).
However, the estimated coefficient for the square of land area is significant and negative for participation in farm activities, and vice versa for nonfarm activities, inferring an inverted U-shaped relation between land area and farm activities. This means that households in the highest income category earn income both by renting out their land and by performing nonfarm activities.
We also observe that the coefficient for land area owned is lower in Homa than in the other two villages (140.4% for farm and 69.2% for nonfarm). This conforms to the observation in the previous section that households in Homa in the higher income categories earn nonfarm income. One possible explanation is the low return of land as shown later in the farm income equation. Because land in Homa generates relatively little farm income, Homa households have a relatively strong incentive to take up nonfarm activities.
The results also indicate that education influences the choice of participation in farm and nonfarm activities. In fact, the share of university-level education is negatively and significantly associated with participation in farm activities in all three villages. If the household has more members with a university education, the probability of participation in farm activities decreases by 1.5% in Abu Senita, 3.5% in Homa, and 1.9% in Awlad Sheykh. However, these are not statistically significant, with the exception of Homa, which has a weak coefficient of 2%.
Regarding the effect of life cycle as measured by the age of the household head, this is positively and significantly associated with participation in farm activities in Abu Senita, with an additional year of age of the household head increasing the probability of participating in farm activities by 10.4%. This implies that farm activity is largely a life cycle phenomenon, commenced at an older age after performing nonfarm activities. We do not observe this same pattern in the two other villages, as the estimated coefficients for the age of the household head is not statistically significant. One possible interpretation is that there are more nonfarm employment opportunities, specifically in the government sector, in Abu Senita, so that the household heads commence farm activities only when they reach retirement age or when inheriting land from their fathers. The age of the household head is not associated with participation in nonfarm activities, because these can start while the household member is living with a father who is the household head.
The probability of participation in both farm and nonfarm activities increases with labor, as the estimated coefficients for both labor force rate and household size are positive and statistically significant. The estimated coefficients for the percentage of males in farm labor participation are negative and statistically significant in both Homa and Awlad Sheykh (-2.2 and -0.6%, respectively). This suggests that any additional agricultural labor input is mainly female. This reflects the clear gender division of labor in these two villages, as widely observed in Upper Egypt; men engage in nonfarm activities, and women engage in farm activities.
As expected, migration abroad is highly correlated with participation in farm activities, with the associated probability of participation in farm activities decreasing by 83% in Abu Senita, 82.6% in Homa, and 42.4% in Awlad Sheykh. Nonfarm self-employment also has a significantly negative effect on participation in farm activities in Awlad Sheykh, with the probability decreasing by -48.9% if a household engages in nonfarm self-employment.
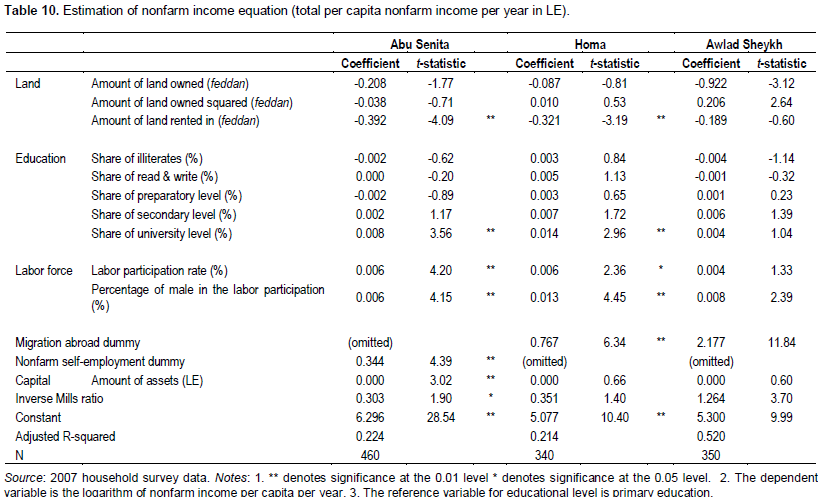
Tables 9 and 10 present income regressions for farm and nonfarm activities, respectively. The samples used in each of the regressions include only households engaged in the activity, so they allow us to assess which factors are associated with higher or lower income within each activity. In each case, we control sample selection bias by including the Inverse Mills Ratio computed from the corresponding participation equation shown in Table 3 as an additional regressor.
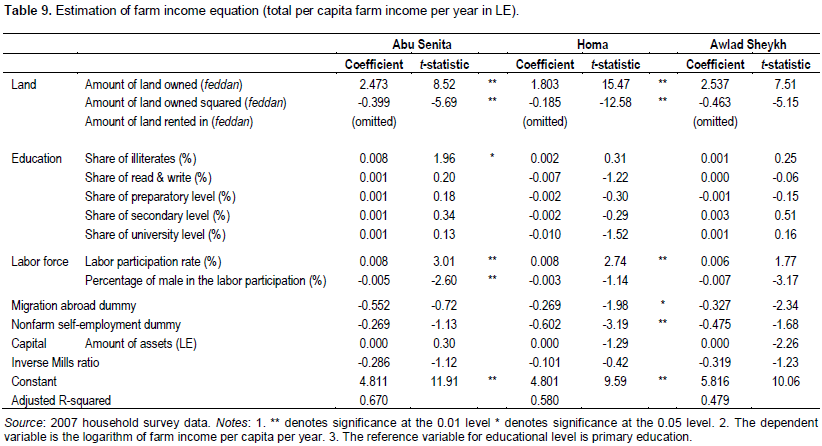
We find that the amount of cultivated land owned has a strongly positive correlation with household income in the three villages. With the exception of migration abroad, land displays the highest coefficient in the income equations[i]. The coefficient for land owned displays the magnitude of the effect of land, such that in Abu Senita and Awlad Sheykh, the addition of 1 feddan of land increases farm income by 237 and 391%, respectively. This result is identical to Adam’s (2002) finding that land is important for income distribution in rural Egypt. However, the coefficient for land area differs between the three villages. In fact, it is much lower in Homa than in the other two villages, such that the addition of 1 feddan land increases farm income by only 140% in Homa. This may relate to Homa’s relatively low level of productivity, which may be because of differences in cropping patterns or water scarcity[ii].
Land area, either owned or rented, is uncorrelated with nonfarm income, except for Awlad Sheykh. In Awlad Sheykh, a 1 feddan increase in land decreases nonfarm income by 92%. This reflects the strong effect of land on whether households take up farm or nonfarm activities, as mentioned in the results of the participation equation.
The estimated effects of the labor force rate and the gender composition of the labor force are as expected, as in the results for the participation equation. The level of education has no significant effect on farm income but significantly positive effects on nonfarm income in Abu Senita and Homa. However, the coefficient for the household share of education at a university level is very low. Being a university graduate increases nonfarm income by only 0.8% in Abu Senita, 1.4% in Homa, and only 0.4% and statistically insignificantly in Awlad Sheykh. This may be because the opportunity for nonfarm employment with high educational return is very limited in village[iii], where the labor force is relatively homogeneous and mostly employed in construction, which has low entry barriers.
Having a migrant in a household has an extremely important effect on nonfarm income. If a household has a migrant abroad, nonfarm income increases by 76.7% in Homa and 218% Awlad Sheykh. It has a lower effect in Homa, which may relate to the differences in the places of emigration. In fact, migrants in Homa tend to work in Jordan and Libya, where we assume that they earn a lower wage than in the UAE, where the majority of migrants from Awlad Sheykh work. Nonfarm self- employment greatly influences nonfarm income in Abu Senita. In fact, it is the highest income-generating factor, raising nonfarm income by 34.4% if the household is engaged in nonfarm self-employment.
The Inverse Mills Ratio reflects the correlation between the unobserved terms in the participation and the income equations. We first note that the coefficient on the Inverse Mills Ratio in the nonfarm income equation is not significant. Therefore, selectivity is not present, so we could safely estimate this equation without the Inverse Mils Ratio. However, the Inverse Mills Ratio in the nonfarm income equation is significant and positive in Abu Senita and specifically in Awlad Sheykh. Given that the Inverse Mills Ratio is inversely related to the selection criterion to “participate in nonfarm activities,” the negative effect thus implies that these participating households have lower nonfarm income than a purely farming household.
[i] We also confirm land area having the largest coefficient in the OLS regression result for overall household income using the same variables in the farm and nonfarm income equations.
[ii] Farmers in Homa sell wheat and maize but not vegetables, as in Awlad Sheykh.
[iii] Among the household members working at the time of the survey, those with a university-level education represented 28.4% of the working population in Abu Senita, 9.4% in Homa, and 9.6% in Awlad Sheykh. Among these, 71.0% in Abu Senita, 53.2% in Homa, and 54.6% in Awlad Sheykh worked in the government sector, as a primary school teacher, or as a local administration (agricultural cooperative, local administration office, health center, etc.) employee.
DISCUSSION
This paper examined household income structure and its determinants in three villages as a case study of household income distribution in rural Egypt. A question is why farm income is so unevenly distributed and why it makes such a large contribution to overall income inequality in Abu Senita and Awlad Sheykh when we excluded migrant households.
The results confirm the findings of Adams (2002) that land assets continue to be the major determinant of household incomes in rural Egypt. In fact, the land distribution is highly unequal in all three of the villages that we examined, and as a result, landholders form the high-income classes, whereas landless households, forced into the nonfarm sector, comprise the low-income classes. The observed income distribution pattern in the three villages confirms that access to land, as Adams (2002) has argued, is the key determinant of income in a land-scarce labor-rich setting.
However, the extent of this effect differs between the three villages according to the level of nonfarm employment opportunities[i]. Opportunities for nonfarm wage employment are best in Abu Senita, followed by Homa, and worst in Awlad Sheykh, excluding migration abroad. However, it is the type of market development that most affects the pattern of income distribution. In Abu Senita, where most of the labor force works in the govern- ment sector, incomes are quite equally distributed. Government employment is the largest source of income, and this contributes greatly to reducing income inequality in Abu Senita.
In Homa, private sector income constitutes the main source of nonfarm wage income. However, the distribution of this income is highly unequal, likely because there are more households in the high-income category engaged in nonfarm activities. Another reason is the linkage between employment in Homa and Cairo’s unskilled construction labor market. In general, the income distribution of private sector employment is more unequal than government sector income because it involves much more diverse activities, in that the labor and other resource requirements and returns are in no way homogeneous[ii].
Awlad Sheykh has the fewest nonfarm employment opportunities, and hence, the ownership of land largely determines the income structure (in the absence of outward migration). In addition, our analysis confirms the importance of emigration for rural income distribution. In fact, emigration contributed to leveling out household income levels in Homa and especially Awlad Sheykh. In Awlad Sheykh, emigration contributed to lowering income inequality, and this more than offsets the effect of land assets on income distribution. This is because most migrant households are landless, and the income generated from emigration is relatively high.
[i] The structure of the agricultural sector could also explain the differences in the income distribution between villages. For example, irrigation systems differ in Delta, Fayoum and Upper Egypt (Mehanna, Huntington and Antonius, 1984). Regional differences in cropping patterns between the Northern Delta, the Southern Delta, Cairo, Middle Egypt, Fayoum, Upper Egypt and the Frontier governorates (Richards, 1982, p. 209) lead to regional differences in agricultural productivity (Esfahani, 1988). For regional differences relating to land distribution, which is a historical issue, see, for example, Dyer (1997).
[ii] The Gini coefficients of nonfarm wage income excluding migrant households are 0.89 in Abu Senita, 0.93 in Homa and 0.95 in Awlad Sheykh.
CONCLUSION
In summary, this paper found that there is no simple correlation between the development of the nonfarm sector, land distribution, and household income in rural Egypt. Although land plays a crucial role throughout rural Egypt because of dependence on the Nile, the mechanisms behind income generation and income distribution differ according to the specific socioeconomic setting. If there is no opportunity for nonfarm activity in a land-scarce and labor-abundant setting, and if outward migration is absent, income distribution will be determined solely by land ownership and therefore quite unequal. If the development of the nonfarm sector takes place in the government sector, as in Abu Senita, income distribution is much more egalitarian. However, given the current economic orientation of a liberal economy, this is unlikely to develop. If land has little effect on income generation, and nonfarm opportunities are limited to sectors with low entry barriers, such as the construction sector in Homa, income distribution may also be equal but associated with low household income.
With regard to the issue of poverty, which is beyond the scope of this article, the findings here suggest that the reduction of poverty depends upon the volume of nonfarm opportunities. This is because as Adams (2002) pointed out for Egypt as a whole, poor households mainly participate in nonfarm activities in rural Egypt. However, it remains unclear whether poor households benefit from nonfarm opportunities in the same way across rural Egypt, the poorest households typically being agricultural wageworkers as in Homa and Awlad Sheykh. This could be one of the possible reasons accounting for the difference in poverty trends in Lower and Upper Egypt.
In future research, it would be necessary to conduct additional case studies in other villages with unlike socioeconomic settings in order to develop these arguments on the relationship between land, nonfarm opportunities, and income in rural Egypt, and to identify different policies for pro-poor development in rural Egypt.
CONFLICT OF INTERESTS
The author has not declared any conflict of interests.
REFERENCES
|
Abdel-Fadil M (1975). Development, Income Distribution and Social Change in Rural Egypt (1952-1970): A Study in the Political Economy of Agrarian Transition. London: Cambridge University Press. |
|
|
|
|
|
Adams. Jr. RH (1986). Development and Social Change in Rural Egypt. Syracuse, NY: Syracuse University Press. |
|
|
|
|
|
Adams. Jr. RH (1991). The Effects of International Remittances on Poverty, Inequality, and Development in Rural Egypt (Research Report). Washington DC: International Food Policy Research Institute. View. |
|
|
|
|
|
Adams RH Jr (2002). Nonfarm Income, Inequality, and Land in Rural Egypt. Econ. Dev. and Cul. Change, http://dx.doi.org/10.1596/1813-9450-2572 50(2):339-363. |
|
|
|
|
|
CAPMAS (2006). Income, Expenditure & Consumption Survey 2004/2005, September. |
|
|
|
|
|
CAPMAS (2008). Population Census 2006. September. (in Arabic) |
|
|
|
|
|
Datt G (2005). Poverty in Egypt: Modeling and Policy Simulations. Econ. Dev. and Cul. Change, http://www.jstor.org/stable/10.1086/425224, 53(2):327-346 |
|
|
|
|
|
DFID (Department for International Development) (1999). Sustainable Livelihoods Guidance Sheets. View. |
|
|
|
|
|
Dyer G (1997). Class, State and Agricultural Productivity in Egypt: Study of the Inverse Relationship between Farm Size and Land Productivity. London: Frank Cass. |
|
|
|
|
|
El-Laithy H, Lokshin M, Banerji A (2003). Poverty and Economic Growth in Egypt, 1995-2000 (World Bank Policy Research) (June) http://dx.doi.org/10.1596/1813-9450-3068 Working p. 3068. |
|
|
|
|
|
Esfahani H S (1988). Aggregate Trends in Four Main Agricultural Regions in Egypt, 1964-1979. Inter. J. Mid. E. Stud. 20(2):135-164. http://dx.doi.org/10.1017/S0020743800033900 |
|
|
|
|
|
Ghanem H (2014) Improving Regional and Rural Development for Inclusive Growth in Egypt, Global Economy and Development at Brooklyn (Working Paper 67) (January). View. |
|
|
|
|
|
Iwasaki E (2006). What is Aila? The Comparative Analysis of Kinship Structure in Egyptian Villages. AJAMES (Annals of Japan Association of Middle East Studies), 22(2):125-148. |
|
|
|
|
|
Iwasaki E (2008). Regional Categorization of Egypt by Income Level, Employment and Education. Ajia Keizai (Asian Studies), 49(9):22-44. Tokyo: Institute of Developing Economies (in Japanese). View. |
|
|
|
|
|
Kato H, Iwasaki E (2011). Village Map in Egypt. Hitotsubashi Economics, 4(1):173-211. Tokyo: Hitotsubashi University (in Japanese). View. |
|
|
|
|
|
Lanjouw P, Feder G (2001). Rural Non-Farm Activities and Rural Development: From Experience Towards Strategy. Rural Development Strategy Background The World Bank. http://www-wds.worldbank.org/servlet/WDSP/IB/2001 p.4 |
|
|
|
|
|
Lerman R, Yitzhaki S (1985). Income Inequality Effects by Income Source: A New Approach and Application to the U.S . Rev. of Econ. Iwasaki 29 Stat. 67(1):151-156. |
|
|
|
|
|
Lokshin M, El-Laithy H, Banerji A (2010). Poverty and Economic Growth in Egypt, 1995-2000. J. Afr. Stud. Dev. 2(6): 150-165. |
|
|
|
|
|
Mehanna S, Huntington R, Antonius R (1984). Irrigation and Society in Rural Egypt. Cairo Papers in Social Science 7 (Monograph 4) Cairo: American University in Cairo. |
|
|
|
|
|
Radwan S, Lee E (1986). Agrarian Change in Egypt: An Anatomy of Rural Poverty. London: Croom Helm. |
|
|
|
|
|
Richards A (1982). Egypt's Agricultural Development, 1800-1980: Technical and Social Change. Boulder, CO: Westview Press. |
|
|
|
|
|
Richards A, Martin PL (Eds.) (1983). Migration, Mechanization, and Agricultural Labor Markets in Egypt. Boulder, CO: Westview Press. |
|
|
|
|
|
Roushdy R, Assaad R (2007). Poverty and Geographic Targeting in Egypt: A Poverty Mapping Exercise (Working Paper No. 0715). Cairo: Economic Research Forum. |
|
|
|
|
|
Sato H (2003). The Growth of Market Relations in Post-Reform Rural China. London and New York: Routledge Curzon. |
|
|
|
|
|
Scoones I (1998). Sustainable Rural Livelihoods: A Framework for Analysis. (IDS Working) Brighton: Institute of Development Studies. (https://www.staff.ncl.ac.uk/david.harvey/AEF806/Sconnes1998.pdf). Pp.72 |
|
|
|
|
|
Scoones I (2009). Livelihoods Perspectives and Rural Development. J. of Peas. Stud. 36(1):171-196. http://www.informaworld.com, DOI: 10.1080/03066150902820503 |
|
|
|
|
|
Senadza B (2011). Does Non-farm Income Improve or Worsen Income Inequality? Evidence from Rural Ghana. Afr. Rev. Econ. Fin. 2(2):104-121. View. |
|
|
|
|
|
Stifel D (2010). The Rural Non-farm Economy, Livelihood Strategies and Household Welfare. Afr. J. Agr. Res. Econ 4(1):82-109. View. |
|
|
|
|
|
United Nations Development Programme (UNDP) and Institute of National Planning (INP) (2003). Egypt Human Development Report. Kalyoub (Egypt): Commercial Press., United Nations Development Programme (UNDP) and Institute of National Planning (INP) (2008). Egypt Human Development Report 2008. Kalyoub (Egypt): Commercial Press. pp.297 |
|
|
|
|
|
Verme P, Milanovic B, Al-Shawarby S, El Tawila S, Gadallah M, El-Majeed EAA (2014). Inside Inequality in the Arab Republic of Egypt. A World Bank Study. Washington DC: The World Bank. http://dx.doi.org/10.1596/978-1-4648-0198-3 |
|
|
|
|
|
World Bank (2006). Arab Republic of Egypt, Upper Egypt-Challenges and Priorities of Rural Development (Report No. 36432-EG) (June 15). World Bank. World Development Indicators. View. |
|
|
|
|
|
Zhu N, Luo X (2006). Nonfarm Activity and Rural Income Inequality : A Case Study of Two Provinces in China. World Bank Policy Research Working World Bank. View. License: CC BY 3.0 Unported. Pp. 3811. |
|
Copyright © 2024 Author(s) retain the copyright of this article.
This article is published under the terms of the Creative Commons Attribution License 4.0


