Review
ABSTRACT
In 2001, the RAND Corporation´s Science and Technology Policy Institute created an Index of Science and Technology Capacity for the World Bank, which ranked 150 countries on their potential to innovate and collaborate with more scientifically advanced nations. At that time, the African nation that ranked highest on the list was Mauritius, at number 59, and of the bottom 20 countries, 14 were African. In the ensuing years, some African nations have posted their highest growth rates in several decades, and institutional change has begun to take its root in some parts of the continent. Have these changes had any effect on the scientific and technological capacity of African nations? This paper replicates the RAND Index to 2011 to answer this question, and suggests which African nations might be best poised to move forward technologically in coming decades.
Key words: Science and technology capacity, development, Africa.
INTRODUCTION
What drives growth and development? In search of an answer to this question, researchers have explored macroeconomic and institutional factors in depth since the early 20th century to try to identify the keys to sustained economic growth. In recent years, both researchers and policymakers have turned increasing attention to a third factor that may play a role in development, which is the science and technology capacity of countries. Science and technology (S&T) capacity has been shown to be closely linked to variations among countries in productivity. Countries with a larger S&T capacity generally tend to be the most prosperous and most industrialized. They also tend to be more politically stable, often with functioning democratic systems; and they provide high-quality employment for their best talent, which helps to stem the brain drain and bolster the country´s human capital. Clearly, S&T capacity has a role to play in the development process of the world´s lagging and emerging economies, and in maintaining technological competitiveness in the most developed ones.
What constitutes S&T capacity, and how can different countries be compared? One effort to answer this question is the S&T index developed by the RAND Corporation for the World Bank in 2001, in the context of a study on collaborative research. This index ranked most countries in the world according to their S&T capacity, into scientifically advanced countries, scientifically proficient countries, scientifically developing countries and scientifically lagging countries. The 22 countries which they identified as scientifically advanced accounted at that time for 90-95% of all research and development (R&D) spending in the world, or some $450bn per year (Wagner et al., 2001).
In the interim since this index was published, the process of globalization has intensified, a group of emerging economies have experienced unprecedentedly high Gross Domestic Product (GDP) growth rates, and the developed countries have suffered their worst economic crisis since the 1930s. Have these events changed the ranking of countries in the world by S&T capacity? Has very fast growth in some emerging economies helped them to narrow the gap with developed countries? Most importantly, are there signs among the poorest nations, particularly in Africa, of an emerging S&T capacity that will underpin their development processes? This report attempts to answer these questions.
The outline of the paper will be as follows. First, the original S&T index developed by RAND Science and Technology for the World Bank (Wagner et al., 2001) will be described and critiqued. Second, an updated version of their index with 2011 data will be presented in two versions: one with the same variables, and one that adjusts the original variable for country size. Finally, the new rankings, in which many emerging nations and some African countries move up, will be discussed, and a leading indicator will be proposed to help identify the nations that are poised to advance in S&T capacity in coming years. While African nations are still far behind and most remain near the bottom of the list, countries like Morocco, Algeria, Nigeria, Botswana, Mozambique, Ethiopia, Sudan and Libya had advanced in the ranking by 2011. This may give some clues as to which nations on the continent could develop most quickly and take larger economic strides in the decade to come.
SCIENCE AND TECHNOLOGY AND DEVELOPMENT
Development economists for years have sought to identify the specific factors that drive sustained economic growth. Early researchers proposed that growth was a function of capital and labor inputs (Harrod-Domar model from Harrod, 1939 and Domar, 1946). The discovery of the “residual” in growth accounting in the 1950s pointed up the fact that measures of conventional inputs such as capital and labor failed to fully explain observed outputs such as GDP. Economists embraced the explanation that progress came not only from improvements in the quality and quantity of labor and capital, but also from unmeasured sources of efficiency and technical change, which in turn proceeded from formal and informal R&D spending and the unmeasured contributions of science and other spillovers (Griliches, 1994). In most recent years, research has turned to the role of institutions and governance in promoting economic development, specifically whether those institutions facilitate and encourage factor accumulation, innovation and the efficient allocation of resources (Acemoglu et al., 2004).
Interest in the role of science and technology capability in development has intensified in recent years.
Successive researchers have identified and quantified the links between S&T inputs and economic outcomes for advanced economies, beginning with the groundbreaking work of Solow (1956) for the U.S. economy, and in later work by Comin (2004), Denison (1979) and Griliches (1973), who estimated the contribution of R&D to productivity growth in the United States.
In developing countries, evidence of the link has been more elusive. One study on South Korea (Yuhn and Kwon, 2000) found that technological progress accounted for only 7% of the real output growth in the country´s manufacturing sector over 1962-1981, which was similar to findings for Japan and Singapore. One reason for the differences could be that returns to S&T are largely dependent on the country´s already existing S&T capacity, so that countries starting out along the path to higher technological capabilities may at first reap little visible fruit from their efforts.
Even though empirical evidence of the link is only partial, development economists generally accept that greater S&T capacity is one of the building blocks that puts poorer countries on the path to development; and amassing knowledge and social/organizational capital in developing countries is a way for them to fully participate in and “own” the process of transformation implied in development and eventually have a greater international voice (Stiglitz, 1998). As a reflection of this consensus, the World Summit for Sustainable Development in Johannesburg in 2002 centered on the role of science and technology in driving more successful and more sustainable development paths.
THE RAND S&T INDEX
In this spirit, the different S&T capabilities of countries around the world have become an important indicator, both as a predictor and as a reflection of their levels of development. Yet many facets of these capabilities are unobservable. Much of the human capital involved in S&T activities exists at an individual level, and only manifests itself when the human capital interacts with the institutional environment and scientific infrastructure. And the capacities implicit in the country´s S&T infrastructure are built up gradually over time, so that they cannot be entirely captured by annual data.
Various indicators have been developed to attempt to quantify S&T capacity across countries, such as the OECD´s Science, Technology and Industry Scoreboard or the European Innovation Scoreboard. Many of these cover only developed countries. RAND Science and Technology, in a 2001 report for the World Bank, built a broad composite indicator that could reflect the most relevant observable features of S&T infrastructure and output for most countries in the world. This index selected seven components for which national-level data were available for most countries for 2001 or an immediately preceding year. The variables were the following:
1. Gross National Product (GNP) per capita, which is a proxy for the country´s general economic infrastructure;
2. The number of universities and research institutions in the nation, per million people, as a representation of S&T infrastructure;
3. Number of scientists and engineers per million people, to reflect the human resources that are potentially available to become engaged in S&T activities;
4. The number of students studying in the United States, adjusted for those who decided not to return home when their studies were over, again to capture human resource potential for S&T;
5. The proportion of GNP spent on R&D, as a representation of the financial resources that the economy is devoting to S&T activities;
6. The number of academic S&T journal articles published by citizens of the nation;
7. The number of patents registered by citizens of the nation with the U.S. Patent and Trademark Office (USPTO) and the European Patent Office (EPO) (see Griliches (1998) for a survey of the literature on the usefulness of patent statistics as economic indicators).
A quick glance at the list reveals that the first two were selected to give a picture of the infrastructure backdrop against which S&T activities could take place; the next three show the human and financial resources available to carry out those activities; and the last two reflect the measurable or observable S&T outputs. The most developed countries could be expected to show good results on all seven indicators. In contrast, countries that are earlier along in the process of developing an S&T capability might be expected to make a good showing on the first two (income and research institutions) and then proceed to the next three (students studying in the United States, scientists and engineers and R&D spending) before beginning to show results on the last two (patents and academic publications).
To combine these very different components into a single index, the World Bank/RAND team standardized the numbers to show national performance. The value of each national characteristic was compared to the international average, and “performance” was ranked based on the number of standard deviations of the national value away from the international mean. Hence above-average numbers produced a positive contribution to the index and below-average numbers made a negative contribution. The indicators were then weighted as follows:
1. one point each for infrastructural and human resource factors –GDP per capita, number of university and research institutions and students studying in the United States—as well as for patents;
2. two points for the primary output, which the RAND team considered to be S&T journal articles;
3. Three points for indicators of capacity to conduct S&T: R&D spending as a per cent of GNP and the number of scientists and engineers per million population.
The weighted sum of the standardized values yielded an index that ranked 150 countries in the world into four categories:
1. Scientifically advanced countries (a total of 22), which evidenced scientific capacity well above the international mean;
2. Scientifically proficient countries (24 countries), which had positive standing in scientific capacity compared to the rest of the world (with a final score greater than 0);
3. Scientifically developing countries (24) which were below the international mean even though they had some features of S&T capacity; and
4. Scientifically lagging countries (80) which either had very poor S&T indicators or insufficient data to make comparisons on these components with the rest of the world.
The original country ranking is presented in the Appendix (Table A1) and included few surprises. The leading countries were the United States, Japan, and Germany, and all countries in the top group (scientifically advanced) were developed economies except for the Russian Federation. In the second group of scientifically proficient countries were the rest of the world´s developed economies plus some emerging nations such as various East European economies, China, India, Brazil, South Africa and (surprisingly) Cuba. For the third and fourth groups, the composite score was less than zero and the ranking passed through middle-income East European and Latin American states and Turkey to end with some of the world´s poorest nations at the bottom: Cambodia, Myanmar, Mozambique, North Korea, Laos, Chad and Eritrea. For only the African nations that were included in this original RAND index, South Africa was at the top, followed by Mauritius, Benin, Egypt, Uganda, Togo and Tunisia. Mozambique, Chad and Eritrea were at the bottom.
Since 2001, the world has undergone many transformations. Not only have emerging nations –some of them African—shown some of the world´s highest economic growth rates, but many of these same nations were left relatively unscathed by the financial crisis that began in mid-2007 and which is still dampening spending and output in some of the richest developed countries. At the same time, globalization has continued apace, stimulating S&T investments and cross-border scientific linkages while making travel, communication and the exchange of information less expensive. All of these changes have potential spillovers to the S&T capability of lagging countries.
The time seemed ripe, therefore, to broaden and update RAND´s 2001 S&T Index to provide a window on the process of evolving S&T capabilities in developing countries, especially the ones in Africa that were near the bottom of the previous list. The exercise would make it possible not only to identify success stories but also to point out potential future performers where investments in higher-value-added sectors could become more attractive and/or the pace of development might be expected to quicken.
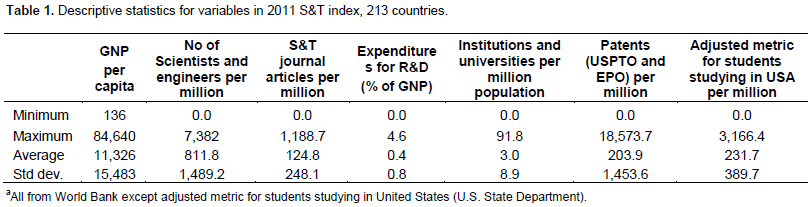
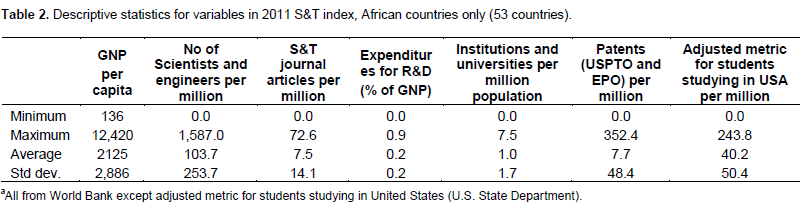
In order to do this, the original RAND index was replicated with the latest available data in 2011, broadening it to include more countries for which data were now available. The same methodology was followed: the numbers were standardized, the value of each national characteristic was compared to the international average, and “performance” was ranked based on the number of standard deviations away from the international mean. Above-average numbers produced a positive contribution to the index and below-average numbers made a negative contribution. The indicators were weighted in the same way. Hence the first index presented here takes exactly the same form as the RAND index of 2001, but with 63 new countries added for a total of 213 (compared to 150 in the original index). Many of the new countries were either very small island nations (Vanuatu, Turks and Caicos, Virgin Islands) or were relatively new countries (Uzbekistan). However, some were African nations that were omitted from the 2001 report (e.g., Zimbabwe, Liberia, Equatorial Guinea), presumably for lack of data. Eight new African countries were added to the index. Tables 1 and 2 below present descriptive data on the variables used in the index for 2011, and the 2011 ranking of African countries is given in the Appendix (Table A2).
The most remarkable results of the new index were that some emerging countries advanced strongly and joined the developed nations at the top of the list. The most notable of these were China, which climbed from 38th in the old index to third in the new one; and India, which rose from 44th to 12th. What propelled China forward was a dramatic increase in articles in science and technology journals, a key output; and strong rises in the number of scientists and engineers as well as patents and students studying in the United States. India also showed a sharp increase in patents, with improvement across all indicators. Four other important moves upward in the rankings were for Turkey, which rose from 53rd to 19th; Brazil, from 39th to 16th; Spain, from 25th to 10th; and Italy, from 17th to ninth. For Spain the driving factor was the number of academic publications; for Turkey it was a dramatic increase in patents. Italy boosted R&D spending and universities per capita, but it dropped off in number of patents; while Brazil rose in R&D spending and number of scientists and engineers. Some of the developed countries that dropped significantly in the ranking were Canada (from 4th to 8th), Sweden (from 5th to 15th), Switzerland (from 8th to 17th) and Finland, Denmark and Norway.
On the African continent, the leader of the 53 countries included in the new index was South Africa, the same as in 2001. However, the other positions showed considerable change and some of the top countries showed impressive gains. Morocco and Algeria showed the most progress, advancing from 116th to 62nd in the world, in the case of Morocco, and from 123rd to 68th, in the case of Algeria. In sub-Saharan Africa, Nigeria moved forward to 77th from 104th, and Botswana, Mozambique, Ethiopia and Sudan also improved. In contrast, African leader Mauritius declined in the 2011 index, from 58th to 79th; as did Benin, Uganda, Libya, Togo, Congo and others. The ranking of African nations can be consulted in the Appendix (Table A4). It should be noted that for some indicators, many African countries show no data. Following RAND researchers it is assumed that this data vacuum reflects very low levels, whose values are 0.
What indicators are holding sub-Saharan Africa behind, according to this version of the index? The widest differences, as could be expected, are in those indicators that reflect science and technology output. In the number of scientific and technical articles published in academic journals, every African nation was below the sample average, with Tunisia, South Africa, the Seychelles and Botswana as the best performers on the continent. In patents, only Seychelles was above the world average, with other nations lagging seriously behind. The human resource indicators also were substantially lower than for the rest of the world. In number of scientists and engineers per million, every African nation was below the global average except for Tunisia; and in university students studying in the United States, all were below the average except for Libya, where median incomes were relatively high. For indicators reflecting the basic infrastructure for science and technology, some differences were also large: in GDP per capita, only two countries (oil producers Equatorial Guinea and Libya) had incomes above the global average.
Research and development spending, an indicator reflecting the financial resources for S&T activities is the one where Africa does best compared to the rest of the world. South Africa, Tunisia, Benin, Morocco, Togo and the Democratic Republic of the Congo all have figures that are above the average for the sample of the 213 countries, and Botswana, Sudan, Mauritius and Uganda are not far behind. This might show in part that development funds have been made available for R&D spending in some of these countries. In number of universities and research institutions per million inhabitants, which reflects human resource potential, the continent also shows some good figures: Mauritius, Guinea-Bissau, Gabon, South Africa and Botswana all have numbers that are above average.
However, the original RAND index included a number of indicators that were susceptible to country size, and therefore “discriminated” against smaller countries. Those indicators are the main output indicators: number of science and technology indicators published in academic journals, and number of registered patents. Both could be expected to be smaller in countries with smaller populations, all other things remaining equal. Additionally, the number of students from any given country studying in the United States is likely to be lower in countries with small populations. To adjust for these differences, the same methodology as outlined above is used, but these three indicators were divided by country population to adapt human resources and output better to the size of the country. They then entered the index with the same weights as in the RAND 2011 index.
Unsurprisingly, this adjustment boosts in the global index some countries with smaller populations, such as Finland, Sweden, Israel, Iceland, Denmark and Canada (these become the top six countries, just ahead of the United States). At the same time, it pushes down countries with large populations like Japan and Germany, but especially China and India, which drop back down to 44th and 80th, respectively.
For African countries, the new weighting actually meant declines on the global ranking for most countries. Because of their large populations, South Africa, Morocco, Egypt, Algeria and especially Nigeria all moved downward. Tunisia moved up, as did little Mauritius (from 79th to 75th) and tiny Seychelles (from 98th to 87th). Gabon and Libya moved up but remained below the average. The countries lagging the furthest behind were the same as in the first index: Mauritania, Tanzania, Niger, Sierra Leone, Liberia, Comoros, Eritrea, Chad and Somalia. Hence the need for this correction is not an explanation for the poor S&T performance of Africa; in fact, it makes the picture worse. The ranking for the 53 African countries on this adjusted index is shown in Table A3 in the Appendix.
Following a ranking exercise like this one, an obvious question that arises is which countries are best poised to move forward in the next decade, as some have done since 2001. In order to do this, one or several indicators must be identified that capture the process during which countries prepare themselves for better science and technology capabilities, whose results may be seen in coming years first in human and financial resources and later in S&T “outputs”, like scientific articles or patents. Of the available indicators, the one that seemed most like a “leading” indicator –one that could predict where S&T capability could go in the future— and which offered the most complete and comparable data was the gross enrollment rate in tertiary education (as a per cent of all students in the university age bracket)[1].
Tertiary education in poorer countries has recently come back into the limelight as an important indicator of economic development, as well as S&T capacity. Higher education has taken on increasing importance as a driver of growth and technological capability as primary education has advanced, and cases like Japan, Finland, Sweden Korea, Taiwan and Korea manifest how efforts to raise higher educational standards can deliver high benefits in terms of capacity for technological innovation (López-Claros and Mata, 2010). The World Bank, after years of emphasizing the key role of primary and secondary education in poverty reduction, published Knowledge in Development in 1998 to demonstrate how developing countries could use knowledge to narrow their income gap with high-income countries (World Bank, 1998). Many experts on Africa now acknowledge the key role played by higher education in development, as an “essential complement to educational efforts at other levels as well as to national initiatives to boost innovation and performance across economic sectors” (Bloom et al., 2006). Among other benefits, higher education yields a capacity to understand and use global knowledge in science and technology, for application to agriculture and to other sectors. Bloom et al. found that investment in higher education could accelerate the rate of technology catch-up in Africa and boost per-capita incomes.
The data used is not a completion rate, and it excludes the very capable students who might be studying in the United States or in another developed country. However, it does reflect the human resources that could potentially become available for future science and technology activities in a country. Although enrollment rates in tertiary education are the lowest in the world in Africa –the African average is 7.1%, compared to 25.1% for the world--, there is one country that stands above the global average, which is Libya. Others that are at the top of the African ranking and well above the African average enrollment rate are Tunisia, Egypt, Algeria, Mauritius, Morocco and Cape Verde. These countries are already at the top of the S&T index, so their figures on college enrollments are unsurprising. Botswana, Gabon and Senegal are also relatively high on both African rankings.
However, there is a small group of sub-Saharan African nations that show above-average enrollment rates in tertiary education and which are still lagging in science and technology capability. These countries are Liberia (17%), Nigeria (10%), Guinea and Namibia (around 9%), Cote d´Ivoire (8.4%) and Cameroon (7.8%). If higher education is indeed a key determinant of future S&T capacity, these nations could advance in an S&T index for the continent in coming years. See Table A4 in the Appendix for a full ranking of African countries by tertiary enrollment.
This exercise in updating and adjusting an index launched by RAND in 2001 offers some insights into the readiness of African countries to move into a more advanced stage of development and join a higher value-added global economy. A few African countries show signs of moving upward in science and technology capabilities, in particular South Africa, Egypt, Tunisia, Morocco, Algeria, Nigeria and Mauritius. Within sub-Saharan Africa, the countries with the greatest promise besides South Africa and Nigeria appear to be Benin, Botswana, Uganda, Mozambique, Ethiopia and Sudan. The countries that today are ranked rather low but that show some promise for joining them in the future, judging by their current participation in higher education, are Liberia, Guinea, Namibia, Cote d´Ivoire and Cameroon.
[1] I had originally intended to add another variable to this final index, which was public expenditure per student in tertiary education, expressed as a percentage of GDP per capita. However, the data from UNESCO, which includes government spending on educational institutions and administration, whether they are public or private, and any subsidies to private education, showed figures that were well above the average for developed countries. In fact, the top 10 countries in spending per student/GDP were African: Lesotho, Eritrea, Ethiopia, Mozambique, Burundi, Niger, Swaziland, Botswana, Burkina Faso and the Central African Republic. There is potential bias in the indicator, since countries with a tiny university population might spend their entire budget on a few students, giving a large per-capita figure; and a very low GDP would tend to boost the ratio (spending per student/GDP) in small, poor countries. However, the figures were such dramatic outliers that I decided not to use the indicator at this time, until I could determine what produced such high values.
CONCLUSION AND DIRECTIONS FOR FUTURE RESEARCH
Any index, no matter how comprehensive, provides only a static picture of a single moment in time; and it relies for its accuracy on the quality of the underlying data. This index is no exception. The countries with poor or missing data are left at the bottom of the index, which might not be a fair reflection of their true capabilities.
This exercise also leaves out of the picture all of the dynamic external factors that could influence the context in which S&T capability can flourish. A nation´s S&T capacity, or in a broader sense, a national system of innovation, is deeply influenced by a country’s institutional features (Lundvall et al., 2002). One of the key factors in fostering these systems of innovation is political stability (Allard et al., 2012). When this political stability is either interrupted or restored, the framework for science and technology capabilities is fundamentally altered, and will heavily influence the course of its future. In this sense, the spread of political unrest in recent months in some African countries could mean that their evolving S&T potential could be cut short, to recover in better political circumstances at a later date. Particularly at risk could be countries like Liberia, Cote d´Ivoire, Sudan, Egypt and Tunisia, which are revealing a nascent S&T capability that relies on a politically stable environment in order to flourish. Tracking the dynamics of manifest science and technology capabilities as the political context changes would give important insights into the nature of this relationship, and would provide guidance to policymakers interested in their countries´ development potential.
As the new S&T index shows, some countries experiencing fast economic growth can advance quickly in the ranking of nations, if the benefits of that growth are invested in human and technical resources. If Africa in fact registers some of the fastest growth rates on the globe in coming years, the foundations for its future S&T success could be laid quickly, and an updated index in another decade could give a radically different picture of the continent. More importantly, as African countries advance in S&T capability, their chances of orienting their economies toward sustained and sustainable growth are greatly enhanced. Hence this becomes a key indicator for the future.
CONFLICT OF INTERESTS
The author has not declared any conflict of interests.
REFERENCES
|
Acemoglu D, Johnson S, Robinson JA (2004). Institutions as the fundamental cause of long-run growth. Working Natl Bur. Econ. Res. pp.10481. Crossref |
||||
|
Allard G, Martínez CA, Williams C (2012). Political instability, pro-business market reforms and national systems of innovation. Forthcoming in Research Policy. Crossref |
||||
| Bloom D, Canning D, Chan K (2006). Higher Education and Economic Development in Africa, Harvard University Human Development Sector, Africa region. | ||||
|
Comin D (2004). R&D: A small contribution to productivity growth. Working Paper Natl. Bur. Econ. Res. pp.10625. Crossref |
||||
| Denison EF (1979). Accounting for Slower Economic Growth: The United States in the 1970s. Washington, D.C.: The Brookings Institution. | ||||
|
Domar E (1946). Capital Expansion, Rate of Growth, and Employment. Econometrica 14(2):137-147. Crossref |
||||
| Griliches Z (1994). Productivity, R&D and the data constraint. Ame. Econ. Rev. 84(1):1-23. | ||||
|
Griliches Z (1998). Patent statistics as economic indicators: A survey. In Z. Griliches (Eds.) R&D and Productivity, Econom. Evid. pp.287-343. Chicago, IL: University of Chicago Press. Crossref |
||||
|
Harrod RF (1939). An essay in dynamic theory. Econ. J. 49: 14-33. Crossref |
||||
| López-Claros A, Mata YN (2010). The innovation capacity index: Factors, policies and institutions driving country innovation. In A. López-Claros (Eds.) The Innovation for Development Report 2009-2010: Strengthening Innovation for the Prosperity of Nations: Hampshire, United Kingdom & New York, NY: Palgrave MacMillan. 3-68. | ||||
|
Solow RM (1956). A contribution to the theory of economic growth. Q. J. Econ. 70 (1):65-94. Crossref |
||||
| Stiglitz JE (1998). Towards a new paradigm for development: Strategies, policies and processes. Prebisch Lecture at UNCTAD, Geneva. | ||||
| Wagner CS, Brahmakulam I, Anny WBJ, Yoda T (2001). Science and technology collaboration: Building capacity in developing countries? Monograph Reports, RAND/MR-1357.0-WB. Santa Monica, CA: RAND CORP. | ||||
| World Bank (1998). Knowledge for Development. World Bank and Oxford University Press. | ||||
|
Yuhn KH, Kwon JK (2000). Economic growth and productivity: A case study of South Korea. Appl. Econ. 32(1):13-48. Crossref |
||||
Copyright © 2024 Author(s) retain the copyright of this article.
This article is published under the terms of the Creative Commons Attribution License 4.0


