ABSTRACT
One indicator of national economic progress is middle class expansion. While recent studies show an increasing sub-Saharan African middle class, there is no clear empirical appreciation of the factors driving this and how they may be sustained. This study uses data from Northern Ghana and a logistic regression model to identify the factors determining the probability of being in the middle class to provide public and private policy support. The study evaluated two alternative middle class definitions, Kharas and Getz’s and African Development Bank’s, and found that although definitions matter, the signs on the influencing variables were similar. Our results showed that education, locale and household size significantly influenced the odds of being in the middle class. For example, urban households with educated heads have a higher probability of being in the middle class than rural households with uneducated heads. Additionally, increasing household size has an adverse effect on the probability of being in the middle class. The results direct public and private policy focus on improving education and literacy programs, building infrastructure and controlling household sizes to support middle class expansion in Northern Ghana.
Key words: Middle class, Africa, Ghana, poverty, education, economic development, infrastructure.
The size and growth rate of the middle class have been identified as important indicators of a country’s economic well-being because of their effect on demand for high quality goods (Murphy et al., 1989), economic growth and entrepreneurship (Acemoglu and Zilibotti, 1997), infrastructure development (Bhalla, 2007) and promotion and sustainability of economic reform (Birdsall et al., 2000). Indeed, Aristotle is quoted in Decomez (1998) as suggesting that states with a large middle class are likely to be well administered and less likely to exhibit factions and dissension. Landes (1998: 218) echoes this view of Aristotle’s, arguing that an ideal growing and developing society would have “a relatively large middle class.” Despite its apparent importance for socio-economic progress, the definition of what and who the middle class is has been fraught with challenges (Birdsall et al., 2000; Eisenhauer, 2008), especially in developing countries.
Birdsall et al. (2000), Milanovic and Yitzhaki (2002) and others defined the middle class using purchasing power parity (PPP). For example, Banerjee and Duflo (2008) defined the middle class as those with per capita daily expenditures between $2 and 10 measured at 1993 PPP. The World Bank used Banerjee and Duflo’s $2 per capita per day lower bound definition but increased the upper bound to $13 in 2005 PPP. Both the African Development Bank (AfDB) and the Asian Development Bank (ADB) also maintained the lower bound but established an upper bound of $20 per capita per day (Ncube et al., 2011). Kharas and Gertz (2010), focusing on the middle class’ principal role as “an economic driver”, defines it as the consumer class with an income elasticity for consumer durables and services (pure traded goods) greater than unity. This definition implies that for individuals in the middle class, a percentage increase in income results in more than a percentage increase in the consumption of consumer durables and services. The Kharas and Gertz (KG) boundaries range from $10 to 100 per capita daily disposable income in 2005 PPP.
Based on their definition, Ncube et al. (2011) estimated Ghana’s middle class was between 33 and 66% of the population. This is supported by the country’s high Gross Domestic Product (GDP) growth in the last decade, debt relief and public investments in poverty reduction programs (Government of Ghana and UN Development Program, 2015). These efforts, according to Molini and Paci (2015), contributed to a poverty rate in Ghana that was less than half of the sub-Saharan African average of 43%.
Hamidu (2015) noted that the expanding middle class in Ghana has contributed to political stability and made the country a beacon of democracy in Africa. Yet, economic progress has been far from uniform across the country. For example, while the 2012/2013 average national poverty incidence was 24.2%, it ranged from 44.4 to 70.7% in the three northernmost regions (Ghana Statistical Service, 2014). Behrends and Lentz (2012) observed that northern Ghanaians’ difficulty in entering the middle class was not limited to those without education. They attribute this to the rising standards of success, including educational qualification. The unfavorable economic situation in Ghana’s northernmost regions motivated the major international development agencies, such as the U.S. Agency for International Development (USAID), to focus their resources and intervention initiatives in the northern part of the country.
While the attention of most development agencies and public policymakers has been on poverty alleviation, the foregoing literature suggests that a shift of focus to middle class expansion could produce significant economic progress. Assuming this is valid, what demographic and socioeconomic characteristics of the middle class separate them from those in the lower class? We use the northernmost regions of Ghana as a case study to answer this question. By limiting the study to a region that has been shown to present a distinctly higher incidence of poverty, the study controls for regional differences and provides a controlled result that offer significant private and public policy insights. The analyses were conducted using two different definitions of middle class to test the effect of the definitions on the results: Ncube et al. (2011) (AfDB) and Kharas and Gertz (2010) (KG). Subsequently, the data and the study’s modeling approach were described. The results were presented after the descriptions and concluded with recommendations for policymakers and individuals interested in advancing their own wellbeing. It was believed that the recommendations will be helpful to non-governmental organizations working on poverty alleviation in communities in the region.
DATA AND THEORETICAL MODEL
The data used for the study is culled from a large database developed from a population-based survey conducted in the northernmost regions of Ghana in 2012. The survey was commissioned by USAID. commissioned by USAID in the northernmost regions of Ghana in 2012. The original sample encompassed 4,400 households drawn using a two-stage random sampling approach. A major purpose of the original study was to estimate the incidence of poverty in the northernmost region of Ghana to track the effect of USAID investments on poverty reduction. The dataset was, thus, rich with detailed expenditure information and household characteristics. Due to incomplete information for some respondents, we ended up using 4,365 households (more than 99% of the sample) (The complete dataset is available for public use at http://catalog.data.gov/dataset/feed-the-future-ghana-baseline-household-survey).
Due to the difficulty of collecting accurate information on household income in developing countries, household expenditures were used as a proxy. The weakness of this proxy is that it assumes that households have no savings, an assumption that is likely to hold when total household expenditures are low. There were four expenditure categories: food; housing; durables; and non-durables. Information on food expenditures were collected using a seven-day recall while non-durable (cooking fuel, transportation, and expenditures on education and health care) and housing expenditure were based on expenditures in the preceding month. This was done to mitigate the risks of recall by respondents. For example, while housing rent expenses were incurred monthly, food expenditures were based on seven-day recalls. The annual depreciated value of durable goods (radios, household appliances, automobiles, etc.) was used to represent their expenditures.
The standard operating procedure in poverty research is to look at daily per capita expenditures. To estimate this from the foregoing, we first summed all expenditures in each of the four categories and annualized them by applying the appropriate time metric for each category. Thus, food expenditures were annualized by multiplying by 52 weeks, while housing expenditures were annualized by multiplying by 12. Then the annualized expenditures in all the categories were summed and divided by 365 (days in a year) to arrive at the daily household expenditure. The average per capita household expenditure was estimated by dividing the daily household expenditure by the household size.
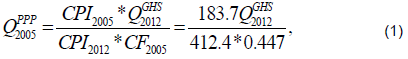
The estimated per capita household expenditure in 2012 Ghana Cedis (GHS), was transformed into 2005 Purchasing Power Parity (PPP), using the following formula and parameters:
where is the conversion factor for the Ghana Cedi into PPP in international currency (World Bank, 2012), and CPI is the consumer price index produced by Ghana Statistical Service and the Bank of Ghana. The subscripts indicate the reference years. The results of were used to sort households into the different economic classes using the expenditure boundaries for AfDB and KG definitions of middle class.
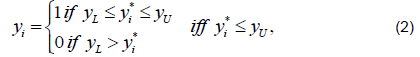
Recall the study’s interest was on identifying the socioeconomic and demographic factors separating the middle class from the lower class in the northernmost regions of Ghana. From the prior discussion on the middle class, it was recognized that economic classes were unobserved or latent variables defined by proxy using lower and upper boundaries for per capita expenditures. Assuming captures each middle class household, i, then there exists a variable which may be used to capture such that:
where takes on the value of 1 when is greater than or equal to ( lower bound of the middle class definition) and less than or equal to (upper bound of the middle class definition). However, whenever is less than , then is zero. To restrict the analysis only to the middle class, observations where is greater than are excluded from the analysis.
Assuming that is determined by a matrix of independent variables, and given that any household i is either in or not in the middle class, it is possible to estimate the odds of being in the middle class using a logit model, thus:
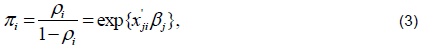
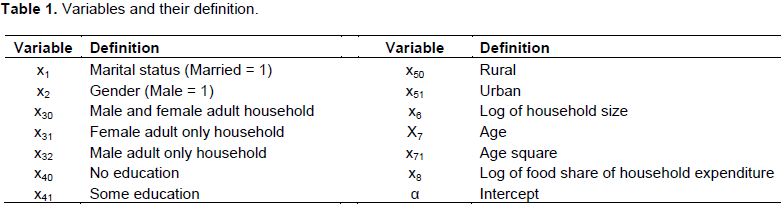
where is the probability of household i being in the middle class. The exponentiated coefficient, is defined as the odds ratio of that household i being in the middle class when the jth independent variable is changed by a unit, holding all other independent variables constant. The independent variables used in this study were the demographic characteristics of the household head and the household’s socioeconomic characteristics. The household head’s demographic characteristics considered were sex, age, education and marital status. The household socio-economic characteristics included were proportion of total expenditure allocated to food, the location of the household, and its gendered household type. Gendered household typology uses the number and gender of adult decision-makers in the household to develop a better appreciation of the household’s resources, capabilities and gender dynamics (Feed the Future, 2014).
Education is treated as a binary, where 0 implies the household head has no formal education and 1 implies some formal education. The variable was structured this way because of the large proportion of household heads in the sample without any education and the relatively small proportion of household heads with post-secondary education. Marital status is also a binary, where Married = 1 and Unmarried (covering single, never married, separated, divorced and widowed household heads) = 0. Households located in urban and rural areas take on a locale value of 1 and 0, respectively while males were coded as 1 and females as 0. Rural locations are characterized by poor or unavailability of modern amenities, such as electricity, hospitals, schools, potable water, and cultural institutions. Three gendered household types were available in the data: Male and Female Adult Gendered Households (MFA), coded as 0; Female Adult Only (FAO) Households, coded as 1; and Male Adult Only (MAO) Households, coded as 2. Age and food share of total expenditure were structured as continuous variables, the former measured in years and the latter in percent. The estimated model, coded to produce odd ratios as the coefficients, was defined as follows:
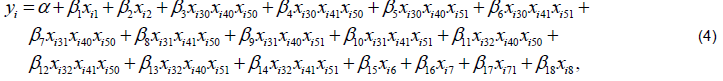
where Greek letters are the estimated regression coefficients (odds ratio) and the independent variables are defined in Table 1.
The variables included in the research may be envisioned as endowed or built resources and capabilities. Individuals and governments have the capacity and ability to shape built resources and capabilities through investments. Contrarily, endowed resources cannot be altered much by the individual or government. Sex and age are considered endowed whereas education, gendered household type, locale and marital status are considered built because people can choose to alter them despite the potentially high social and economic costs they may incur. For example, urban areas are considered built because governments can make the necessary investments to provide modern amenities and people have the freedom to move to urban areas to increase their access to these modern amenities. Thus, families may move to an urban area to avail themselves to better medical facilities or their children to better schools.
It is important to note, however, that certain decisions may not be acted upon because of resource constraints. Understanding the nature of these constraints could benefit policymakers and their development partners. Articulating them may also help individuals to alter their choices to improve themselves. Take education, for example: While their own parents may have denied them the privilege of being educated, current illiterate adults can choose to address their own illiteracy by choosing to enroll in adult literacy programs if such programs are available. However, for them to act their estimated net pecuniary and non-pecuniary benefits must be positive. If they perceive a negative net benefit from their investments in literacy, they will not make such investments even when the amenities are available.
The three gendered household types and two each for locale and education yielded a dozen interaction variables (household types). The reference household was defined as a MFA gendered household in a rural area with a household head without any education. The odds of being in the middle class of the eleven other household types were compared against this reference household type. The logit model was estimated using Stata® 14 routines and algorithm.
Summary statistics
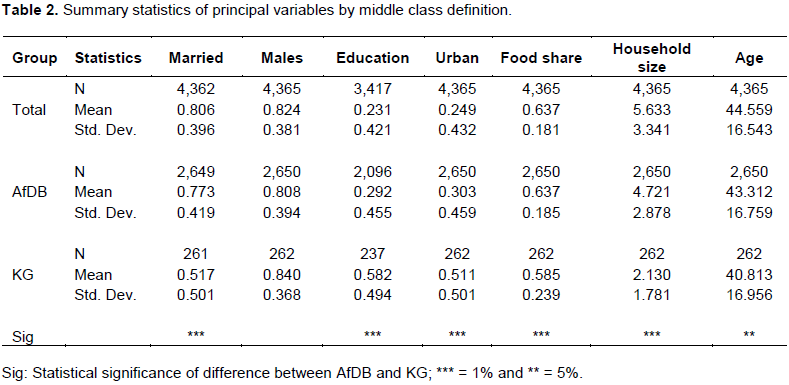
Of the 4,365 households in the survey, 2,650 (or 60.7%) fell into the AfDB middle class, leaving about 37.9% in the low-income class and 1.4% (not included in the analysis) with average per capita daily expenditures outside the upper bound of the AfDB definition. Only 6.0% of all households fell into the middle class under the KG definition, all others were in the low-income class. Taken together, only 4.6% of households overlapped in the middle class under both definitions. While 83.1% of households fell under the male and female adult (MFA) household type, female adult only (FAO) and male adult only (MAO) household types accounted for 7.5 and 9.4%, respectively.
Table 2 presents the summary statistics for the variables used in the study for the whole dataset (Total), and for the middle class as defined under the AfDB and KG. The table shows that about 81% of all respondents in the survey were married compared with about 77 and 52%, respectively for the AfDB and KG middle class groups. The differences in the proportion of married household heads under the two middle class definitions was statistically significant at the 1% level. While more than 58% of households head under the KG definition had some education, the proportion under the AfDB was only 29%. The table also shows that about 51% of KG middle class households were in urban areas compared to 30.3% of AfDB middle class households. Additionally, while AfDB households had an average of about five people in their households and allocated almost 64% of their total household expenditure to food, KG middle class household size averaged 2.1 people and they allocated about 58.5% of their total household expenditure to food. The differences between AfDB and KG households for all these variables at the mean were statistically significant at the 1% level. Household heads in AfDB households were about three years older, which was statistically significant at the 5% level. Although the proportion of males in the KG middle class households was higher than in the AfDB middle class households, the difference was not statistically significant.
AfDB middle class regression results
The results of the logit model using the AfDB subgroup has an F(17, 211) value of 21.76 (Prob > F = 0.00). Thus, we reject the null hypothesis that all the estimated coefficients in the model are equal to zero with more than 99.99% confidence. Table 3 shows that the odds of being in the AfDB middle class for a no education urban dwelling MFA gendered household is 2.5 times higher than that of a no education rural dwelling MFA gendered household (the reference household). The odds of being in the AfDB middle class for a rural dwelling MFA gendered household in which the household head has some education is almost double the odds of the reference household. Now, when the household head has some education and the MFA gendered household is urban dwelling, then the odds of being in the AfDB middle class is nearly eightfold that of the reference household. The results show that for the MFA gendered household type, the odds of being in the AfDB middle class changes in statistically significant ways when locale and education change.
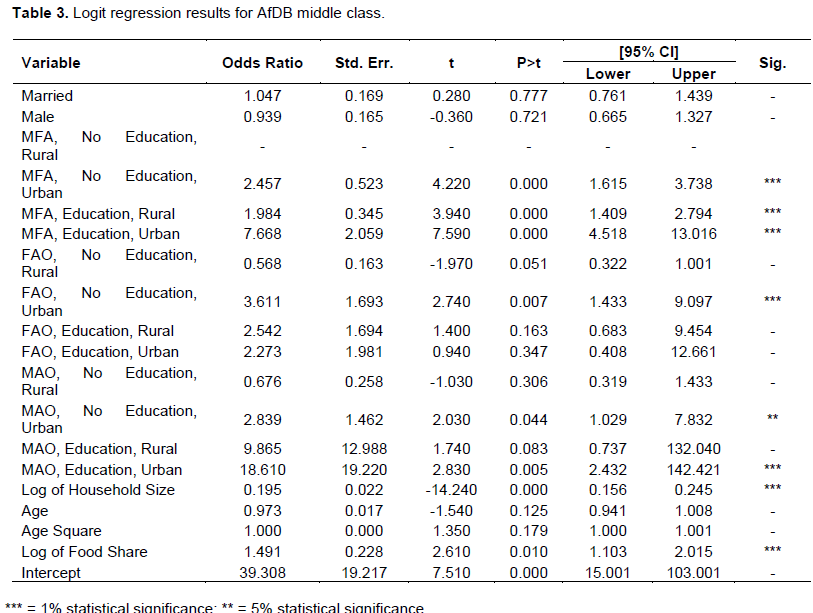
The odds of being in the AfDB middle class for an urban dwelling FAO gendered household in which the household head has no education was more than 3.6 times higher than that of the reference household. This was the only estimate related to the FAO gendered household type that was statistically different from the reference household. On the other hand, the odds of being in the AfDB middle class for an urban dwelling MAO gendered household in which the household head has some education was estimated at more than 18.6 times higher than that of the reference household, significant at the 1% level. The table shows that, ceteris paribus, MAO gendered households in an urban area in which the head some education produces higher odds of being in the AfDB middle class than FAO gendered households with similar characteristics.
Holding all other variables constant, the odds ratio of being in the AfDB middle class is about 0.81% lower (p < 0.000) than of being in the low-income class when household size increases by 1%. Contrarily, a percentage increase in food share of total household expenditure leads to the odds of being in the AfDB middle class being about 50% higher than being in the low-income class (p < 0.000). The household head’s gender and marital status alone do not produce statistically different effect on the odds of being in the AfDB middle class.
KG middle class regression results
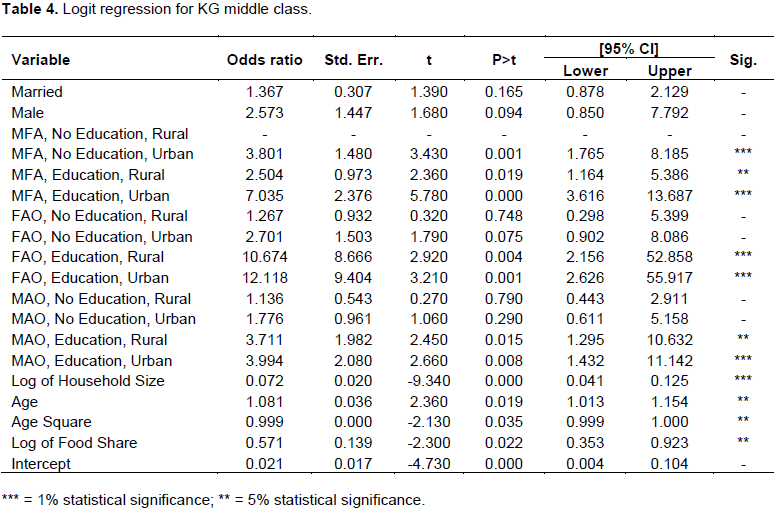
The estimated logit regression model using the KG definition of middle class as the dependent variable was statistically significant (F(17, 211) = 16.17; Prob > F = 0.000). Table 4 shows that the odds of being in the middle class for a no education urban dwelling MFA gendered household is 3.8 times higher than the odds of a no education rural dwelling MFA gendered household being in the KG middle class. However, if the household head of an urban dwelling MFA gendered household has some education, its odds of being in the KG middle class increases by more than seven times relative to the reference household type. Interestingly, the odds of being in the KG middle class for a FAO gendered household in which the household head has some education is higher regardless of whether the household was in rural or urban locale. The reported estimates are all statistically significant at the 1% level. Where household heads have no education, the odds of being in the KG middle class was not statistically different from that of the reference household for neither MAO nor FAO gendered households in rural or urban areas. Holding all things constant, the odds of being in the KG middle class with a one percent increase in household size was about 92.8% lower (p < 0.000) than the odds of being in the low-income class. Furthermore, a percent increase in food share of total expenditure, holding everything else constant, leads to a reduction of being in the KG middle class by about 42.9% (p < 0.05).
Implications of results
That there are differences in the results suggests that the definition of middle class may not be irrelevant to the policy recommendations that emerge from how specific levers may be used to accelerate and sustain growth of the middle class in developing countries, such as Ghana. However, the fact that the two definitions explored here yielded the same signs for most of the variables boosts confidence in the models’ ability to provide consistent policy recommendations. They also highlight the importance of engaging both individuals and public institutions in policy initiatives.
The most important variables emerging in the results as influencing the probability of being in the middle class regardless of the definition used were household size, education and locale. Behrends amd Letz (2012) observed that low education did present a challenge for residents in the northern regions of Ghana entering the middle class. Similar results have been found for education by Song et al. (2016) in China and for locale by Mahbud (2015) among Bangladeshi women migrating to the UK. Recall that we framed locale in terms of availability of built infrastructure, such as good roads and road networks, good schools and medical facilities, electricity, pipe borne water, and similar public goods, which separates urban from rural areas. Investments in these infrastructures provide people with a platform from which to elevate themselves into the middle class either by moving to areas with these infrastructures or equalizing rural and urban areas by making them accessible to rural residents. For example, investment in electricity increases the accessibility of information and communication technologies in rural communities just as investments in good roads connecting rural to urban communities increase accessibility to markets, reducing transaction costs and motivating otherwise infeasible investments. A good example of this is the rapid increase in economic activity after Highway BR-163 in the western part of Pará State and the northern part of Mato Grosso of Brazil was paved (Vera-diaz et al., 2009). Given that Sub-Saharan Africa has the world’s least developed road network (Faiz, 2012), and given the relatively poor quality of education infrastructure in rural Sub-Saharan Africa (Levin, 2009), governments and development partners have a clear path to increasing and sustaining the region’s middle class.
While government has the responsibility of providing these public infrastructures, it is citizens’ responsibility to utilize them effectively when they are available. For example, parents need to make adequate investments in their children’s education, supporting them and helping them take full advantage of schools and teachers. They also have to make investments in their own education, taking advantage of available literacy programs or figuring out how to get their children to teach them what they are learning. However, the public sector has a role here: working with parents who may have physical or cognitive resource constraints to appreciate fully the value of education in their social mobility. In the U.S. for example, children are required by law to be enrolled in school until their sixteenth birthday at the minimum, with state governments using various sanctions and economic tools to enforce the law. Given the high level of adult illiteracy in the study area and in Sub-Saharan Africa, it is plausible to assume that the value of education may not be fully appreciated, especially for females, making it difficult for people to justify investments. Without judgment, there may be value in investing in adult education and literacy programs to change attitudes towards formal education. When illiterate parents appreciate the joy and value of knowledge, it could transform their attitudes towards education and help them overcome resources constraints that may be preventing them from investing in their children’s education.
Household size, with its consistent statistically significant negative effect on the probability of being in the middle class, is the other important variable. While various interventions have been deployed over the years in attempts to reduce Sub-Saharan Africa’s birth rate, the negative correlation between education and household size (r = -0.17; p < 0.01) supports previous studies’ conclusions that increasing educational attainment could address the high birth rate challenge. Given the foregoing, private and public investments in education could enhance the probability of being in the middle class by contributing to a natural reduction in the birth rate and subsequently household size as both male and female children spend more time in school.
This paper sought to contribute to the conversation about sub-Saharan Africa’s middle class middle class by identifying the empirical effect of certain factors on the probability of being in the middle class. Increasing and securing the middle class is important because of its effect on both socio-political stability, domestic demand-driven economic development and individual productivity. The paper also investigated the extent to which the definition of middle class mattered in the statistical significance of these factors. The results showed that the sign and significance of the factors were similar under the two middle class definitions explored: African Development Bank (Ncube, 2011; Kharas and Getz, 2010). They showed that household size, education and locale were critical in defining the probability of being in the middle class. Framing locale as built infrastructure allowed us to suggest that building roads and schools could have significant impact on the growth and sustainability of the middle class. Given the statistical strength of education, the negative effect of household size on the odds of being in the middle class and prior research showing the negative effect of education on household size, a focused private and public investment in education could accelerate households’ migration into the middle class.
The authors have not declared any conflict of interests.
REFERENCES
|
Acemoglu D, Zilibotti F (1997). Was Prometheus Unbound by Chance? J. Polit. Econ. 105(4):709-751.
Crossref
|
|
|
|
Banerjee AV, Duflo E (2008). What is Middle Class about the Middle Classes around the World? J. Econ. Perspect. 22(2):3-28.
Crossref
|
|
|
|
Behrends A, Lentz CB (2012). Education, careers, and home ties: The ethnography of an emerging middle class from Northern Ghana. Zeitschrift fur Ethnologie, 137:139-164.
View
|
|
|
|
Bhalla S (2007). Second among Equals: The Middle Class Kingdoms of India and China. Unpublished manuscript, Peterson Institute for International Economics, Washington, DC.
|
|
|
|
Birdsall N, Graham C, Pettinato S (2000). Stuck in Tunnel: Is Globalization Muddling the Middle? Working Washington, DC: Brookings Institution. P 14.
|
|
|
|
Decomez SS (1998). An Empirical Analysis of the American Middle Class (1968-1992), Ph.D. Dissertation, Vanderbilt University
|
|
|
|
Eisenhauer JG (2008). An Economic Definition of the Middle Class, Forum. Soc. Econ. 37(2):103-113.
|
|
|
|
Faiz A (2012). The Promise of Rural Roads: Review of the Role of Low-Volume Roads in Rural Connectivity, Poverty Reduction, Crisis Management, and Livability, Washington, D.C.: Transportation Research Board,
Crossref
|
|
|
|
Feed the Future. Volume 6: Measuring the Gender Impact of FTF. M&E Guidance Series, Washington, D.C.: U.S. Government, March 2014.
View
|
|
|
|
Ghana Statistical Service. (2014). Population and Housing Census: Summary Report of Final Results. Accra, Ghana: Sakoa Press Ltd., 2012.
|
|
|
|
Government of Ghana (GOG) and UN Development Program (UNDP) (2015). 2010 Ghana Millennium Development Goals Report, Accra, Ghana: UNDP Ghana and NDPC/GOG.
|
|
|
|
Kharas H, Gertz J (2010). The New Global Middle Class: A Cross-Over from West to East, in China's Emerging Middle Class: Beyond Economic Transformation" Cheng Li (Ed.), Washington, DC: Brookings Institution Press. Pp. 32-54.
|
|
|
|
.Landes D (1998). The Wealth and Poverty of Nations. New York, NY: Norton.
|
|
|
|
Levin KM (2009). Access to Education in Subâ€Saharan Africa: Patterns, Problems and Possibilities, Comparative Education, 45(2):151-174.
Crossref
|
|
|
|
Mahbub R (2015). From gender-not-an-issue to gender is the issue: the educational and migrational pathways of middle-class women moving from urban Bangladesh to Britain, Gend. Educ. 27:871-886.
Crossref
|
|
|
|
Milanovic B, Yitzhaki. S (2002). Decomposing World Income Distribution: Does the World Have a Middle Class. Rev Income Wealth 48(2):155-178.
Crossref
|
|
|
|
Molini V, Paci P (2015). Poverty Reduction in Ghana : Progress and Challenges. Washington, D.C.: World Bank,.
|
|
|
|
Murphy K, Schleifer A, Vishny R (1989). Industrialization and the Big Push, J. Polit. Econ. 97(5):1003-1026.
Crossref
|
|
|
|
Ncube M, Lufumpa CL, Kayizzi-Mugerwa S (2011).The Middle of the Pyramid: Dynamics of the Middle Class in Africa. African Development Bank, Market Brief, April 20.
|
|
|
|
Song J, Cavusgil E, Li J, Luo R (2016). Social Stratification and Mobility among Chinese Middle Class Households: An Empirical Investigation, Int. Bus. Rev. 25:646-656.
|
|
|
|
Vera-Diaz M Del C, Kaufmann RK, Nepstad D (2009). The Environmental Impacts of Soybean Expansion and Infrastructure Development in Brazil's Amazon Basin, Tuft University: Global Development and Environment Institute, Pp. 09-05
|
|
|
|
World Bank (2016). PPP Conversion Factor, Private Consumption (LCU per International $), International Comparison Program Database,
View
|