ABSTRACT
The agricultural insurance implemented in Ecuador since 2010 is a state subsidized insurance system, which allows small and medium-sized farmers to contract protection policies against losses of their productions, caused mainly by climatic and biological events, or physical damages. Based on the positive correlation test between the insurance coverage and the probability of the accident, the investigation shows the asymmetry of information in the Ecuadorian agricultural insurance. Positive correlation was estimated, both with linear models and with the Probit model. Cross-sectional data were used in the period 2010 to 2013, data pool and panel data. The results suggest that the insurance system implemented in Ecuador is inefficient. It is therefore recommended that policy makers consider offering other forms of insurance, adopting modalities based on climatic indexes or productivity indexes, which, by saving operating costs, would allow expanding coverage and reaching the groups of farmers most vulnerable to risks.
Key words: Asymmetric information, agricultural insurance, moral hazard, adverse selection, small and medium agricultural producers, Ecuador.
In Ecuador, the agricultural sector is strategic. Due to the fact that, for the 17.9% of the country's economically active population, agricultural activities are the source of direct income; And, secondly, the sector generates 60% of the Ecuadorian families’ consumption basket, which ties it closely with the country’s food security in general (El Telegrafo, 2013).
At the same time, agriculture, livestock, aquaculture and fisheries are activities most exposed to climatic, biological and physical hazards. The most frequent are droughts, floods, excessive soil moisture, frost, hail, winds, volcanic ash fall, landslides and erosion (UNISA-MAGAP and SENPLADES, 2010).
In the face of natural disasters, the most affected producers are small and medium-sized farmers. The greatest vulnerability of this economic group it’s because: a) their farms are largely located in areas of geological or climatic risk; and b) they do not have the savings that enable them to recover their livelihoods and prevent disasters in the future (UNISA-MAGAP and SENPLADES, 2010).
Added to this is climate change, which has increased the risks to agriculture, and it’s a current and future challenge that puts into evidence the need to define
strategies and policies to prevent risks from production loss that endangers the survival of small and medium producers. There are tools to manage risks, such as the agricultural insurance (Ludeña and Wilk, 2013).
In Ecuador, agricultural insurance was implemented since July 2010, constituting itself as a public policy. It is considered as a mechanism to compensate to the small and medium producers the production costs incurred when the harvest is lost due to climatic or biologic factors. Agricultural insurance contributes to the sustainability of agricultural production; and, ensures the recovery of credit from financial institutions, if applicable. The return of credit on time is what allows financing sustainability for agricultural activities. Since agricultural insurance is part of the state policy, it must be related to food security projects, as this allows to see insurance as one of the measures to adapt and mitigate climate change (MAGAP, 2009).
The agricultural insurance implemented in Ecuador is of the traditional type, so it is possible that it suffers from problems of asymmetric information, which occurs when the insurer possesses a different knowledge from the insured about the risks he faces. In such a case, adverse selection and moral hazard have a high probability of appearing, which means that insurance has lower efficiency levels than when perfect information is handled. As a result, insurers may suffer losses greater than expected, which endangers the continuity of the provided service. In the case of Ecuador, where agricultural insurance is subsidized by the State, inefficiency implies a higher amount of public funds (MAGAP, 2009).
Despite the relevance of an analysis about the Ecuadorian agricultural insurance in the light of what was explained in the previous paragraph, at the moment there is no study available. Thus, this investigation focuses on evaluating the presence of information asymmetry in Ecuador's agricultural insurance. The results of the study allow inferring about the efficiency of the program, which creates the possibility of refining public policy, if needed. The research has importance not only within the country’s realities, but also contributes to the evaluation empirical literature of the insurance contracts, which is not abundant per se, due to the lack of reliable information.
This research seeks to answer the question of whether or not there is asymmetric information in agricultural insurance, then the hypothesis is that since a traditional agricultural insurance has been applied in Ecuador, the probability of generating this type of problems that cause inefficiencies in the market operation is high.
Insurance companies often face asymmetric information. That is, the insurer has a different knowledge than the insured about the risks he faces, which creates problems of adverse selection and moral hazard (Arias and Covarrubias, 2006). Adverse selection is generated when the insurance company finds it impossible or very costly to differentiate customers according to the level of risk they face. In this case insurance contracts for all individuals are subscribed on the basis of an average premium. This implies that premiums for high-risk users are undervalued and overvalued for low-risk users. This situation leads to low-risk clients eventually leaving the market and the insurer is left with the group of highly risky clients, which damages the profitability of the company (Wenner and Arias, 2003).
Adverse selection also occurs when insurers offer the same coverage with differentiated premiums. These make explicit the different levels of risk. Those most at risk would try to hide their real situation for a lower premium insurance. This scenario suggests that individuals who prefer to insure themselves, or who choose broader insurance coverage, are people who are at greater risk of loss. This means that, empirically, adverse selection is checked when there is a positive correlation between the coverage levels and insured’s risks. Moral risk refers to the situation when, after signing the insurance contract, customers reduce the use of good production practices by being insured. That is, the client’s behaviour changes, resulting in greater losses than expected ex ante (Wenner and Arias, 2003).
While adverse selection occurs before the insurance purchase, moral hazard is revealed after the transaction is made. On the other hand, moral hazard originates from an unobservable behaviour on the part of insurance companies (hidden actions), while adverse selection is due to a hidden knowledge of the insured, who is independent (exogenous) of their behaviour (Arias and Covarrubias, 2006).
The analysis of contracts under asymmetric information began in the 1970s, but empirical corroboration of the presence of asymmetric information began in the mid-1980s (Cohen and Siegelman, 2009). However, the literature that develops empirical evidence to determine the existence and nature of asymmetric information in an insurance market is not limited. The difficulty of empirical evidence is that adverse selection has similar consequences to ex post moral hazard, so separating the two effects is complex and strongly dependent on available information (Bardey et al., 2013).
Some empirical studies (Hanming et al., 2008) have been based on the positive correlation test between the level of insurance coverage and claims-related costs developed by Chiappori and Salanié (2000). This implies that people, who prefer greater coverage, will also generate higher costs to the insurance company. The problem with this empirical test is the fact that it is impossible to differentiate between adverse selections or ex post moral hazard. That is, either of these two information asymmetry problems can cause this positive correlation. As stated by Chiappori and Salanié (2000), this test is useful when it is necessary to detect the presence of information asymmetry itself.
Godfried et al. (2001) took advantage of a natural experiment that emerged when compulsory health insurance for Dutch employees excluded dental insurance from their package of services. Then the insured could buy complementary dental insurance or go uninsured. The authors investigated whether clients with worse dental conditions are more likely to buy insurance, which would imply the presence of adverse selection. Godfried et al. (2001) used the Probit model and they confirmed the hypothesis that, at the same time, the insurance price influences its purchase, while the level of income is not relevant.
Ospina et al. (2013) analysed the presence of moral hazard in the general system of social security in Colombian health, in particular in the contributory regime of the system, in its ex ante and ex post expressions. Using the 2011 Living Conditions Survey and a multinomial Logit model, Ospina et al. (2013), whose dependent variable referred to the action against the disease and among the independent variables were health care expenditure, type of affiliation -linked, contributory, special and subsidised-, if counts with a complementary program of health and socio-economic variables such as income, educational level, among others, the authors showed that the affiliation to a health regime and having a complementary health program increases the probability of consulting care services prevention (moral hazard ex ante).
That is, it generates ex-post moral hazard directly, since assurance increases the probability of choosing to go to the doctor or to a health services institution. When it is included in the contributory regime, increases the probability of using health services in 3.4%. A sign of presence of ex-post moral hazard is related to the value to pay for health care services: the lower the value to pay, the greater the probability of going to the doctor or the institution of medical services.
Hiraldo and Guerrero (2005) investigated the main determinants of the number of claims in auto insurance, such as type of vehicle, age, experience in driving the insured, paid premium or type of coverage chosen. The authors tested the relationship between insurance coverage and number of claims. The research used data from a private insurance company and applied count data type econometric models, specifically the binomial negative inflated zeros model. The use of the model allowed estimating the accident rate by differentiating between drivers who do not report the accidents when they have them, and drivers who do not actually suffer accidents.
Piedra and Sarmiento (2013) analysed the factors that affect individuals when choosing health insurance, as well as the use of services when they are already insured. Using data from the Health and Nutrition Survey of Ecuador in 2013, the authors modelled adverse selection based on the variables that represent agent risk factors and moral hazard in terms of the expenses incurred by affiliates in the last 30 days when they access health services and are not covered by insurance, as well as the type of insurance that the agent has. In both cases, the binomial and multinomial logit functional forms were used. The researchers did not find evidence of adverse selection. Neither did they prove the existence of moral hazard reflected in the effect that the expenditure has on the agents’ behaviour. These conclusions could be explained by lack of information and the structure of available data.
Although agricultural insurance is a variant in the insurance market, it has its own characteristics. Just et al. (1999) argue that the decision to buy agricultural insurance includes three components:
(1) The effect of risk aversion
(2) The subsidy effect (in 1988 the US government financed part of the costs of the programs and
(3) The adverse selection effect that occurs when farmers can use private knowledge to speculate against the insurer.
The results of the study show that the effect of risk aversion is small. Farmers purchase agricultural insurance, mainly, to receive the subsidy or because of the possibility of adverse selection.
The information asymmetry in agricultural insurance is given for several reasons. In the first place, the agricultural producers are dispersed, whereas the conditions of the production in each plot are different. Therefore, having fully accurate information about customers can be difficult and costly to the point that the administrative costs of an effective effort to monitor and identify legitimate and fraudulent losses can be prohibitive. A detailed description of the costs and challenges associated with conventional insurance contracts can be found in Skees (2008).
On the other hand, when "loss coverage" is too low to discourage carelessness and neglect, the market may disappear. Consequently, the insurance company loses the advantages obtained from pooling risk types, which is the essence of insurance intermediation (Arias and Covarrubias, 2006).
In contrast, when the net premium is calculated on the basis of the cost of production per hectare according to the crop, regardless of the producer's individual risk, the higher risk producers could secure several plots or expand their coverage, resulting in adverse selection.
Makki and Somwaru (2001) used the positive correlation test to examine adverse selection in a context where farmers are offered insurance based on income or performance. Using generalised logit polytechnic techniques, the authors attempted to explain peasant decisions among four or five different insurance alternatives, some of which covered only production risk, while another covered income risks, caused by a reduction in yields or prices. The risk was measured retrospectively on each farm. To calculate the probability that yields or prices reduce the insured value in the insurance contract, data of 10 years were used. Insurers could presumably use the same information to calculate the premium. However, the authors found strong evidence that high-risk farmers prefer income insurance rather than performance and individual insurance to group insurance. On the other hand, most high-risk farmers prefer broader coverage than low-risk farmers.
Sil (2005) considers the possibility that adverse selection in agricultural insurance markets is "endogenous". Farmers can get insurance to deal with yield losses per hectare and also have the option of selling part of the crop in the futures market at a certain price. Sil (2005) expects a fixed-term contract to influence the farmer who works the least on crops, regardless of whether or not he has purchased insurance. Insurers do not know if the insured has a fixed-term contract.
Heterogeneity among farmers generates endogenous adverse selection. Empirically, farmers with fixed-term contracts are more likely to choose more generous crop insurance than those without such contracts, and farmers are more likely to experience high insurance losses (about 6%).
DESCRIPTION OF THE INTERVENTION
General framework
Ecuador’s public policy regarding the protection of agricultural producers is based on the transfer of economic and technical risk to an insurance operator, in the face of an emergency situation in which the state would have to intervene (Figure 1).
Consequently, in order to implement the insurance program, a collaborative and public-private partnership approach was considered, with well-defined roles for the parties, always as a coordinated effort, following the relevant international experiences of Spain, Mexico and Colombia.
Agricultural insurance in Ecuador started in 2010 through the "Implementation of agricultural insurance aimed at family and peasant agriculture", a project that included the protection of four crops (rice, hard corn, potatoes and wheat), as well as livestock activities, aquaculture and fishing (UNISA-MAGAP and SENPLADES, 2010).
In 2011, the Ministry of Agriculture, Livestock, Aquaculture and Fisheries (MAGAP) began implementing the "AgroSeguro Project for small and medium producers and artisanal fishermen from Ecuador" (AgroSeguro). The objective of the intervention is to implement a permanent system of insurance subsidized by the State, for the benefit of small and medium agricultural producers and artisanal fishermen of Ecuador, allowing them to contract protection policies against losses of their productions, caused mainly by climatic events and biological, or physical damage (UNISA-MAGAP and SENPLADES, 2010).
The AgroSeguro project has national scope and is executed by Agricultural Insurance Unit (Unidad de Seguro Agrícola - UNISA), attached to MAGAP. UNISA’s role is to drive the Project’s dissemination, to provide permanent training for the farmer, to support the farmer against the occurrence of a disaster and to transfer the subsidy to insurance companies (Carter et al., 2014).
Agricultural insurance covers the cost of direct production, which includes labour, land preparation and a package or kit of inputs required for cultivation, without taking into account the interest on loans, post-harvest costs and the cost of insurance. The value of the insurance premium varies according to the crop. But in general the insurance premium resembles bank interest. The state grants a subsidy of 60% of the cost of insurance (but not more than 700 dollars) and the remaining 40% is assumed by the producer (UNISA-MAGAP and SENPLADES, 2010).
A beneficiary of the program can secure a maximum of 10 hectares among all crops. The number of crops that could be insured has been increasing. It started with four crops (potato, rice, corn and wheat) and from 2011 these are increased to 10 (soft corn, beans, peas, tree tomato, banana and sugar cane are added). In February 2015, the number of protected crops reached 16 (including cocoa, coffee, barley, beans, bananas and quinoa). These were defined according to the productive matrix proposed by the Government.
Target population
The target population of the project is the small and medium farmers who grow the main products (rice, hard corn, potatoes, wheat, sugarcane, bananas, soybeans, tree tomatoes and beans) with cultivated areas that do not exceed 20.
Initially, it was estimated that the project will benefit 389,635 small and medium producers with assured crops of 511,088 hectares. This population was joined by 2,855 families from the PROFORESTAL a Project, co-financed by MAGAP, with a planted area for August 2010 of 2,259 hectares. And, finally, the 43,634 licensed artisanal fishermen (UNISA-MAGAP and SENPLADES, 2010) were considered.
Operational approach
At the time when the project was started, the country had a single company that offered the agricultural insurance. Because of this, the government began its agricultural insurance subsidy program with QBE-Seguros Colonia.
However, as of June 2013 the State took the decision to boost the offer through the public insurance company Seguros Sucre S.A. Thus, only the policies issued by this company were considered eligible for the subsidy. The agricultural insurance contract signed between producers and the insurance company, is multi-risk type, which covers the individual losses of the insured. Carter et al. (2014) characterises these contracts in the following terms:
Covered risks: drought, flood, hurricane, frost ( in the mountains), excess humidity, pests and uncontrollable diseases and fire; Period of coverage: 120 days of cultivation from sowing
In case of loss: A claim form must be submitted to the insurance company within a period of no more than 10 days after the accident. Usually this is channelled to the insurance company through the intermediary bank. Once the form is received, the insurance company plans a visit to the insured's crop.
If there is a total loss (85% crop loss): if the technician or adjuster sent by the insurance company declares a total loss, the compensation comprises the amount invested up to the moment of the loss (as long as it is less than the insured amount), excepting the deductible.
If there is a partial loss: if the adjuster declares a partial loss of the crop, at least one additional visit to the plot is established. 10 days prior to harvest the insured must send a harvest warning form to the insurance company. Then, the technician visits the plot again and makes a sampling to estimate the yields that will be obtained. If the crop’s value is less than the insured amount, the corresponding compensation is equal to the difference between both sums, minus the deductible.
The deductible is 30% of the value of the loss: For this type of contract, the farmer is expected to be will be fully protected in case of loss for the stipulated reasons, and to receive the corresponding compensation to his loss (minus the deductible). However, there are several difficulties that fail to meet expectations.
Generally speaking, the insurance company would compensate if the crop’s value per hectare is less than the insured value per hectare. That is, if the yield (R = quintals / ha) multiplied by the reference price (which is fixed in the contract) is less than the insured value (M). What equals P * R <M. Carter et al. (2014) note that the contract’s complexity leads to confusion among policyholders, including:
(1) The insured does not send a notice of loss, and therefore the insurance company never knew about its loss, despite having been a covered loss. The failure to submit a claim may be due to a lack of information. This has been the case for farmers who were unaware that they were insured, or whose insurance policies came after the relevant period. Some reasons for these mishaps have been the failure of the intermediary bank to transmit to the insured the information of the agricultural insurance, delays in processing the insurance policies with the insurance company, as well as delays in transferring funds from the State’s subsidy to the insurance company. The study found that 45% of those interviewed did not make the claim because they were unaware of their status as an insured or complaint procedure. On the other hand, the insured must incur high transaction costs to ensure that the insurer receives his claim form and make the adjuster's visit to his estate complete. In the same way, the affected must make visits and calls to both the intermediary bank and the insurance company. These are efforts and expenses that not all policyholders are willing to take on. Statistics show that 34% of 107 producers did not make the claim, despite suffering losses in the crop. This fact is explained by lack of time or by the perception that it is a waste of time to make a claim. The insured distrusts that the claim is taken care of by the insurance company (or the bank) or it is anticipated that the amount of the compensation will not compensate the transaction costs. Consequently, of the total of policies that presented claims between 2011 and 2012, only 73.5% of rice and hard corn producers filed the claim.
(2) In many cases, the insured does not understand that they have only up to 10 days after the incident to send their notice of loss. Failure to comply with the notice period means that the insurance company will reject the claim or apply a penalty to the insured sum, depending on how late the notice was made. In the study, most producers confused the term of coverage with the notice, stating that they had between 12 and 120 days to make the notification of loss.
(3) The insured successfully sent out his claim notice but it was a partial loss and subsequently failed to submit his harvest notice form. In this case, you lose all right to compensation.
(4) The insured area assumed by the farmer may differ from the area actually insured, which means that the compensation may differ from what the farmer expects. The majority of producers, according to the study realised that their insured area was greater than that actually contained in the contract.
(5) The crop coverage period is limited to 120 days, which the farmer may not understand and think that his crop is protected until harvest, even if it is carried out more than 120 days after sowing. As an example of this, in the Celica canton, farmers let the corn dry in the plant and then harvest it, which can lead to a crop of four months to take up to six or seven months. In the case of the Daule canton the rice plagues used to arrive near the harvest, when the period of coverage was finished. Other types of problems that may prevent the insured from having full protection against losses due to covered causes are the differences between the performance actually obtained and the estimate made by the adjuster using the insurance company's methodology. In addition, there could be differences between the estimates made by the adjuster of the insured’s crop management activities and the real management activities.
It can be concluded, ignorance or misunderstanding of the contract may lead the insured to be unprotected despite having contracted agricultural insurance.
Model
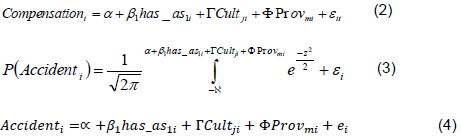
The evidence of asymmetric information in Ecuador's agricultural insurance system is explored by Cohen and Siegelman (2009). The authors argue that a natural way of proving the existence of asymmetric information is by estimating the correlation between insurance coverage and risk. Then, the proposed model is as follows:
Where yi is the risk, given by the binary variable that takes the value 1, if the insured suffered the loss and 0 in the opposite case; xi is the number of insured hectares; X is the vector of the insured’s potentially relevant observable characteristics to determine their level of risk. β1 is expected to have a positive sign. In this case, the probability of loss increases when service coverage is increased. That is, the existence of a positive correlation indicates the presence of asymmetric information.
Cohen and Siegelman (2009) pose that yi of the previous model can also be represented by a continuous variable such as the total cost paid by the insurance or the compensation in case of a loss; or a discrete variable such as the number of claims. With these considerations to estimate the presence of information asymmetry, the following functional forms of (1) were used:
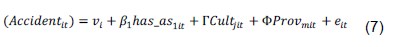
Where Compensationi is the compensation value received by the insured i in case of loss; (Accidenti) is the risk, given by the binary variable that takes the value 1, if the insured had the loss and 0 otherwise; has_as1i is the number of insured hectares; Cultji is a dichotomous variable that represents the crop j; Provmi is the dichotomous variable that represents the province m.
Data
Data from AgroSeguros were used to estimate the presence of information asymmetry in the Ecuadorian agricultural insurance system. Two data files were issued: policies issued in the period between January 2010 and March 2014 per insured individual and the claims occurring between January 2010 and December 2013. In total, the information contained 35,826 insurance policies and 8,653 claims.
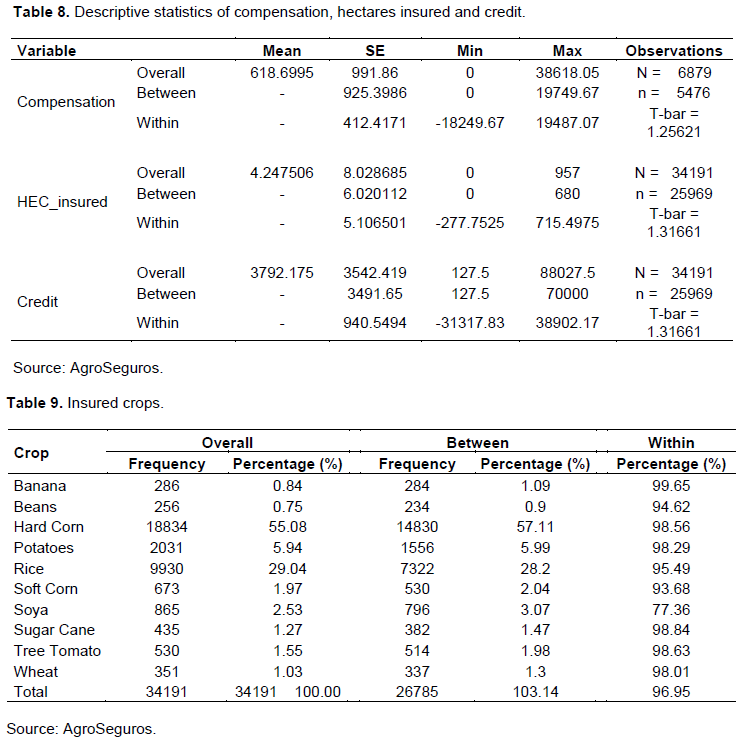
However, at the time of consolidating the two files available, part of the initial information was lost due to errors caused by lack of a common IT system for different participating actors and the information transfer from the QBE-Seguros Colonial to the Seguros Sucre insurance company in 2013. Therefore, the final was an unbalanced data panel composed of 34,188 observations in the period 2010 to 2013. Of the total sample, 6,975 policies had an accident. 5,501 of them were compensated. The 1,477 claims were not compensated for different reasons, as explained earlier (Table 7).
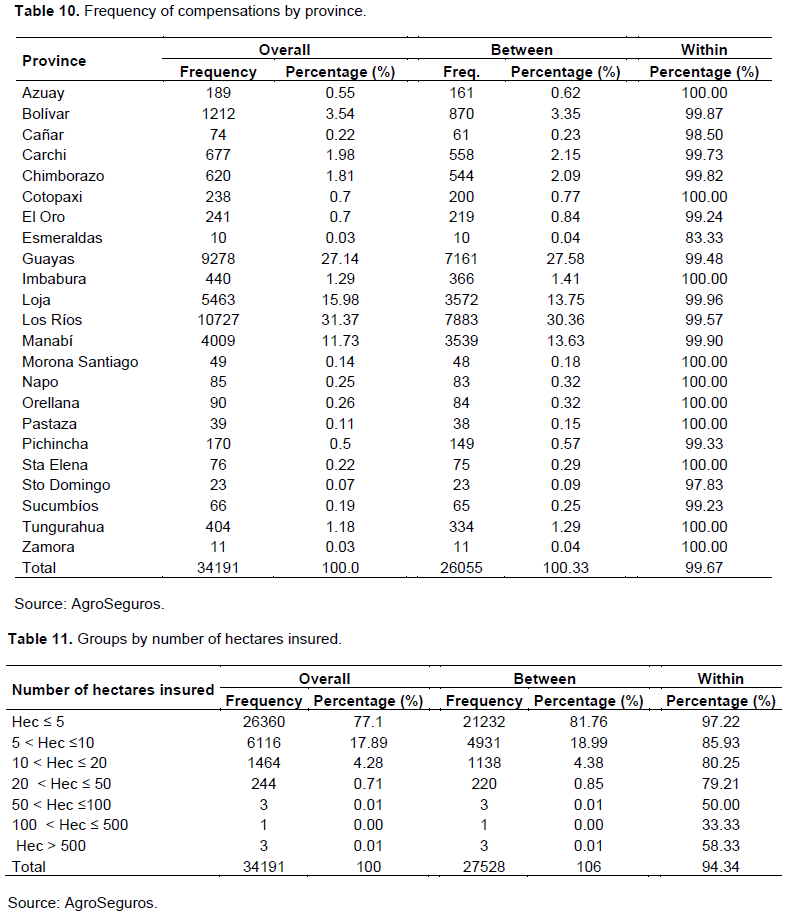
The average compensation value is 619 dollars, that is, it does not exceed the maximum subsidy value of the State. The area of ​​crops insured on average does not exceed the 10 hectares forecast by the project. On average, the insured received a $ 3,792 credit. There is a strong variability between the individuals in the sample (between), in relation to the three mentioned variables, but the individual parameters (within) are maintained without substantial changes throughout the analysis timeframe, except in relation to credit, where a rather variable behaviour is noted (Table 8).
The highest number of policies was issued for hard corn crops (55% in the whole sample, similar to the frequency among individuals that came to be 57.1%); Followed by rice with 29% of the whole sample and potatoes with 6%. The remaining crops are eventually insured. From the within distribution it can be seen that individuals insure the same crop over time (Table 9).
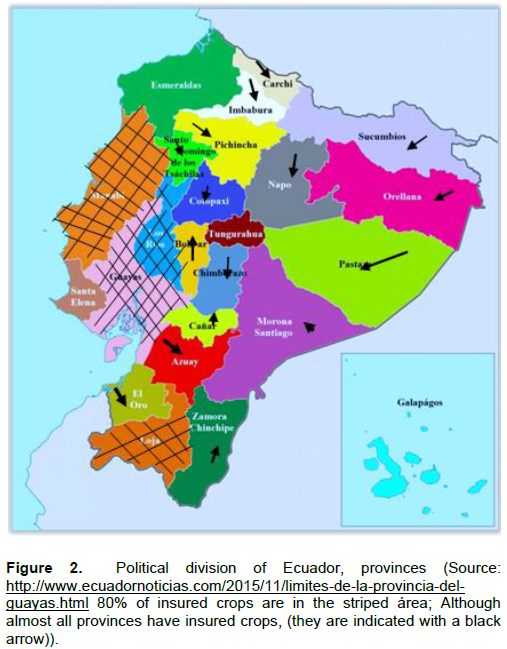
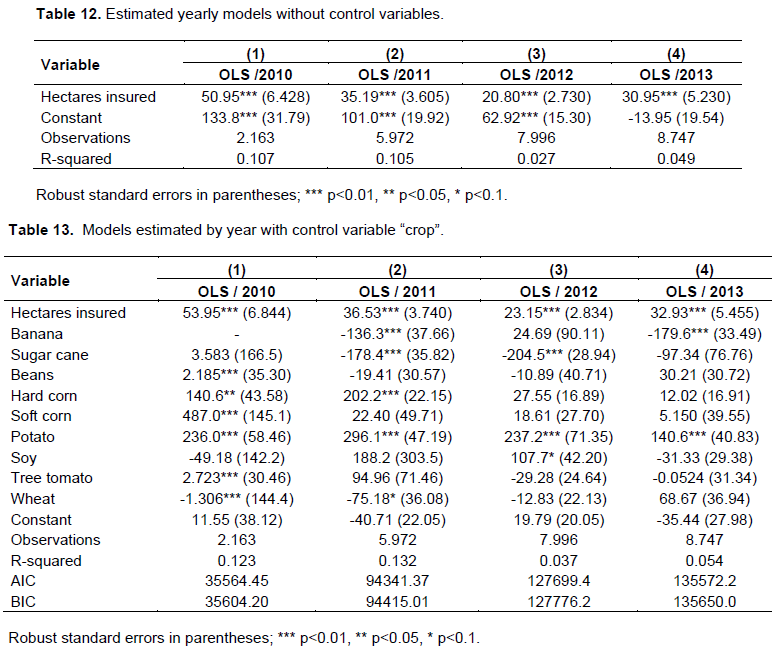
Regarding the provinces, 80% of insured crops correspond to Guayas (Figure 2), Los Ríos, Loja and Manabí, which is consistent with the spatial distribution of the most insured crops (Table 10). 95% of farmers in the sample insure up to 10 hectares. They are counted cases when the surface assured exceeds 50 has. A typical data, resulting from the logging error, are considered and are not used in the estimation. In general, it is not common to secure more than 10 ha. The cases that are given are the exception rather than the rule (Table 11).
Descriptive analysis of the results of the intervention
The agricultural insurance coverage under the state subsidy program has a steady growth. While in 2010 2,173 policies were issued, in 2013 this figure reached 9,612. Simultaneously, the area of ​​insured crops increased from 11,773.44 to 37,959.28 hectares per year. At the same time, the accident rate a decreasing trend, while it is possible to speak of a learning curve in insurance management. In total, $ 5.58 million of compensation was paid in the period cited (Table 1). Hard corn is the most important insured crop, both in relation to the number of policies issued, and the area insured. Second is the rice, followed by potato crops. This structure of agricultural insurance is maintained in the years 2010 to 2012, while in 2013 the soybean, which grew steadily over time, replaced the potato crop, placing it in the third place of importance (Table 2).
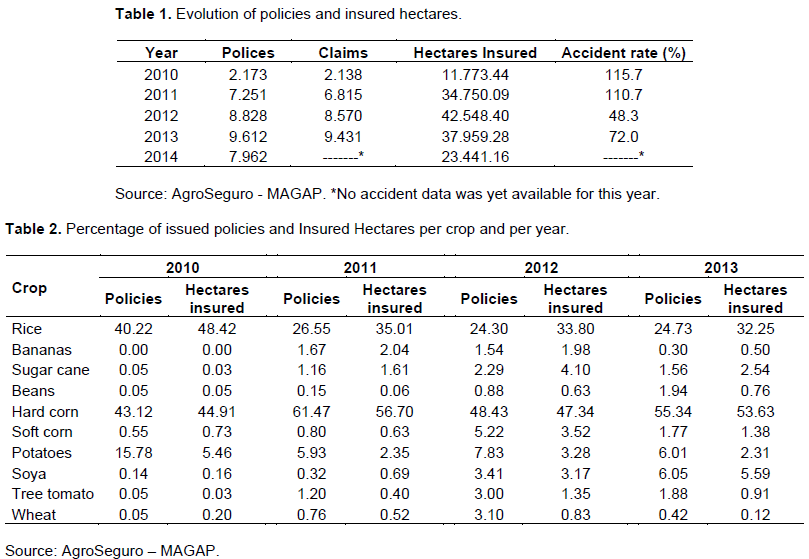
The predominance of maize and rice within insured crops Carter et al. (2014) explains why maize farmers have limited access to irrigation and are therefore more likely to mitigate the risk associated with potential drought. While policies for rice farmers are issued more frequently, because sowing is done up to three times a year.
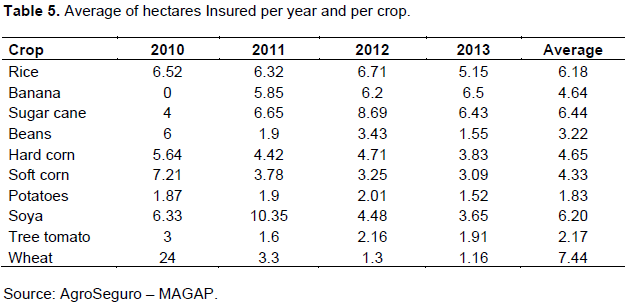
The insured surface depends on the crop. In the case of rice, soybeans and sugar cane, the insured crop has about 6 hectares on average. For bananas, soft corn and hard corn this figure oscillates around 4 ha. While tree tomato, potatoes and willow have between 2 and 3 ha on average (Table 3).
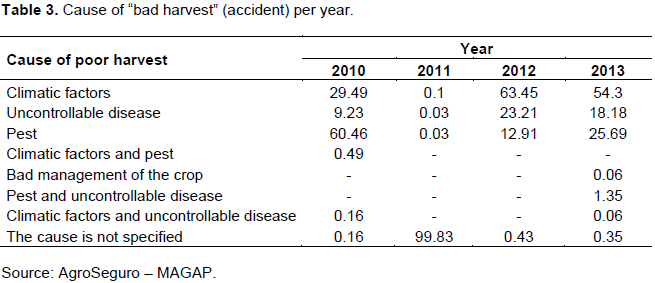
The claim to insurance is associated, mainly, with one of the causes that cause "bad harvest". In 2010, 60.46% of the losses were caused by pests, 29.49% by climatic factors and 9.23% by diseases in the crops. In 2012, crop damage occurred in 63.45% of cases due to excess moisture. The 23.21% of the claims were caused by uncontrollable diseases and 12.91% by the pests. In 2013 insurance claims were related to losses caused by severe drought (54.3% of cases), plagues (12.91%) and diseases (23.21%) (Table 4).
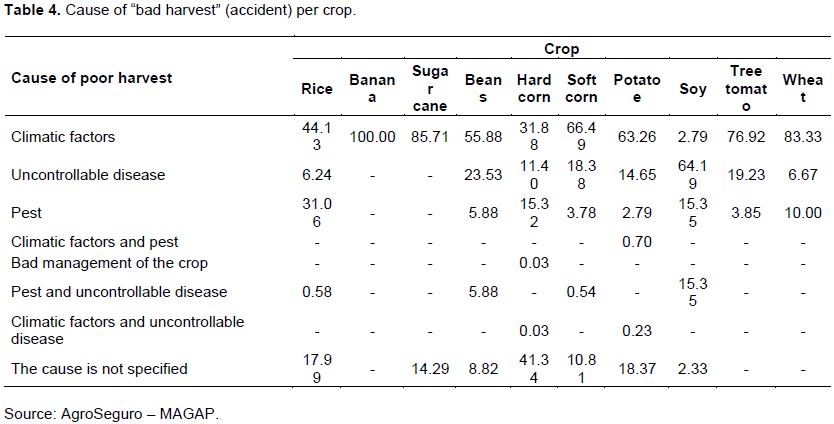
In relation to 2011, where there is no specific information on the cause of "bad harvest", Carter et al. (2014) argue that most of the incidents were caused by drought in the case of maize farmers, while pests affected rice crops. In general, it can be said that for all crops, except for soybeans, climate is a predominant factor that explains the losses in agriculture. Disease and pests follow. The latter are more important for rice, maize and wheat crops (Table 5).
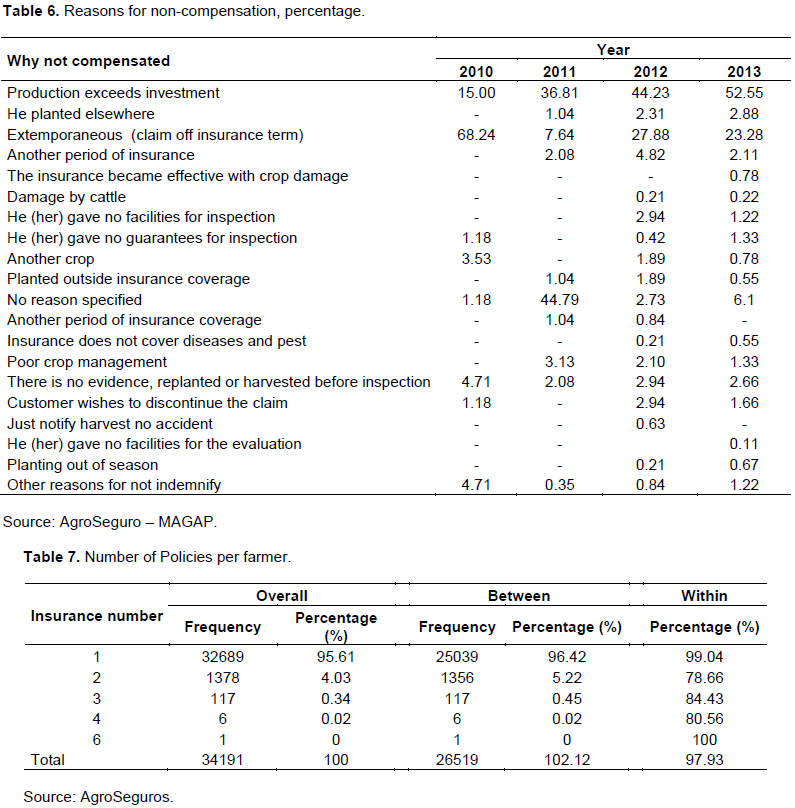
Of all the complaints filed between 2010 and 2013, 23% of the cases did not receive a satisfactory response. In 2010, the main cause of non-compensation was the filing of the claim outside the term established by the insurance contract. In subsequent years the percentage of extemporaneous claims was reduced substantially, however, the figure still stands at 23.28% for 2013. Since 2011, the main cause of claim rejection is because the amount of income per crop exceeds the investment. In 2011, this was the cause of non-compensation for 36.81% of cases, in 2012 for 44.23% and in 2013 for 52.55%. In 2011, for a significant proportion (44.79%) the reason for non-compensation is not specified (Table 6).
Results to verify the presence of asymmetric information
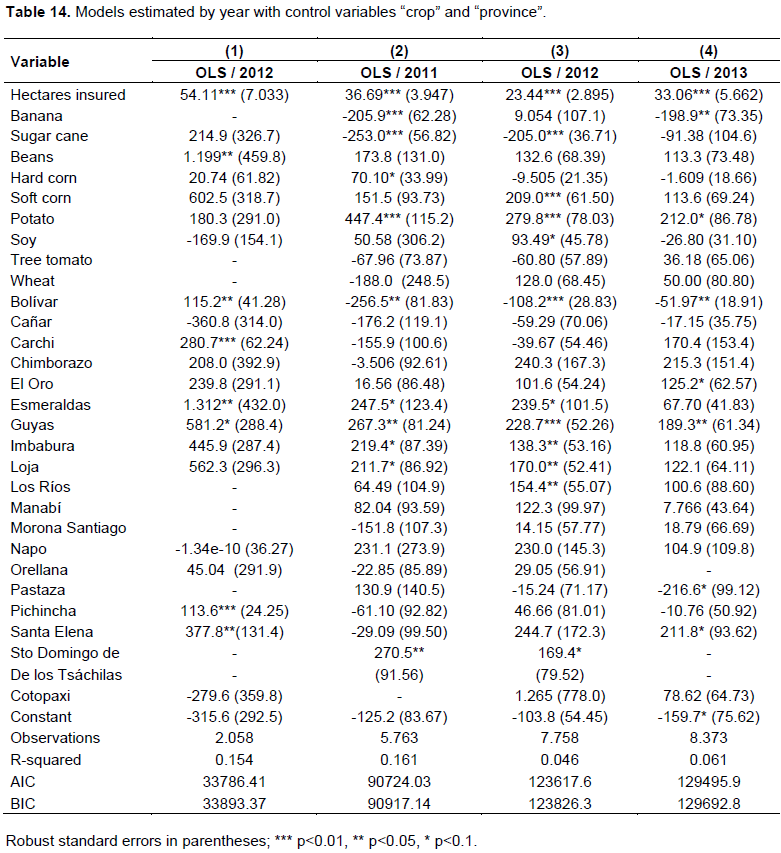
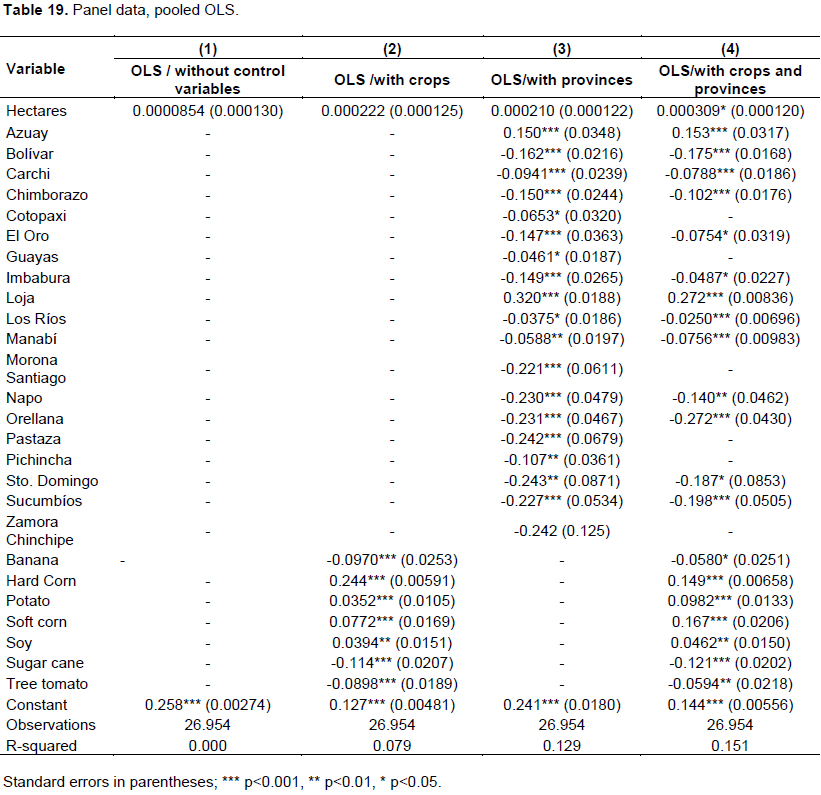
The estimation of (2) was performed using cross-sectional data using the Ordinary Least Squares (OLS) method since, according to Cohen and Siegelman (2009), as previously mentioned; one way of deprecating the existence of asymmetric information is to use the payment for the claim as the dependent variable. We found the presence of information asymmetry for all years. The estimation of different specifications of (2) shows similar results, so the results can be considered robust (Tables 12 to 14).
Models that include the variables "crop" and "province" as the explanatory variables (Table 14) show an increase
in compensation for each additional hectare insured. In 2010, this increase was of 54.11 dollars the highest, while in 2012 it was its lowest reaching $ 23.44. On average, during the four years, the compensated amount increases in approximately $ 37 dollars for each insured hectare.
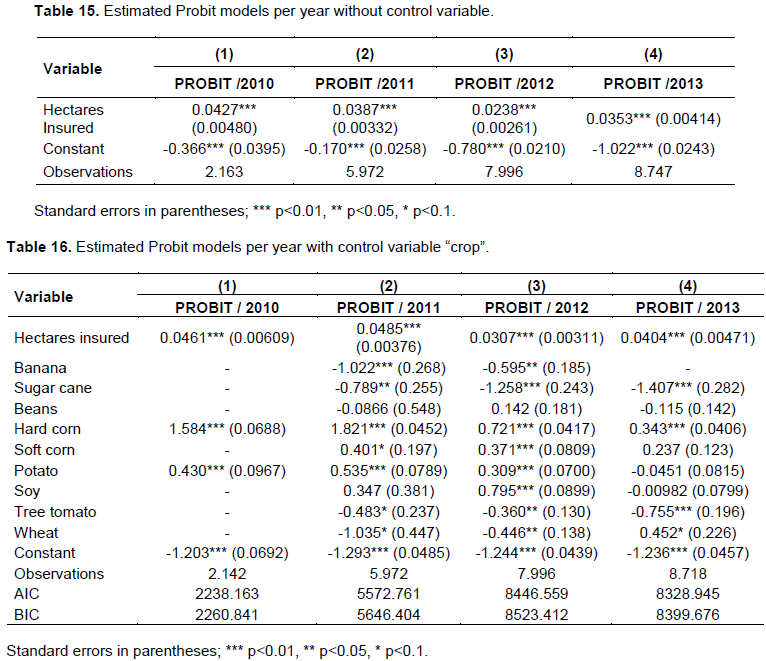
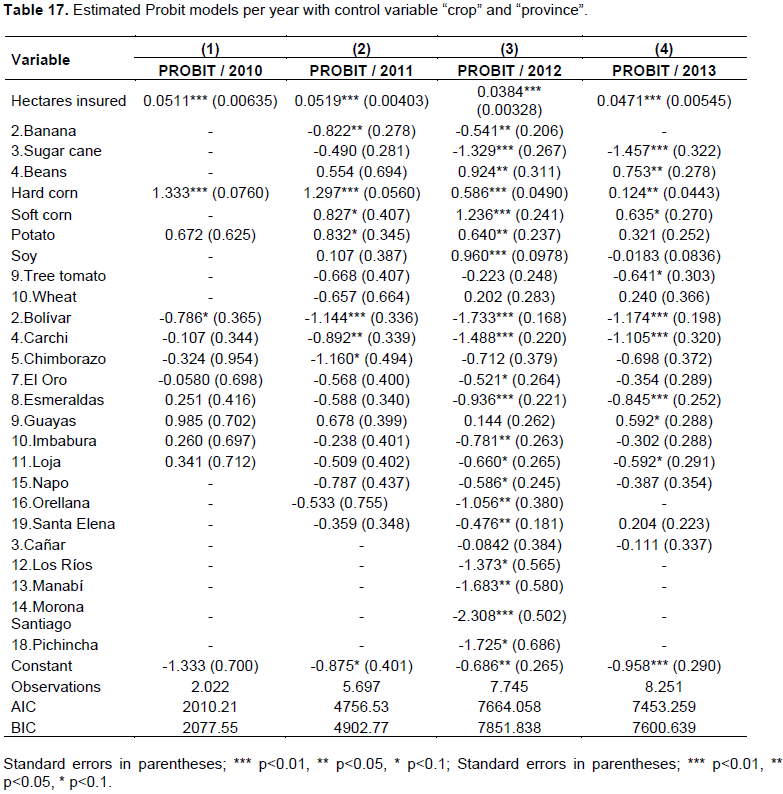
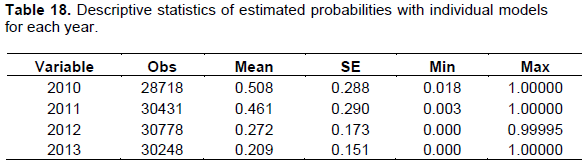
The estimation of (3) with the cross-sectional data using the Probit model shows a good degree of adjustment, especially in the models that include the variables "crop" and "province" (complete). In these models, the coefficient of insurance coverage is significant for all years, indicating the presence of persistent asymmetric information and in each year has a predictability of 79%, on average (Tables 15 to 17). In these models, it can be deduced that, by increasing the number of insured hectares by one, it could be said that in all years, the probability of loss increased by about 1.4%.
When estimating the odds of loss with the full models, it is evident that the highest odds of loss, on average, were for 2010 and 2011, when there was actually the highest level of loss. The estimated average values are 50.8 and 46.1%, respectively, in the years cited (Table 18).
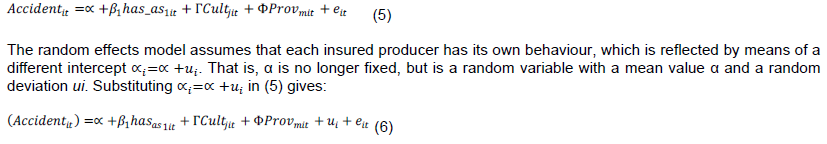
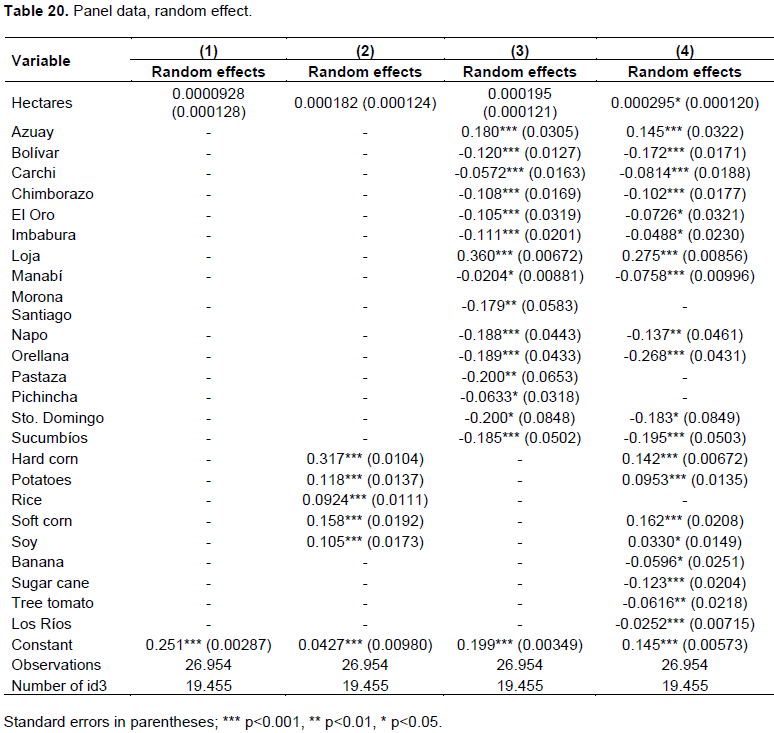
The estimation of (4) was performed with panel data. At first, the panel structure was ignored, and the estimation was done with a pool of data using ordinary least square (OLS) (Table 19). The estimation results show that the insurance coverage variable is relevant and has the sign data panel structure (4) can be rewritten as:
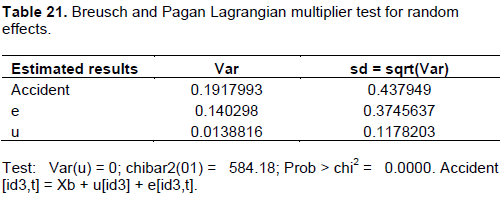
If the ui variance of (6) is zero, there would be no relevant difference between equations (4) and (6). However, the Breusch and Pagan test, known as the Lagrange Multiplier Test for Random Effects, shows that the random effects model is preferable to that of pooled data (Table 21).
Specification 4 of (6) shows that the coverage variable is statistically significant and has the correct sign, which allows to evidence the information asymmetry. It is observed that the loss probability increased by 0.029% for each additional insured hectare, which coincides with the results obtained with pool data (Table 20).
Another way to model the "individual" character of each insured is through the fixed effects model. This model assumes that the differences between insured are constant or "fixed" - and therefore each intercept vi must be estimated, which could be done using dichotomous variables in order to estimate the differentiated intercept:
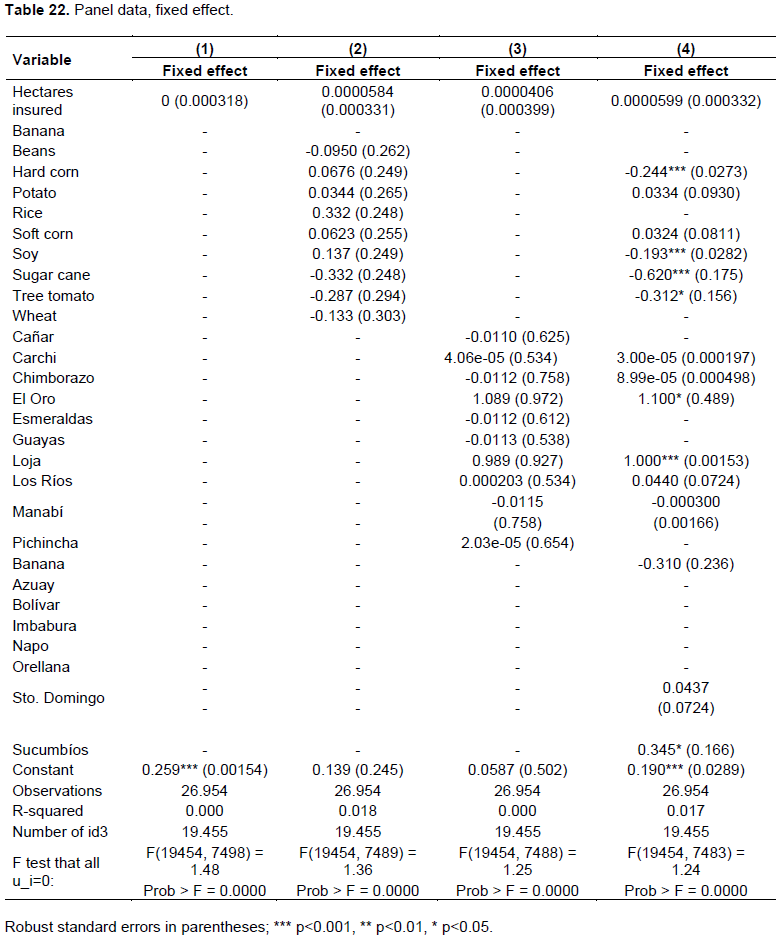
Where vi is a vector of dichotomous variables for each insured. The F significance test shows that the fixed effects model is preferable to that of the pooled data, because Ho is rejected (all dichotomous variables of the individuals are zero), which means that at least some dichotomous variables belong to the model (Table 22).
The Breusch and Pagan tests for random effects, and the F test suggest that the data panel structure should not be ignored, which is to say that both the random effects model and the fixed effects model are preferable to the model with grouped data.
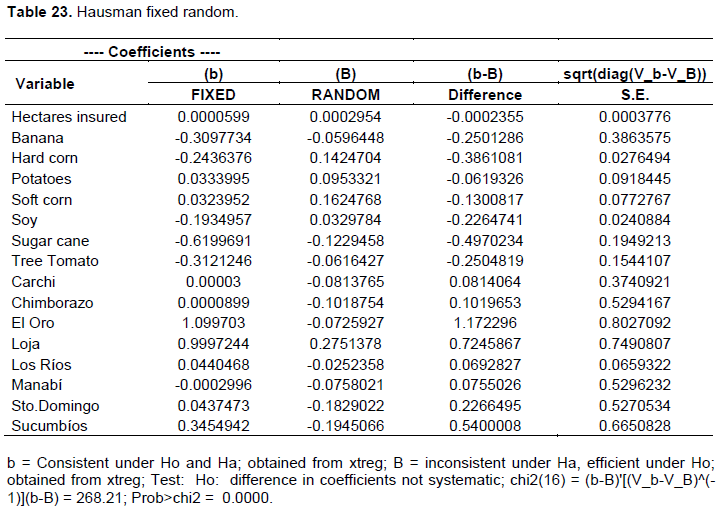
In order to choose between the fixed effects and the random effects model we observe the possible correlation between the individual error component and the X variables. The random effects model assumes that this correlation is equal to zero. For this, we use the Hausman test where Ho: the random effects and fixed effect estimators do not differ substantially. Table 23 shows that Ho should be rejected, the estimators do differ, concluding that the fixed effects model is preferable to that of random effects.
However, it is observed that in the fixed-effects model, the variable coverage is not relevant, and in sum, the model does not seem to be good. Since fixed-effect estimators are less efficient than random effects, both being consistent, in this case the random effects model provides more estimates that are reliable.
In sum, the existence of a positive relationship between the probability of risk and the coverage would be evidenced by the existence of asymmetric information in Ecuador's agricultural insurance program (Table 24). The existence of asymmetric information makes the insurance markets not efficient, especially those who handle expected only in model 4, when the variables "province" and "crop" are included as control variables. Thus, when coverage increases by 1 ha, the probability of loss grows by 0.03%. It is also observed that the probability of loss increased more in the crops of hard corn (14.9%) and mild (16.7%) compared to the rice crop. To consider the agricultural insurance, because the information of the insured is more difficult to monitor in order to verify the behaviour of the producers, as being so dispersed is implies higher costs.
.png)
This is precisely why governments generally intervene through subsidies or public enterprises. In Ecuador, the traditional insurance implemented has many limitations because there is a rather heterogeneous structure of small, medium and large-scale agricultural sector, although for a long time it has remained a strategic sector for food supply, generation of foreign exchange, employment, among others.
The verification of the existence of asymmetric information is very important to promote insurance that considers indexation, in our country an index of productivity, which overcomes the asymmetries, would be appropriate, where the market is viewed as a mechanism of resource allocation.
In recent years, new mechanisms have emerged that overcome the problems of traditional insurance. One of the most precise uses climatic indexes, for which adequate databases and from several sources are required, which is a challenge for the country and its government. It is easier to start with productivity rates. Research on how to obtain valid and sufficient information to construct climate or other indicators to eliminate the existence of asymmetric information is precisely one of the outstanding issues for researchers. It is also important to promote mechanisms that allow for more reliable and accurate information on the processes of insurance.
Since 2010, Ecuador's small and medium-sized farmers have agricultural insurance. It is a system of insurance subsidized by the State, which allows small and medium producers to contract protection policies against losses of their productions, caused mainly by climatic and biological events, or physical damages. The insurance contract is a multi-risk type. However, it is not always effective to protect farmers from the casualties that have occurred. The main causes of this are the document’s complexity and the compensation’s calculation method.
Subsidized agricultural insurance is a new system for the country, so it is in a learning process, where the program’s evaluation and consequent adjustment are important. In this sense, the role of UNISA as a unit that coordinates and administers the program must be reinforced.
This investigation focused on evaluating the presence of information asymmetry in the agricultural insurance system. In this sense, the correlation between the service coverage and the risk of the accident was estimated. The linear model and Probit were used, with the application of OLS in the first case and of maximum likelihood, in the second. Estimates were made for each of the years in the period 2010 to 2013, as well as with pool and panel data. The results of the estimates suggest the presence of information asymmetry in the Ecuadorian agricultural insurance, which means that the cost of the program is greater compared to the same in conditions of perfect information.
The type of information available does not allow the study to be deepened to identify the nature of asymmetric information. That is, it is not possible to differentiate between adverse selection and ex-post moral hazard. However, since access to insurance is done through bank credit or because the beneficiary is part of a MAGAP program, moral risk is expected to exist rather than adverse selection. The corroboration of this idea requires having the information about the socio-economic characteristics of the beneficiaries, in addition to the insurance policies and the number of accidents.
However, the results of the investigation are valid as they suggest adopting a different strategy for agricultural insurance, which allows overcoming the problems of inefficiency generated by asymmetric information. One proposal of this may be insurance based on performance indices. These indices can be calculated based on data from the Production and Harvest Survey of the National Institute of Statistics and Censuses (Bardey et al., 2013)
From the aforementioned it could be deduced some recommendations like: among the most important are the administration of the forms of policies and claims registration, in order to obtain valid information and without variations from one to another intermediary. Expanding the number of beneficiaries through continuous financial education, as insurance has barely a penetration level of 1.7% from 2010 to 2013, while in 2014 it increased to 4%, according to the figures analyzed in the database. Encouraging the aggregation of data in the registry of those who buy policies and those who make the claims, in order to have more variables that allow greater accuracy in the study. This has been one of the limitations of this investigation, as it did not count with sufficient data for other important socioeconomic variables of the insured such as gender, age, among others.
The authors have not declared any conflict of interests.
REFERENCES
|
Arias D, Covarrubias K (2006). Seguros Agropecuarios en Mesoamérica: Una oportunidad para desarrollar el mercado financiero rural. Retrieved from
View
|
|
|
|
Bardey D, Zapata JG, Buitrago G, Concha T (2013). Mercado de seguros voluntarios de salud en Colombia: Informe Final. Retrieved from Repositorio Institucional Fedesarrollo:
View
|
|
|
|
|
Carter M, Boucher S, Castillo MJ (2014). Abril 28. http://www.espae.espol.edu.ec. Retrieved from SEGUROS INDEXADOS: TECNOLOGÍA FINANCIERA INNOVADORA PARA ROMPER EL CÍRCULO DE RIESGO Y POBREZA RURAL EN ECUADOR:
View
|
|
|
|
|
Chiappori PA, Salanié B (2000). Testing for Asymmetric Information in Insurance Markets. Journal of Political Economy, 108:56-78
View
|
|
|
|
|
Cohen A, Siegelman P (2009, Noviembre 11 // DOI: 10.1111/j.1539-6975.2009.01337.x). Testing for Adverse Selection in Insurance Markets. Retrieved from
View
|
|
|
|
|
EL TELEGRAFO (2013, Junio 21). Agricultura familiar representa el 70% de la producción.
|
|
|
|
|
Enríquez C (2014, Diciembre 30). El Salario Básico Unificado del 2015 subirá a USD 354. EL COMERCIO, p. Actualidad.
|
|
|
|
|
Ospina GA, Martínez JH, Osorio PDF (2013). Riesgo moral en el régimen contributivo del sistema general de seguridad social en salud colombiano. Revista Académica e Institucional (Proyecto de Investigación "Riesgo moral del régimen contributivo del sistema de salud nacional"), 175-192 // ISSN-e 0121-1633 //
View.
|
|
|
|
|
Godfried M, Oosterbeek H, Tulder FV (2001). Adverse selection and the demand for supplementary dental insurance. De Economist, 149:177-190 // doi:10.1023/A:1017566901875 // http://link.springer.com/article/10.1023/A:1017566901875.
Crossref
|
|
|
|
|
Hanming F, Keane MP, Silverman D (2008). Sources of Advantageous Selection: Evidence from the Medigap Insurance Market. J Polit. Econ. 116:303-350.
Crossref
|
|
|
|
|
Hiraldo MM, Guerrero CF (2005). Los siniestros en el seguro del automóvil: un análisis econométrico aplicado. Estudios de Economía Aplicada, abril, 2005, pp. 355-375 // http://www.redalyc.org/pdf/301/30123117.pdf. 23:1.
|
|
|
|
|
INEC (2001). Estadisticas del Censo Agropecuario. Quito-Ecuador: INEC.
|
|
|
|
|
Just R, Calvin L, Quiggin J (1999). Adverse selection in crop insurance: Actuarial and asymmetric information incentives. Am. J. Agric. Econ. 81:834-849 // 12:44:59 2007 //
View.
|
|
|
|
|
Lude-a C, Wilk D (2013). Ecuador: Mitigación y Adaptación al Cambio Climático. Marco de Preparación de la Estrategia 2012-2017 del Bid en el Ecuador. Retrieved from www. iadb.org:
View
|
|
|
|
|
MAGAP (2009). Dise-o de un Sistema de Seguro Agrìcola para el Ecuador. Quito-Ecuador: MAGAP.
View
|
|
|
|
|
Makki SS, Somwaru A (2001). Evidence of adverse selection in crop insurance markets. J. Risk Insur. pp. 685-708.
Crossref
|
|
|
|
|
Medina F, Garrido A, Iglesias A (2010). Factores Explicativos de la Contratación de Seguros por parte de los Productores Ecológicos de fruta y cereal en Espa-a. Revista Espa-ola de Estudios Agrosociales y Pesqueros, pp. 95-118.
|
|
|
|
|
Piedra JA, Sarmiento LS (2013). Riesgo Moral y Selección Adversa en el Sistema General de Aseguramiento de Salud para el Ecuador. Cuenca - Ecuador
View: Repositorio de la Universidad de Cuenca.
|
|
|
|
|
Sil J (2005). Endogenous adverse selection: evidence from U.S. crop insurance. AGRICULTURAL & RESOURCE ECONOMICS, 1-47, UC BERKELEY.
|
|
|
|
|
Skees J (2008). Innovations in index insurance for the poor in lower income countries. Agricultural and Resource Economics, Review 37:1
|
|
|
|
|
UNISA-MAGAP, SENPLADES (2010). Programa AGRO SEGURO para peque-os y medianos productores y pescadores artesanales del Ecuador. Quito // Acuerdo Ministerial 388/2011: UNISA-MAGAP.
|
|
|
|
|
Wenner M, Arias D (2003). Agricultural Insurance in Latin America: Where Are We?". Paving the Way Forward for Rural Finance: An International Conference on Best Practices. Washington, D.C. 2–3 June, sponsored by USAID: Edited by Catherine Ford and Eliza Waters.
View.
|
|