ABSTRACT
The study analyzes the effect of tax incentive on the growth of small and medium-sized enterprises (SMEs) in Rwanda taking SMEs in Nyarugenge as a case study. Qualitative and quantitative research approach was adopted. The population includes 49000 SMEs from agricultural, industrial, services and tourism sectors operating in Nyarugenge district. A sample of 136 SMEs was determined using Silovin and Yemen’s formula of sample size. Simple random and purposive sampling techniques were used to select the sample. The data set was analysed using descriptive statistics. A multiple regression analysis was used to explain the relation between variables. The results from the study revealed that 75.7% of the respondents agreed that they know the tax laws, 78.7% agreed that they know the tax incentives that are available to SMEs. The results further revealed that wear and tear, loss carried forward and value-added tax (VAT) refund as the most tax incentives available to Rwandan SMEs as evidenced by 100, 94.1 and 95.6%, respectively. The study indicated that there was a strong positive and significant relationship between tax incentives and the growth of small and medium enterprises in Rwanda as approved by coefficients of correlation equal to 88.8% of R-square. This meant that only 11.2% of the variation in the growth of SMEs was outside the tested variables. The study concluded that tax incentives are the key to the sustainable growth of SMEs. The government should design policies that specifically address issues related to the sustainable growth of SMEs.
Key words: Tax, tax incentive, small and medium-sized enterprises (SMEs), growth.
The theory behind using tax incentives to promote small and medium-sized enterprises (SMEs) is at its core from the finance theory of net present value (NPV) decision rule. The rule implies that firms continue to spend on capital assets and R&D as long as the present value from an additional unit of capital or R&D is equal to or exceeds the cost of the additional unit. Consequently, it is assumed that businesses would consider tax implications in their calculation of the value of their expenditure decisions since any reduction in the cost of capital caused by tax policy leads to an equal increase in expenditure (Hansson and Brokelind, 2014).
SMEs play a vital role in the economic development of a country. Studies have indicated that SMEs contribute
more than 50% of the gross domestic product (GDP) in many developing countries. More still, SMEs are the largest employers where by more than 90% of the working force is employed by SMEs.
In a bid to stimulate growth of SMEs, a number of countries have used tax incentives, for both investors and listing firms, to promote activity on SME boards. Tax incentives for investors are the more common approach, particularly in advanced markets (Mintz and Chen, 2011). For instance, Poland adopted the policy of encouraging investment in shares of SMEs through removing so-called “back-end” taxes, which are the taxes applied to profits made when selling a security.
In South Korea and India, investors benefit from reduced capital gains taxes on SME equity investments. This is done via the cutting of short-term capital gains tax in half, from 30 to 15%, for shares listed of SMEs. The UK and Spain adopted a tax incentive policy where the retail investors may deduct a set percentage of the value they invest in shares of SME equity. This happens via offering tax offsets only for acquiring shares in new SME equity offerings. In France, the investors can get a tax credit of 18% of the value invested in innovation mutual funds French acronym. The latter invest at least 60% of their portfolios in SME equity. Though these policies have been adopted the possible outcome may not significantly affect entrepreneurs as their interest rather lies with the capital influx from equity offerings in SMEs (Broersma and Gautier, 2017).
Belgium offers several investment allowances. The general investment deduction for SMEs amounts to 10.5% of the depreciation taken on assets. The rate varied between 10.5 and 12.5% since 2009. The incentive is restricted to companies with fewer than 20 employees. Unused amounts can be used in subsequent years with a maximum carry-forward of € 946,800 (or 25% if the unused part exceeds € 3,787,210). Additionally, an allowance of 20.5% is granted to SMEs for investments in safety measures either in the year of the investment or the following year. Concerning carry-forwards the same rules apply as for the aforementioned deductions. A national interest deduction is available for all Belgian companies. It amounts to 4% of qualifying equity. SMEs, however, are allowed to deduct an additional 0.5%. Since 2012, carry-forwards are no longer possible (De-Wit and De-Kok, 2014).
Austria does not offer special tax incentives for SMEs on the firm level. There is only an adjusted minimum tax for newly founded companies of € 1,092 that merely benefits low-income companies. On the shareholder level, Austria grants full exemption to income from participations in unlisted European SMEs (that is, dividends, capital gains and interest payments) for so-called intermediary investors. Intermediary investors must be corporate entities financed with equity capital. For individual investors, dividends from such intermediary investors are exempt from income taxation up to € 25,000. Enterprises are exempt from the value-added tax (VAT) if their turnover is lower than € 35,000. Moreover, enterprises with less than € 100,000 of turnover in the preceding year only have to file VAT returns and make VAT payments on a quarterly basis (instead of monthly). Suppliers with a turnover of less than € 110,000 may pay VAT on a cash basis (De-Wit and De-Kok, 2014).
Bulgaria does not have special tax incentives for SMEs. Small companies are subject to administrative reliefs, though. Enterprises whose net sales in the previous year were below BGR 300,000 (≈€ 150,000) do not have to make advance tax payments and those with net sales below BGN 3,000,000 (≈€ 1,500,000) only have to make quarterly advance payments (instead of monthly). In addition to that, simplified accounting standards apply for SMEs. VAT registration is only required for enterprises with more than BGN 50,000 of turnover (De-Wit and De-Kok, 2014).
Croatia provides comprehensive investment incentives for new undertakings. Income from new investments (also by existing enterprises) can be subject to corporate income tax rates that are reduced by up to 100% for 10 years. The exact amount of the reduction depends on the size of the investment and on the number of newly created jobs related to the investment: 100% reduction if investment of at least € 3 million and related to 15 new employees; 75% reduction if investment of at least € 1 million and related to 10 new employees; and 50% reduction if investment of less than € 1 million and related to 5 new employees (De-Wit and De-Kok, 2014).
Finland does not provide tax incentives specifically targeted at SMEs. There is a regime of accelerated depreciation for fixed assets being used in production activities (200% of the usual depreciation rate on machinery, equipment and industrial buildings). The regime used to be restricted to SMEs until 2013 but is now available for all enterprises. Moreover, with the super deduction of 100% of salary costs incurred for R&D projects being capped at € 400,000, SME should benefit more than large enterprises. Businesses with less than € 8,500 of turnover are exempt from VAT. If turnover is below € 25,000, only yearly VAT payments need to be made, if it is below € 50,000, only quarterly payments are required (instead of monthly). Moreover, SMEs are subject to reduced documentation requirements with regard to transfer prices (De-Wit and De-Kok, 2014).
Zimbabwe provides investment incentives with six objectives in mind: Employment creation; small business development; industrial development; export promotion; spatial development; and “upliftment” of the disadvantaged. Many of the incentives take the form of financing arrangements, which operate through the Ministry of Industry and International Trade, the Industrial Development Corporation and the Zimbabwe Investment Centre. The most extensive tax incentives accrue to exporters. Under the Export Processing Zone Act of 1995, enterprises in manufacturing, processing or services that are licensed by an Export Processing Zones (EPZ) (Kaplan, 2001). Authority to operate in an EPZ is related to obtaining a 5-year tax holiday, followed by a rate of 15 percent. EPZ companies also receive the standard duty-free access to imports and refunds on sales tax for domestically procured goods and services. In addition, they are exempt from capital gains tax, shareholder’s taxes and non-resident taxes on interest, fees, royalties and remittances. Other exporters outside EPZs qualify for a rebate or drawback of certain duties on imported inputs. Since January 2003, manufacturers that export 50% or more of their volume are taxed at 20%. Finally, exporters can take a double deduction for export marketing costs. Tax holidays apply to other activities as well. Tourism operators in approved tourist development zones benefit from a 5 year holiday, followed by a 15% tax rate. The same provisions apply to industrial park developers. Build-own-operate-transfer projects obtain a 5 year holiday, followed by 15% for 5 years, 20% for 5 years, and then the normal tax rate. In growth point areas, approved manufacturers get a 10% tax rate, while certain infrastructure projects get a 15% rate. Special investment allowances also apply to a limited set of beneficiaries (Kaplan, 2001).
The aim of Tanzania’s tax incentive programs is to attract productive investment, create employment and enhance exports. The Tanzania Investment Act of 1997 provides the basic framework for investment promotion, though associated tax measures are incorporated into the respective tax legislation. The main change in 1997 was to end income tax holidays outside of export processing zones, in favour of expensing of capital assets and remission from customs duty on capital goods for holders of a Certificate of Investment from the Tanzania (Zee et al., 2002).
Tax incentives in Kenya can be grouped into either investment promotion incentives or export promotion incentives. Investment Promotion Incentives include Investment Deduction Allowance which was introduced in 1991 to encourage investment in physical capital such as industrial buildings, machinery and equipment, industrial building allowances which was Introduced in 1974 with the objective of encouraging investment in buildings used for industrial purposes like hotels and manufacturing plants, mining deductions allowance which was introduced to encourage investors to venture into the mining industry which is very capital intensive and farm works deductions which was introduced in 1985 to encourage investment in the agricultural sector. Export promotion incentives program has three main schemes which include the EPZ, Manufacture Under Bond (MUB) and the Tax Remissions and Exemption Office (TREO). The objective of EPZ’s is to generate and encourage economic activity and foreign direct investments while MUB and TREO regimes were meant to encourage investors to manufacture for export within the country (Githaiga, 2013).
The Rwanda fiscal policy provides various tax incentives with the aim of enhancing business and foreign direct investment. The Rwanda investment board provides tax incentives such as accelerated depreciation of 50% for investment in new or used assets, preferential corporate income tax rate of 0 and 15% for the registered investors, tax holidays of seven and five years. In addition to tax incentives provided in the investment, there are number of tax incentives provided in the fiscal tax law. These include loss carried forward for a period of five years, exemption of some income and allowance of some expenses like research and development. All these incentives are aimed at promoting businesses in Rwanda (MINECOFIN, 2012).
SMEs play a very important role in many developing countries. Young (2009) observes that especially in the developing countries the health of the economy as a whole has a strong relationship with the health and nature of SMEs. In Rwanda for example, the SMEs contribute more than 60% of new jobs created. Due to the importance of SMEs to the Rwandan economy, the Government of Rwanda has made notable intervention by putting in place measures like the Umurenge SACCOs that are geared towards promotion of and development of SMEs (MINICOM, 2016).
The study by MINICOM, NISR, MIFOTRI, and PSF indicated that 99.9% of the population are employed by small and medium enterprises and only 0.1% by large enterprises. This implies that a large number of work force is employed by SMEs. Despite their significance and the financial support given to them, the SMEs are faced with the threat of failure with the past statistics indicating that three out of five fail within the first few months of operation. According to MINCOM et al. (2017), only a fraction of the establishment started in 2010-17 remained in operation. The effect of SMEs discontinuation is very dangerous and devastating as it leads to loss of jobs and assets as well as the GDP.
However, despite of the importance of sustainability and continuity of SMEs, studies solely focusing on whether tax incentives affect the growth of SMEs in developing countries particularly Rwanda seem to be very limited and scarce. It is within this context, that researchers want to investigate the effect of tax incentives on the growth of SMEs in Rwanda.
The study answered the following two questions:
(1) Does the tax laws in Rwanda provide tax incentives in the support of SME growth
(2) There is a significant effect between tax incentives and SME growth.
THEORETICAL AND CONCEPTUAL FRAMEWORK
Neo-classical theory
Neo-classical economic theory argues that providing tax incentives to one group of investors rather than another violates one of the principal tenets of a good tax system, that of horizontal equity. This inequality distorts the price signals faced by potential investors and leads to an inefficient allocation of capital (Comanor, 1967). The justification most often given for special incentives is that there are market failures surrounding the decision to invest in certain sectors and locations, which justify government intervention.
Market failures result in either too much or too little investment in certain sectors or locations. The key market failure most often cited is positive externalities not internalized in the project’s rate of return that are higher in certain sectors than in others. An example is research and development where investment yields a higher social than private rate of return because not all the technological knowledge can be effectively patented and as such there exists an exalted justification for subsidizing research and development investment (Kaplan, 2001).
Colmar (2005) points out that there are other purported benefits of tax incentives, such as symbolic signalling effects and the need to compensate for inadequacies in the investment regime elsewhere. Provision of investment incentives is in the form of either tax relief or cash grants. International experience shows that such incentives play only a minor role in investment decisions. Firms make investment decisions based on many factors including projections of future demand, certainty about future government policy, prevailing interest rates and moves by competitors. In general, neo-classics see incentives as ‘nice to have’ but not deal-breaking. Yet incentives remain a popular policy for both developed and developing countries.
Agency theory of tax incentives
According to Zee et al. (2002), despite the lack of evidence to support the efficacy or efficiency of fiscal incentives, governments continue to offer them. Tax incentives offer an easy way to compensate for other government-created obstacles in the business environment. In other words, fiscal incentives respond to government failure as much as market failure. It is far harder, and takes far longer, to tackle the investment impediments themselves like low skills base, regulatory and compliance cost than to put in place a grant or tax regime to help counterbalance these impediments. Although it is a second-best solution to provide a subsidy to counteract an existing distortion, this is what often happens in practice.
Agency problems also exist between government agencies responsible for attracting investment and those responsible for the more generic business environment. Whilst investment-promotion agencies can play an important role in coordinating government activities to attract investment, they also often argue for incentives without taking account of the costs borne by the economy as a whole (Zee et al., 2002).
Tax incentives theory
UNCTAD (2003) defines tax incentives as instruments that reduce the tax burden of any party in order to induce them to invest in particular projects or sectors. They are exceptions to the general tax regime and may include, reduced tax rates on profits, tax holidays, accounting rules that allow accelerated depreciation and loss carry forwards for tax purposes, and reduced tariffs on imported equipment, components, and raw materials, or increased tariffs to protect the domestic market. The Kenya Revenue Authority (KRA) defines tax incentive as a provision that grants any person or activity favourable conditions that deviate from the normal provisions of the tax legislation. Tax expenditures refer to revenue losses that a government incurs by providing tax exemptions, deductions or allowances, tax credits, preferential tax rates or deferral of tax payments legally to any party in the economy (Gravelle, 2013).
The budget deficit of a government is a form of a negative saving and a reduction in the deficit can positively influence the net national savings more than any feasible changes in tax policies and encourage savings within an economy which will then stimulate investments (Goolsbee, 2004). Keen (2013) defines tax incentives as all measures and strategies which provide for more favourable tax treatment to a certain activities or sector, and he went on to describe the following to be typical tax incentives:
(1) Tax holidays: is defined as the temporal exemption of business investment from certain specified taxes, typically at least corporate income tax. Partial tax holidays offer the reduced obligations rather than full exemption.
(2) Special zones: are placed in geographically limited areas where qualified companies can locate and hence benefit from the exemption of various scopes of taxes or administrative requirements.
(3) Investment tax credit: this is the deduction of some fraction of an investment from the tax liability
(4) Investments allowance/Accelerated depreciation: is the deduction of some fraction of an investment from taxable profits (in addition to depreciation).
(5) Reduced tax rates/Preferential tax rates: are the reductions in a tax rate, specifically the corporate income tax rate.
(6) Exemptions from various taxes: are the exemptions from certain taxes, most of the time those collected at the border such as tariffs, excises and VAT on imported inputs.
(7) Financing incentives: are the reductions in tax rates for the funds’ providers for example: the reduced withholding taxes on dividends.
(8) Loss carried forward: when the business makes a loss, the loss can be carried forward to offset the future profits of the business.
Growth of SMEs
Countries that have tax incentives for SMEs claim that preferential tax treatment creates a large number of jobs and enhances the level of entrepreneurship that is associated with flexibility, speed, risk taking and innovation (Chen et al., 2002). Berger and Udell (1998) emphasize the fact that SMEs are key drivers of economic success, because they are job creators, sales generators and the source of tax revenue. These authors base their assertion on the facts that a large percentage of SMEs contribute to the various countries’ gross domestic product, they employ a large percentage of the workforce and the high ratios of small businesses to large businesses in the countries concerned.
According to Berger and Udell (1998), SMEs represent fertile ground for the development of large, profitable, tax-paying employers and SMEs experience high growth rates in comparison to large enterprises. However, tax policies that are aimed at promoting the economic growth of small businesses should be evaluated judiciously, because the inherent characteristics of small businesses can make a specific differentiated tax policy undesirable. Studies undertaken in this regard have produced the following findings: the majority of SMEs have limited growth potential small businesses vary in terms of productivity, job growth, wages, innovation and export performance within the same industry subgroups. Small business also do not all follow the same growth pattern. Certain small businesses will remain small for most of their existence and it is for this reason that it is not obvious why a tax system should influence the growth process. Such intervention, to the extent that it does not act in a lump-sum way, influences marginal decisions and could lead to excessive risk taking and over investment (Heshmati, 2001).
Business environment in Rwanda
The World Bank Doing Business Report (2013) ranked Rwanda 32nd out of 189 countries, which is a significant jump up by 22 positions from the previous year. It excels in registering property and starting a business by entering the top 10 worldwide. In Rwanda, it takes only 12 days to register property and two days to start a business, which are far less than the regional averages and even the averages of OECD countries.
Several reforms have contributed to improving the business environment. For example, in the recent years, Rwanda reduced the time required to obtain a registration certificate for starting a business. It also eased transferring property by eliminating the requirement for a tax clearance certificate and by implementing the web-based Land Administration Information System for processing land transactions. Privatization of state-owned enterprises and reformation to pro-investment policy has actively taken place to attract foreign direct investment (FDI). However, despite no limits on foreign investment, participation, or control of enterprises, FDI levels are still low.
Businesses in Rwanda are categorised into four depending on the levels of sales. If the annual turnover ranges from Frw 2,000,000 to 12,000,000 the business is classified as a micro. From the annual turnover of 12,000,001 to 20,000,000 it is classified as a small business and from Frw 20,000,001 to 200, 000,000 it is a medium business and Frw 200,000,000 is classified under large business. The micro and small business are taxed under a lump sum tax regime whereas the medium and the large businesses are under a real tax regime.
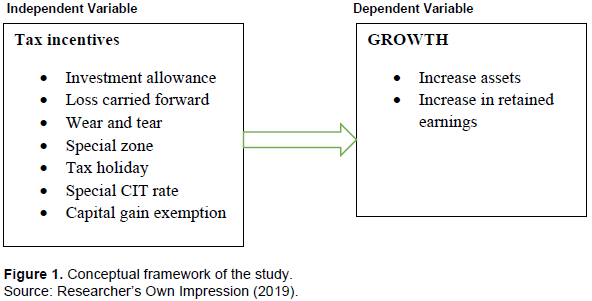
The authors of this paper have developed a conceptual framework which represents the synthesis of literature on how to explain a phenomenon. It illustrates actions required in the course of the study given his previous knowledge of other researchers’ point of view and his observations on the subject of research. It shows the relationship between variables. It is composed as follows (Figure 1).
As illustrated in the Figure 1, the independent variables, that is, those which are believed to play a role in the growth of SME as measured by increase in the assets, retained earnings and sustainable growth rate are: investment allowance, loss carried forward and wear and tear. However, for the relationship to hold, government policy and economic conditions must be put into consideration. Therefore, they are here defined as intermediate variables.
The research methodology adopted in the study is discussed here. It shows the description of the research methods and instruments that was employed in the study. It covers the research design, survey population, sample size, sampling procedures, sources of data, data collection instruments, validity and reliability of the research instrument, measure of research variables, and measure of research instruments. It also shows how the research was processed, analysed and presented.
Research design
The study design was based on a multi-method strategy which used both qualitative and quantitative research approaches. A case study and a survey strategy were used in this study. This helped the researcher to have a triangulation of different strategies. According to Bell (1993), a multi-method strategy occurs when more than one research approach and data source are used in a study of social phenomena. A multi-method approach can be undertaken within a single research strategy by using multiple sources of data or across research strategies (Bell, 1993). The combination of qualitative and quantitative design approach has been recommended and used by researchers in situations where one of the approaches is insufficient to reveal all that is required to be known about a phenomenon (Bell, 1993).
Study population
A study population is a group of element/items/or people in which the study interested. The study population of this study was 49000 SMEs in Nyarugenge district registered with the RRA. However, the study targeted the managers/owners and the accountant/director of finance of each SME.
Sample size and sampling procedure
In selecting a sample an optimum sample size was considered. According to Kothari (2000), an optimum sample is the one which fulfils the requirement of efficiency, representativeness, reliability and flexibility. To determine the sample size, the researchers used the Solvin and Yamen’s formula (n = N/(1 + N(e)2 where 136 SMEs were determined.
Source of data and research instruments
Both primary and secondary data were used in this study. The primary data were sourced by using a questionnaire and documentary techniques were utilized to collect secondary data. The questionnaires were closed ended and self-administered. The closed ended questionnaires have been recommended in social science research due to its advantages over open ended questionnaires (Sekaran and Bougie, 2016).
Data processing and analysis
Data were first collected from the primary survey and then a secondary survey was compiled, sorted, edited, coded in order to have the required quality accuracy and was analysed statistically using the statistical package for social scientist (SPSS). Principal component analysis approach and varimax rotation methods were used to determine those factors that explain tax incentives. The result of the analysis was presented in form of tables for the interpretation. Pearson’s correlation was used to establish the relationship between tax incentives and growth of SMEs. A multiple regression analysis was used to examine the model on tax incentives and growth of SMEs. T-test was used to examine the variability of each variable of tax incentive. The model equations are:
Growth (G) = F (tax incentives (TI))
G = β0 + β1TI + α (1)
where TI = F(accelerated depreciation (AD), loss carried forward (LC), wear and tear (WT), Special zone (SZ), tax holiday (TH), special CIT rate (ST), capital gain exemption (CE)).
Capital gain exemption:
TI = β0 + β1AD + β2LC + β4WT + β5SZ + β6TH + β7ST +β8CE +α
Substituting in the first equation gives:
G = β0 + β1AD + β2LC + β4WT + β5SZ + β6TH + β7ST +β8CE +α
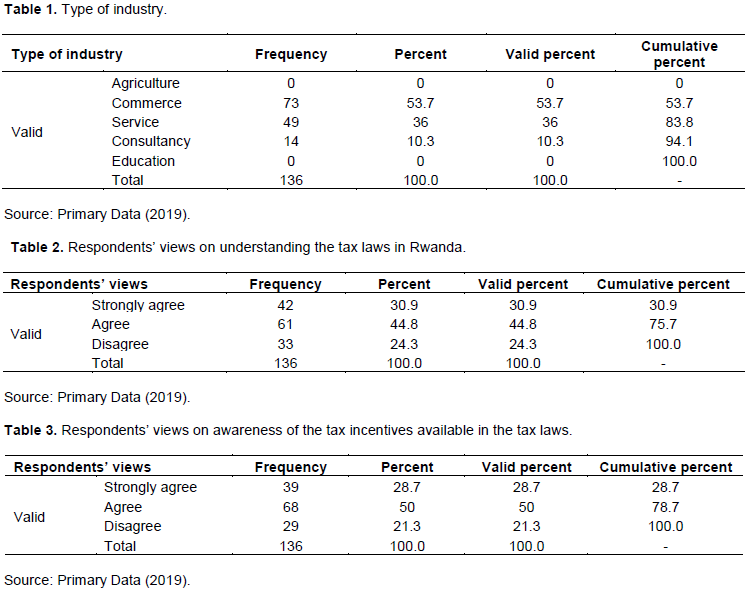
Table 1 shows the type of industry of the responding SMEs, where respondents in the sector of agriculture constitute 0%, commerce constitutes 47.8%, service constitutes 36%, consultancy constitutes 10.3%, and education constitutes 0%. As seen, the majority of respondents are involved in commerce sector.
Table 2 shows the result of the enquiry on the understandability of the tax laws in Rwanda, where 30.9% of the respondents said that they strongly agree, 44.8% agreed and 24.3% disagreed when asked if they understand the tax laws in Rwanda. The results from the survey revealed that the majority of the respondents understand the tax laws as evidenced by 75.7% of the answers. The result from the survey conforms to the findings from the study carried out by Vann and Holland (1998). These findings show that taxation means in other words the contribution imposed by the government to its people or to an individual or to companies for the use of services or facilities provided by the government (Vann and Holland, 1998).
Table 3 shows what came out when respondents were asked whether there are aware of the tax incentives that are available in the tax laws. The results from the survey indicated that 28.7% of the respondents strongly agreed, 50% agreed and 21.3% disagreed. So, a large number of respondents are aware of the tax incentives available in the tax laws. The results from the survey relates to the findings from the study carried out by Keen (2013). According to Keen (2013), tax incentives are seen as measures and strategies which provide for more favourable tax treatment to a certain activities or sector.

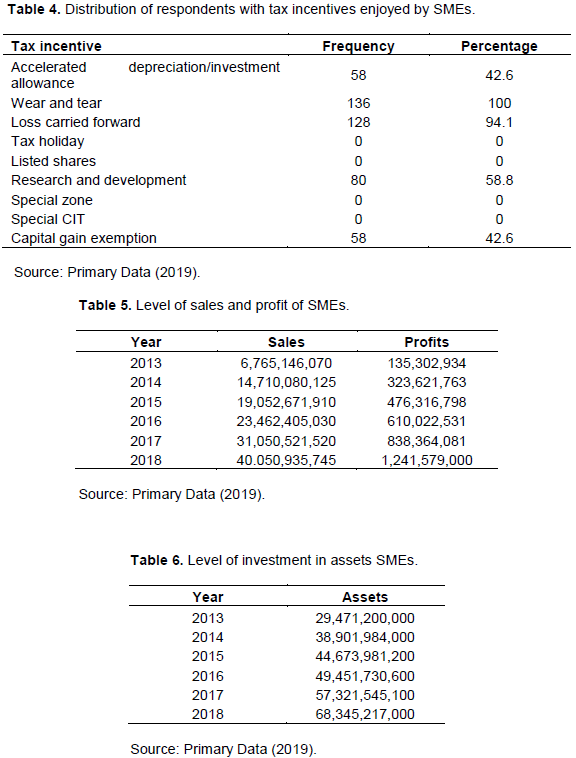
Table 4 shows the tax incentives enjoyed by SMEs in Rwanda, where 42.6% of respondents mentioned that they accelerated depreciation; 100% of respondents mentioned wear and tear; 94.1% of respondents mentioned loss carried forward; none of the respondents mentioned tax holiday, special CIT and special zones and listed shares as a tax incentive; 58.8% of respondents mentioned research and development and capital gain exemptions. The results from the survey revealed that various tax incentives are enjoyed by SMEs. However, the most ones include wear and tear loss carried forward and accelerated depreciation as evidenced in the Table 4. The results relate to the findings of the study carried out by UNCTAD (2003). The UNCTAD study revealed that there are various tax incentives that are available in the tax laws that support SMEs. The study defines tax incentives as any incentives that reduce the tax burden of any party in order to induce them to invest in particular projects or sectors. They are exceptions to the general tax regime and may include reduced tax rates on profits, tax holidays, accounting rules that allow accelerated depreciation and loss carry forwards for tax purposes, and reduced tariffs on imported equipment, components, and raw materials, or increased tariffs to protect the domestic market.
Table 5 shows the level of sales and profit of SMEs from 2013 up to 2018, where the sales and profit had been increasing year to year. Based on these results from their financial statements the financial performance of the SMEs is good. As profitability is a measure of the amount by which a company's revenues exceeds its relevant expenses, the results reveal that an increase in the sales has raised profitability of the SMEs during the study period. This means that tax incentives have an effect on the sales and profitability of SMEs. The findings relates to the study carried out by Külter and DemirgüneÅŸ (2007) who point out that revenue and profitability of SMES are affected by tax incentives.
Table 6 shows the level of investment in assets SMEs from 2013 up to 2018. As shown, the level of investment in asset SMEs was increasing, which indicates that the performance of the SMEs is good. The findings conform to findings from previous studies, e.g. by Goolsbee (2004), that assets are probable future economic benefits obtained or controlled by particular entity as a result of past transactions or events.
Relationship between tax incentives and growth of SMEs in Rwanda
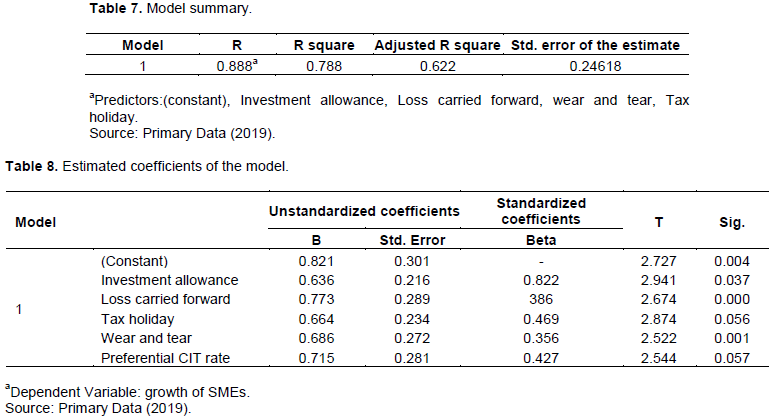
Considering the effect of tax incentives on the growth of SMEs in Rwanda, the research established the statistical relationship between tax incentives and promotion of SMEs in Rwanda. The relationship was established through Pearson correlation analysis using Pearson Moment correlation coefficient as depicted in Table 7.
Table 7 provides both the coefficient of determination which is Adjusted R Square and the coefficient of correlation which is R. The coefficient of determination (R2=0.788) explains the explanatory power of the model and indicates that 78.8% of the variation in the growth of SMEs is explained by the variation in the explanatory variables of investment allowance, loss carried forward, listing shares, and tax holiday. However, the adjusted R square of 62.2% indicates that there are other variables that affect the growth of SMEs such as government policy, economic conditions which are not captured by the model formulated in the study that account for about 37.8% variation not explained by the model. The coefficient of correlation (R=0.888) is greater than 0.5. This indicates that there is a strong positive and moderate relationship between tax incentives and growth of SMEs. The result from survey relates to findings from previous studies. Colmar (2005) identified a strong relationship between tax incentives and growth of SMEs. Similar findings are also seen in the study carried out by Chukwumerije and Akinyomi (2011).
Table 8 shows the estimated coefficients of the regression model of this study. From the findings, all the coefficients are statistically significant considering the positive value of the coefficients and a significance level great than 0.05. Specifically, there is a correlation between investment allowance and growth of SMEs (b=0.636, sig=0.037) indicating that the investment allowance itself explains 63.6% of the variation in the effectiveness of the growth of SMEs. Moreover, there is a significant and strong positive relationship between loss carried forward and evaluations with growth of SMEs (b=0.773, sig=0.000) indicating that the 77.3% of the variation in the growth of SMEs is explained by loss carried forward. Tax holiday has a significant and positive relationship with the growth of SMEs (b=0.664, sig=0.056) indicating that 66.4% of the variation in the growth of SMEs is explained by tax holiday. Wear and tear has a significant and positive relationship with the growth of SMEs (b=0.686, sig=0.001) indicating that 68.6% of the variation in the growth of SMEs is explained by listing shares. Preferential CIT Rate has a significant and positive relationship with the growth of SMEs (b=0.715, sig=0.057) indicating that 71.5% of the variation in the growth of SMEs is explained by Preferential CIT Rate. The results from the survey relates to the findings of the study carried out by Chukwumerije and Akinyomi (2011) which revealed a significant effect of investment allowances, loss carried forward, tax holiday, listing shares and preferential tax rate.

This research work clearly confirms that tax incentives are germane to the growth, development and continued sustenance of small and medium enterprises. However, most of the tax incentives that are available in the tax law are not enjoyed by SMEs. It is only the large taxpayers that enjoy most of the tax incentives. Tax incentives play a vital role in ensuring that small and medium enterprises thrive because the government has made available tax holidays for pioneer companies, and the government also grants a number of general and industry specific incentives. Finally, for many SMEs, the decision to remain informal is deliberate because of the cost and procedural burden of joining the formal sector out weight the benefit of staying in the informal sector. Informal sectors make large contributions to nation economies, in both human and financial terms. But being visible to government agencies and formal sector companies, they can be easily reached with capacity building improvement schemes. However, they cannot compete for business with larger companies and thus there is a need for governments to accelerate their growth by creating an enabling environment for them via appropriate tax incentives to enhance their sustenance and growth.
On the basis of the findings in this research work the recommendations are as follows:
(1) Government can address the direct need for start-up fund for SMES by providing incentives for SMEs funding.
(2) People should enlighten themselves appropriately on the form of business they want to embark upon by going for entrepreneurial training programs to make them better equipped before venturing into it.
(3) There is a need for the government to employ tax holiday as a major tax incentive for newly established small and medium enterprises because it stimulates their investing power thereby exempting them from other tax liabilities.
(4) Government should promote the growth of small and medium enterprises by creating the necessary enabling frameworks and relax the burden of regulating measures and ensure that their efforts are geared towards granting tax incentives to micro, small and medium enterprises.
(5) Building SMEs capacity through the localization of supply chains requires the leadership from the top. Localizing values creation through engagement with SMEs is a key achievement that large corporations can contribute, and this would bolster their license to operate by creating a positive local impact, considering partnership across segments, sharing business planning skills, etc
(6) Small and medium enterprise should emphasize on tax incentives, so that their operations continue to be more efficient and effective.
(7) Government should make campaigns to explain the role of taxation on development of countries and help small and medium enterprises to understand tax law in Rwanda.
Putting all these measures p in place will go a long way, but it will ensure that tax incentives granted to SMEs have a significant impact on their growth.
The authors have not declared any conflict of interests.
REFERENCES
|
Bell J (1993). How to complete your research project successfully. New Delhi: UBSPD.
|
|
|
|
Berger AN, Udell GF (1998). The economics of small business finance: The roles of private equity and debt markets in the financial growth cycle. Journal of Banking and Finance 22(6-8):613-673.
Crossref
|
|
|
|
|
Broersma L, Gautier P (1997). Job creation and job destruction by small firms: An empirical investigation for the Dutch manufacturing sector. Small Business Economics 9(3):211-224.
Crossref
|
|
|
|
|
Chen D, Lee FC, Mintz J (2002). Taxation, SMEs and entrepreneurship. Available at:
View
|
|
|
|
|
Chukwumerije T, Akinyomi O (2011). The impact of tax incentives on the performance of small-scale enterprises. Published Thesis, Redeemer's University, Ogun State, Nigeria.
|
|
|
|
|
Colmar B (2005). Measuring the tax compliance costs of small and medium sized businesses. Available at:
View
|
|
|
|
|
Comanor WS (1967). Market structure, product differentiation, and industrial research. The Quarterly Journal of Economics 81(4):639-657.
Crossref
|
|
|
|
|
De Wit G, De Kok J (2014). Do small businesses create more jobs? New evidence for Europe. Small Business Economics 42(2):283-295.
Crossref
|
|
|
|
|
De-Wit G, De-Kok J (2014). Do small businesses create more jobs? New evidence for Europe. Small Business Economics 42(2):283-295.
Crossref
|
|
|
|
|
Githaiga I (2013). The impact of tax incentives on foreign direct investments inflows of firms listed at the Nairobi Securities Exchange (Unpublished MBA Project). University of Nairobi, Kenya.
|
|
|
|
|
Goolsbee A (2004). The impact of the corporate income tax: evidence from state organizational form data. Journal of Public Economics 88(11):2283-2299.
Crossref
|
|
|
|
|
Gravelle J (2013). Corporate tax incidence: review of general equilibrium estimates and analysis. National Tax Journal 66(1):185-214. Available at:
View
Crossref
|
|
|
|
|
Hansson A, Brokelind C (2014). Tax Incentives, Tax Expenditures Theories in R&D: The Case of Sweden. World Tax Journal 6(2):168-
|
|
|
|
|
200.
|
|
|
|
|
Heshmati A (2001). On the growth of micro and small firms: evidence from Sweden. Small Business Economics 17(3):213-228.
Crossref
|
|
|
|
|
Kaplan D (2001). Rethinking Government Support for Business Sector R&D in South Africa: the case for tax incentives. South African Journal of Economics 69(1):72-92.
Crossref
|
|
|
|
|
Keen M (2013). Taxation and development: Critical issues in taxation and development. Cambridge: MIT Press.
|
|
|
|
|
Kothari CR (2000). Research methodology: methods and techniques (2nd Ed.) New Delhi: Pearson Education Ltd.
|
|
|
|
|
Külter B, DemirgüneÅŸ K (2007). Determinants of profitability in retailing firms: An empirical study on ISE listed retailing firms. Journal of Çukurova University and Institutions of Social Sciences 2(34):445-460.
|
|
|
|
|
MINICOM. (2016). Rwanda: MINICOM to Set Up SMEs Website. Available at:
View
|
|
|
|
|
Ministry of Finance and Economic Planning (MINECOFIN) (2012). The Rwanda investment board provides tax incentives. Kigali: MINECOFIN. Available at: View
|
|
|
|
|
Mintz J, Chen D (2011). Small Business Taxation: Revamping Incentives to Encourage Growth. SPP Research Paper 1-31.
Crossref
|
|
|
|
|
Sekaran U, Bougie R (2016). Research methods for business: A skill building approach. John Wiley & Sons.
|
|
|
|
|
UNCTAD (2003). The financial grants to encourage investment and employment in non-traditional sectors. New York: UNCATAD.
|
|
|
|
|
Vann RJ, Holland D (1998). Income tax incentives for investment. Tax Law Design and M Drafting 2(1):986-1020.
|
|
|
|
|
Young JF (2009). Decision-making for small business management (4th Ed.). Florida: Krieger Publishing Company
|
|
|
|
|
Zee HH, Stotsky JG, Ley E (2002). Tax incentives for business investment: A primer for policy makers in developing countries. World Development 30(9):1497-1516.
Crossref
|
|