ABSTRACT
This paper explores the prediction of bankruptcy of Greek retail and wholesale trade companies and, in particular, the relation between the forecasting ability of the Logit model and the degree of homogeneity of the samples of bankrupt and healthy companies. A sample of 119 bankrupt companies was matched with an equal sample of healthy companies for the period 2003-2014, based on year, sector, and sub-sector, which was formed by random selection. Using the method of factor analysis, seven financial ratios were selected, which are the independent variables of the model. Applying the Logit model, the results showed a significant explanatory capability of the model in the trade sector as a whole as well as in the wholesale trade sub-sectors, which increases as the homogeneity of samples of bankrupt and healthy companies increases.In particular, the predictive capability of the model that we used improved by 14.3% regarding the classification of bankrupt firms when the same methodology was applied from the broader sector to the sub-sector. Moreover, the independent variable of capital structure has the highest stability and contributes substantially to the discriminant validity of the Logit model.
Key words: Bankruptcy, corporate bankruptcy, sectoral forecasting models, financial and accounting ratios.
The limited investigation of the effects of industry features on the prediction of firm bankruptcy may often lead forecast models to unreliable results. Applying a prediction model to firms of one sector may lead to misleading results if the same model is applied to firms of a different sector (Hossari, 2009). The sector of the enterprise activity plays an important role in its course (Stokes and Blackbum, 2002; Thornhill and Amit, 2003), and sometimes the negative impact of a sector may also be the cause of firms’ bankruptcy (Lang and Stulz, 1992).
When a sector or subsector of economic activity is experiencing severe financial problems, this will also affect the function of the firms that belong to it and it is possible that some of them may be bankrupt. Each sector and subsector of economic activity has particular accounting and financial characteristics and the problems it faces may be due either to internal or to external factors.
Ooghe and Waeyaert (2004) report that the sector determines many of the firm's characteristics, which are
often the cause of bankruptcy. However, Ross et al (2018) state within-industry accounting similarity varies across industries. For this reason they develop a new measure of firm-group accounting similarity which captures co-movement in accounting fundamentals over time.
Firms belonging to different sectors may differ in performance, financial results, or composition of liabilities and assets because different activities are causing special requirements (Camska, 2016). A vast amount of studies in corporate finance provide evidence of the importance of peers influence in a number of corporate policies including those that determine capital structure (Leary and Roberts, 2014) and cash holdings (Chen and Chang, 2013), dividend policy (Popadak, 2012) and investment policies (Foucault and Fresard, 2013), among others.
One of the most important elements of a successful bankruptcy forecast is the selection of appropriate samples of bankrupt (failed) firms, which should be homogeneous and aggregate qualitative and quantitative features of the financial information of the financial statements. Indeed, samples of firms which are active in the same sector or subsector of economic activity show a greater degree of homogeneity.
The degree of homogeneity of samples depends on many factors and in particular accounting and financial characteristics, such as the type of inventories, their sensitivity and obsolescence, the level of competition, the different accounting methods (Chava and Jarrow, 2004), the credit policy followed, financing factors, allocation of working capital components, the legislative framework, the import or export-orientation of the firm, the size of the firm, etc.
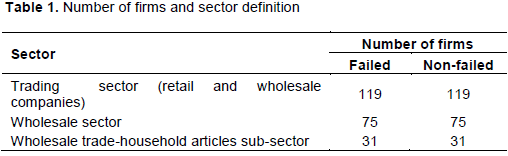
For these reasons, in the last decade, in particular, surveys of business failure forecast have focused on sector-specific samples. However, to the best of our knowledge, there is no relevant empirical study demonstrating an improvement of prediction models as the sample used is specified, becoming more and more homogeneous. This study contributes to the literature in several important ways. First, it provides unique empirical evidence, as the increasing homogeneity of firm samples (as is the case in sector and sub-sector samples) leads to a better forecasting ability of the models.It also highlights the differences between the effect of the same financial ratios of firms belonging to different sectors and sub-sectors of economic activity on bankruptcy prediction. For our study, a sample of 119 Greek trading firms that went bankrupt during the period 2003-2016 was used; 75 of them belong to the wholesale trade sector (including companies belonging to the subsectors of food, paper, household, furniture, etc.). In addition, a sample comprising 31 firms belonging to the sub-sector "Wholesale of household articles" was created. We chose this sub-sector for our analysis because of the greater availability of observations. This sub-sector represents the largest number of companies and observations in our sample compared to the other sub-sectors of the wholesale trade, in which there were available data for no more than 20 companies –something that is not considered an appropriate size for our study.
The time period we chose for our analysis (2003-2016) includes two significant sub-periods: 2003-2008 and 2008 to 2014, which mark the period before the crisis and during the crisis period, respectively. Although the economic crisis in Greece has had many consequences on firms’ characteristics and policy, we assumed that it does not affect the analysis of our research question,which is related to forecasting ability and the degree of sample homogeneity.
The Logit model was developed in this paper and an attempt was made to highlight differences in the forecasting ability of the model among the three different samples of firms.The selection of the appropriate variables was implemented by applying the factor analysis technique.
Our decision to focus on Greek businesses is based on the fact that similar research on non-listed and mostly family-type enterprises, as is the case with most Greek businesses, is absent from the international literature.
According to our research results, the predictive capability of the model we used improved by 14.3% regarding the classification of bankrupt firms when the same methodology was applied from the broader sector to the sub-sector (in other words, the homogeneity of the sample increased). The corresponding improvement was in the range of 20% for healthy businesses. This paper will make a significant contribution to better investigating and identifying the causes of corporate financial failure and the results will contribute to strengthening future scientific research on business failure prediction. The analysis we present can also be applied in future research to assess the effect of sample homogeneity on other sectors such as the manufacturing industry.Finally, this study provides some important approachesto failure prediction that should be helpful to policymakers, investors, banks, regulators,and financial analysts with regard to the forecasting and preventing of economic distress.
In recent decades, the development and implementation of failure and bankruptcy prediction models has been of particular interest to researchers and scholars. Beaver (1966) with the univariate analysis, Altman (1968) with multivariate discriminant analysis, Meyer and Pifer (1970) with the linear probability model, Martin (1977) and Ohlson (1980) with the development of the logarithmic probability model (Logit), and Hanweck (1977), Grablowsky and Talley (1981), and Zmijewski (1984), with the development of the normal probability model (Probit), laid the groundwork for later research in the field of business failure prediction.
Significant researches referring to failure and bankruptcy prediction were based on the previous techniques, such as:Deakin (1972), Edmister (1972), Blum (1974), Diamond (1976), Taffler and Tisshaw (1977); Altman, Haldeman and Narayanan (1977), Dambolena and Khoury (1980), Taffler (1982), Gombola and Ketz (1983), Micha (1984), Zavgren (1985), Frydman et al. (1985), Gombola et al. (1987), Aziz et al. (1988), Peel and Peel (1988), Keasey and McGuinness (1990), Platt and Platt (1990), Luoma and Laitinen (1991), Theodossiou (1993), Johnsen and Melicher (1994), Altman et al. (1995), McGurr and DeVaney (1998), Dimitras et al. (1999), Kahya and Theodossiou (1999), Charitou et al. (2004), Agarwal and Taffler (2008) and Wu et al. (2010).
Many researchers have dealt with the comparison of the predictive capability between different methods. The results that have been presented are mixed. For instance, Kim (2011), using the techniques of Neural Networks (NN) and Support Vector Machines (SVM), compared their effectiveness with Multivariate Discriminant Analysis (MDA) and Logit analysis (Logit) and explored their application using a sample of 33 bankrupt and an equal sample of non-bankrupt hotel companies in Korea. The results showed the superiority of the Logit model among statistical techniques and the more effective forecasting ability of support vector machines among artificial intelligence models. McGurr (1996) investigated the predictive capability of the discriminant analysis model in United States retailers. In the confirmation sample that he used, the overall predictive precision of the model ranged from 69.7 -75.26%. McGurr and DeVaney (1998) compared the technique of discriminant analysis (MDA) with the logarithmic probability model (Logit), using US retailers from 1989 to 1993. The sample consisted of 56 bankrupt companies which were matched to 56 healthy firms; the results showed an overall predictive precision of 74.1% for the multivariate discriminant analysis model and of 67.2% for the logarithmic probability model.
Kosmidis et al. (2011) compared in their study the Logarithmic Probability Model with the Multivariate Discriminant Analysis model. They conclude that the Logit model proved to be more effective, presenting a bankruptcy predictive capability of 79.6%, compared to the Multivariate Discriminant Analysis model, whose respective forecasting ability was 77.8%.
The variables used in the models of these studies were mainly derived from the published financial statements of the companies. However, in the last decade efforts have been made to introduce other variables, too, related to corporate governance or market risk, or having macroeconomic features. For example, Liang et al. (2016) evaluate financial ratios and corporate governance indicators in bankruptcy prediction. In order to minimize any bias effect stemming from the sampling process which may affect the model performance, they used the 10-fold cross validation method to divide the dataset into 10 subsets with which to test the prediction model. The final prediction performance is based on the average of the 10 testing results over the 10 testing subsets individually. They found that the financial ratio categories of solvency and profitability and the corporate governance indicators categories of board structure and ownership structure are the most important features in bankruptcy prediction.
Charalambakis (2013) uses a discrete Hazard model to evaluate the contribution of accounting and market-driven variables to the prediction of corporate failure in Greece. He concludes that a model that combines a set of variables such as sales to total assets, profitability and financial risk with market capitalization, excess returns and stock return volatility strengthens the prediction of financial distress.
Richardson et al (2015) examined in their study the impact of economic distress on tax avoidance in a sample of 203 manufacturing companies listed on the Australian stock exchange. They show that firms under financial distress increase their level of tax avoidance. Moreover, they state that the weakened financial position of firms may lead them to engage in income-increasing earnings management in order to conceal their waning position.
Skogsvik (1990) investigated the forecasting ability of the current cost accounting ratios in comparison to the forecasting ability of historical cost accounting ratios to predict business failure for a sample of Swedish industrial companies. Using probit analysis he found that the predictive performance of the current cost accounting ratios is very similar to the predictive performance of the historical cost accounting ratios.
Charalambakis and Garrett (2016) investigate whether accounting and market-driven variables predict financial distress well for a developed market of firms (USA), while they also predict financial distress in another developed market (UK) and in an emerging market (India). They showed that for the UK, a model that combines book leverage and excess returns, market capitalization and return volatility amplifies the prediction of financial distress for UK firms. For the case of Indian firms they found that market-based variables do not impact the probability of financial distress when they are combined with accounting information.
Standard and Poor corporation (1982) has highlighted significant differences between the same financial indicators of enterprises belonging to different sectors, because there is a difference between the characteristics of the sectors, such as the nature of inventories, the credit policy followed, the capital structure and the structure of assets.
A huge part of the published research on business failure and bankruptcy prediction refers to samples of bankrupt manufacturing firms, samples of manufacturing and trading firms as a whole, and samples comprising companies in different sectors. In this direction, in order to highlight the effect of the particular characteristics of the sectors of the economy, and thus the degree of homogeneity of the samples, the predictive capability of the models became the focus of important research activity. Altman et al (1974) applied multivariate discriminant analysis (MDA) in a sample of 35 problematic and 99 healthy textile companies in France, with fairly good results, highlighting the importance of sector specific characteristics. Also, in 1993, recognizing the diversity of industry characteristics, he revised his model (Z-Score, 1968) to a model of four variables, removing the ‘asset turnover ratio’ variable, “X5 Sales to Total assets", in order to minimize the potential industry effects. Pozzoli and Paolone (2016) investigated the effectiveness of the revised Altman (Z-Score) 1983 model in a sample of Italian companies of the manufacturing industry that went bankrupt in the first quarter of 2016. In their study, the samples that are used do not allow for investigation of the effects of industry or country on the risk of failure. The authors conclude that a larger sample across different sectors and countries would treat this weakness.
Parsa et al. (2011) state that the variables location, affiliation, and size have a significant impact on restaurant failure. Pinkwart et al. (2015) analyzed the determinants for the business failure of German New Technology-Based Firms (NTBF) in different financial stages. They showed that the different financial states should be analyzed separately when determining factors of business failure.
Gemara et al. (2016) use survival analysis techniques in the Spanish hotel industry. They argue that the survival of hotels depends on their size, location, management and launch in a time of prosperity. Soo (2018) investigates the key determinants of US hospitality firms’ financial distress between 1988 and 2010 using ensemble models. Financial ratios such as debt-to-equity ratio and net profit margin, among others, were defined as significant financial distress predictors.
Michalopoulos et al. (1993) applied the Regressive Differentiation Algorithm to a sample of twenty-one Greek textile companies (9 bankrupt and 12 healthy). The financial ratios they used in the model were equity to total assets, return on equity, current assets less inventories to total assets, earnings before interest and taxes to total assets, current ratio and debt to total assets. The classification accuracy was 83.8% for the first year before bankruptcy, 76.4% for the second year, and 87.5% for the third year before bankruptcy.
In selecting the most appropriate variables from those available, some researchers have applied the method of factor analysis. For instance, using factor analysis, Situm (2015) concludes that retained earnings to total assets ratio are not a significant variable in insolvency prediction. He also argues that correlation and factor analysis should be applied separately for each group of firms (solvent and insolvent) for better pattern detection.
Therefore, first of all, according to the above, it is clear that, internationally, research directed towards forecasting business failure is now focused on specific sectors of the economy. However, it has not been empirically investigated how to improve model prediction as the degree of homogeneity of the samples increases. It also appears that the variables used in almost all models are those associated with leverage, profit ability and liquidity.
Data description
The data of the bankrupt Greek trading firms were compiled by the Hellenic Statistical Authority (ELSTAT) and include businesses across the whole country that have undergone audits and verifications, while the search for financial datafrom the financial statements was carried out by ICAP GROUP SA.
The data and features of the final sample of the bankrupt companies are as follows (Table 1):
1. The number of trading companies in the sample amounted to 119 and refers to companies that went bankrupt during the period 2003-2016, whose published financial data refer to the period 2003-2014. The year in which a firm is declared bankrupt does not coincide with the year of publication of the latest financial statements due to the time required to complete the bankruptcy process.
2. All the companies in the sample have the legal form of the public limited company.
3. Bankruptcy is a result of the formal bankruptcy process.
4. All the companies in the sample followed the same accounting principles, and their published financial statements were prepared based on the principles of the Greek General Accounting Plan.
5. Companies are active in the trade sector.
6. In the absence of certain financial data, due to non-publication of financial statements, for some years before bankruptcy, the latest available data were used.
7. A random sample of 119 non-bankrupt companies was created, which was matched to the sample of bankrupt ones, based on year, sector and sub-sector. Non-random selection of sample firms creates bias problems (Zmijewski, 1984).
In order to investigate the relation between the forecasting ability of the model and the degree of homogeneity of the samples of the bankrupt firms, two additional samples were created that relate to the wholesale trade sector (75 companies) and to the wholesale trade-household articles sub-sector (31 companies) as presented at Table 1.
METHODOLOGY - ECONOMETRIC ANALYSIS
Selection of financial ratios
The criteria with which the financial indicators were initially selected are:
1. Their capacity and their interpretative power, which has been acknowledged in earlier investigations in other countries as well (Chen and Shimerda, 1981).
2. Their frequency and popularity, with which they appear in the international literature (Altman, 1968).
3. Covering all operational features of the company (Liquidity, Activity, Capital Efficiency, Capital Structure) (Dambolena and Khoury, 1980).
The following financial ratios cover a wide range of information and highlight the qualitative features of the individual samples:
x1: Sales to Total Assets;
x2: EBITDA to Total Assets;
x3: Net Working Capital to Total Assets;
x4: Total Liabilities to Total Assets;
x5: Current Assets to Current Liabilities;
x6: Gross Profit Margin;
x7: Equity to Loan Capital;
x8 : Net Profit Margin;
x9: Return on Capital Employed;
x10 : Return on Equity;
x11: Interest Coverage by EBITDA;
x12: Sales to Receivables.
x13 : Retained earnings to Total Assets
x14 : Operating Cash Flows to Total Assets.
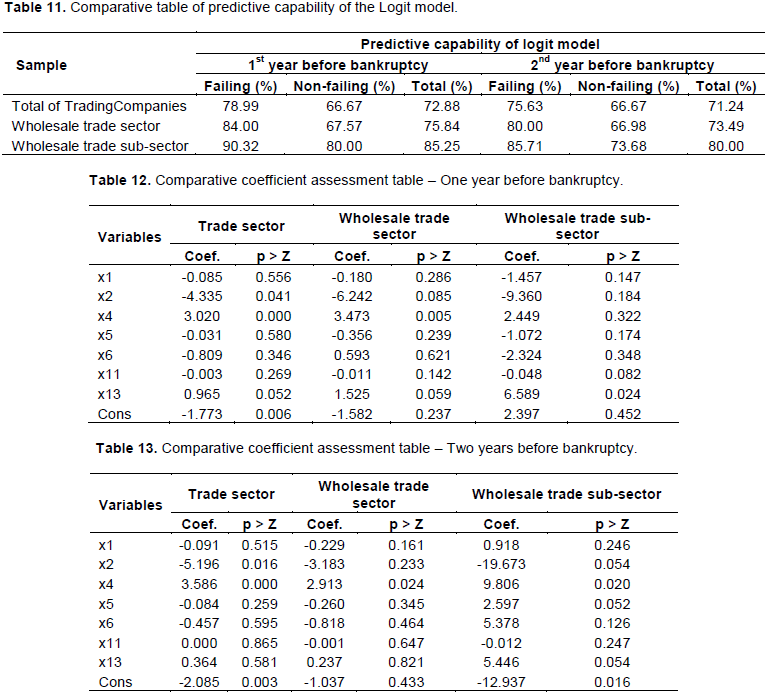
The method of factor analysis (Kim and Mueller, 1978a) was used to identify and select the most appropriate financial ratios to be used in the development of business failure prediction models. This is a statistical technique designed to reduce the dimensions of the problem being analyzed. This reduction is achieved by minimizing the initial number of financial indicators (independent variables) to a level that allows for better management, provided that the final number of variables retains as much as possible of the information revealed about the problem by the initial number of variables.
Factor analysis
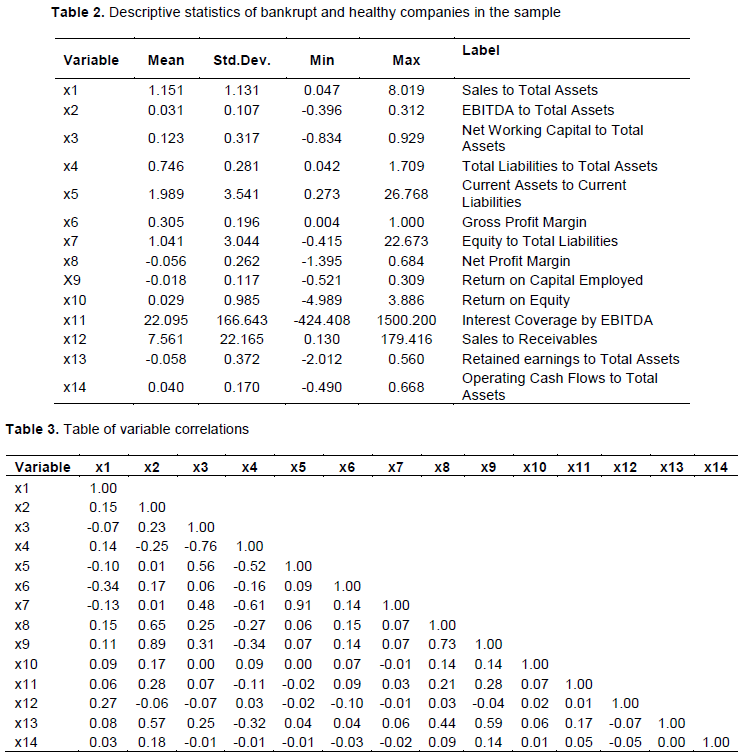
Descriptive statistics of bankrupt and healthy companies in the sample are listed in Table 2.
The assessment process is essentially based on the assessment of the common factors and their coefficients, following the steps below:
1. Checking for correlations of variables.
2. Determining the number of factors and assessing the model.
3. Rotation of the model in order to better interpret the factors.
4. Statistical verification of the suitability of the model.
For the assessment of the model, the maximum likelihood estimation will be used.
Variable correlations
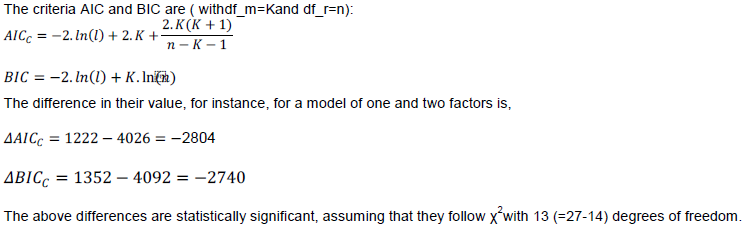
Table 3 displays all the pairwise correlation coefficients between the variables. We note that only x5 variable with x7 variable, and x2 variable with x9 variable show a large correlation (91 and 89%, respectively), which may lead to multicollinearity problems if both variables are used in the same regression model.
Model assessment
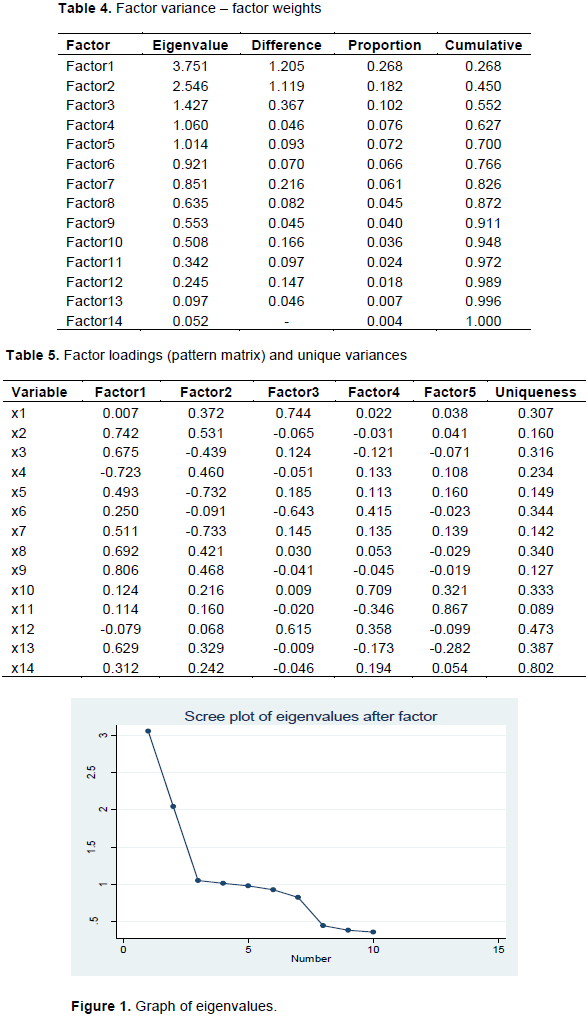
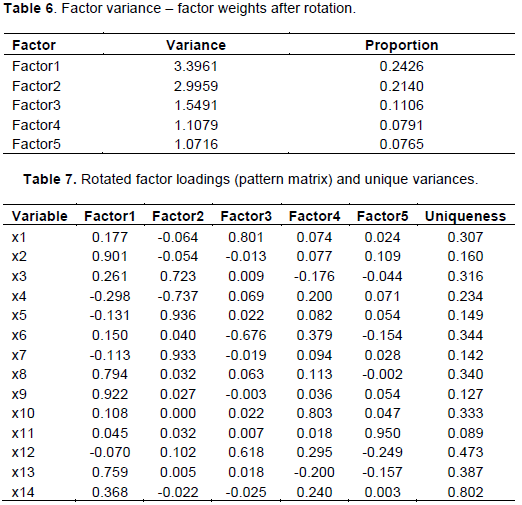
Tables 4 and 5 show the results of the factor analysis of the model, with 14 variables. The "cumulative" column shows the percentage of the model variance that is explained each time, taking into account the use of a different number of factors. We conclude that the use of five factors explains at least 70% of the total variance
In addition, the "Uniqueness" column displays the variance percentage of each variable which is not explained by the common factors that emerged after the assessment. A rule of thumb is that larger amounts than 0.6 in "Uniqueness" show that the variance of the variable is not adequately explained by the common factors, as in the case of variable x14.
Figure 1 depicts a Scree-Test for the appropriate choice of the number of factors. Examining the graph of eigenvalues indicates to stop factoring at the point where the slope of the line approaches zero (where the eigenvalue is 1). Hence, we conclude that no more than five factors should be extracted.
Model rotation
In an attempt to formulate as interpretable factor weights as possible in relation to the initial assessment, we proceeded to rotation of the model. In Tables 6 and 7 we present the results. As shown in Figure 1 and Tables 4 and 5, the factors selected are those whose variance is greater than 1 (Kim and Mueller, 1978b). We note here that the rotation process does not change the the assessments substantially but provides a more complete and more comprehensible presentation of the weights of the variables in each factor (Table 7).
Selection of variables
In Tables 8 and 9 we present the values ​​of the criteria we applied for the selection. More specifically, in Table 8 we present the values
​​of the AIC and BIC criteria. All three criteria support the selection of a maximum of 5 factors. More than 5 factors have little contribution to the explanatory capability of the model. For the decision, based on the criteria, we rely on the importance of the value difference between the criteria as an increasing number of factors is selected. The process in brief is as follows:
However, this is not the case for more than 5 factors.
Table 9 shows the values ofKaiser-Meyer-Olkin criterion.
According to the authors, values higher than 0.5 are considered acceptable.
According to the results (Table 7) the weight of the cash flow variable (x14 Operating Cash Flows to Total Assets) on factors is not large enough to be considered significant. Therefore, we exclude variable x14 from our analysis, even though it is usually used in similar studies. From our point of view, it is not appropriate for predicting failure because it presents no differences in behavior between healthy and failed companies. The variable in the case of firms facing difficulties has a better behavior, which resembles that of healthy businesses. This is the result of the actions undertaken by the companies’ directors, who, operating under pressure conditions, liquidate their assets, stocks and receivables (Rosner, 2003). As reported by Bhargava et al. (1998), directors of failed firms liquidate assets, which may be priced below the cost of ownership, resulting in positive net cash flows, even if the companies may be experiencing great difficulties.
Taking into account the results of the factor analysis and the correlations between the initial variables, we decided to use the financial ratios presented in Table 10, which are going to play the role of the independent variables in the Logit model. More specifically, the selection of the above set of variables is based on the fact that they display the greatest weight in each factor (Table 7), while at the same time limiting any multicollinearity problems by excluding the variables that are highly correlated with those initially selected. Additionally, the appropriate variables must present KMO values higher than 0.5 (Table 9).
Econometricanalysis
The Logit and Probit models are widely used for the form of analysis presented in this paper. Their difference is in the hypothesis regarding the form of distribution. The logistic distribution is similar to the normal one, with only differences in heavy tails.According to Green (2003) it is more like t-distribution with 7 degrees of freedom. Therefore for intermediate estimated values (x’b), for example in the range -1,2 and 1,2, the models give similar probabilities (Green, 2003). Different results in the models can be observed when there are very few observations on the dependent variable or when there is large variance in the values ​​of significant explanatory variables and especially when both apply (Green, 2003).
The model that was selected in order to investigate the prediction of failure and bankruptcy of Greek trading companies and the relation between the predictive capability of the models and the degree of homogeneity of the samples of bankrupt firms is the Logit distribution model, which is very often used in similar cases asin the form of analysis presented in this paper.
The Logit model is a nonlinear regression model specifically designed to assess dependent binary variables. It gives the probability that the dependent variable will get the value 1, given the values of the independent variables, by adopting techniques that lead the values being assessed to move in the range (0,1). This is precisely its main point of superiority inrelation to the linear probability model, which does not guarantee the range (0,1)(Anderson,1972, Efron, 1975,and Keasey and Watson,1991).
The logistic probability model (Logit)
Logit models use the cumulative standard logistic distribution function to predict the probability that the dependent variable will take value 1:
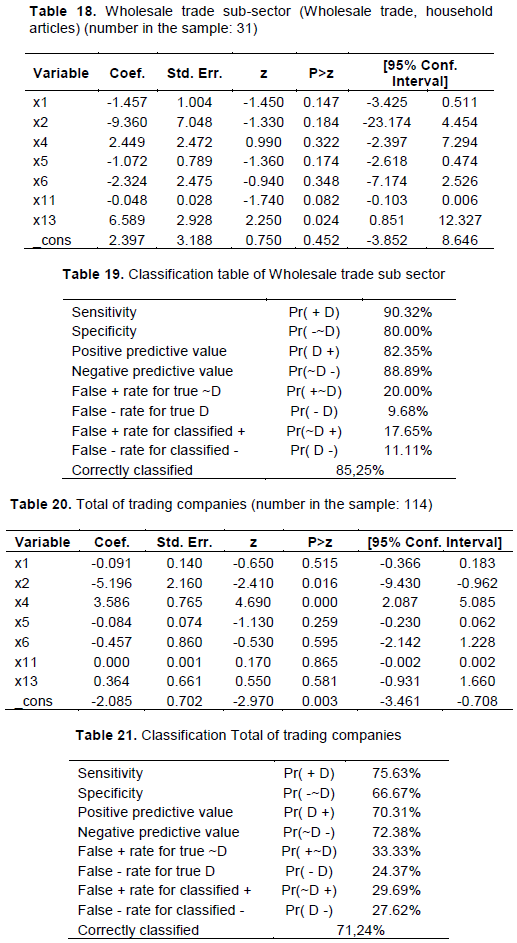
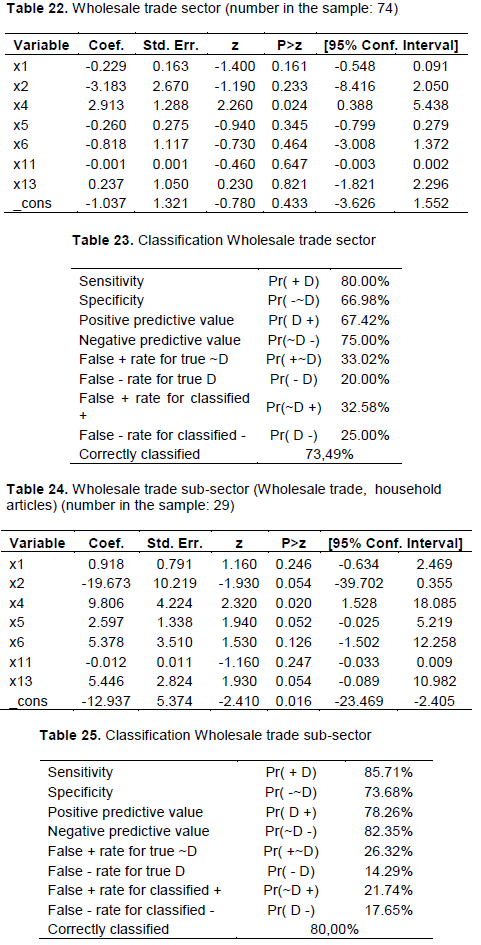
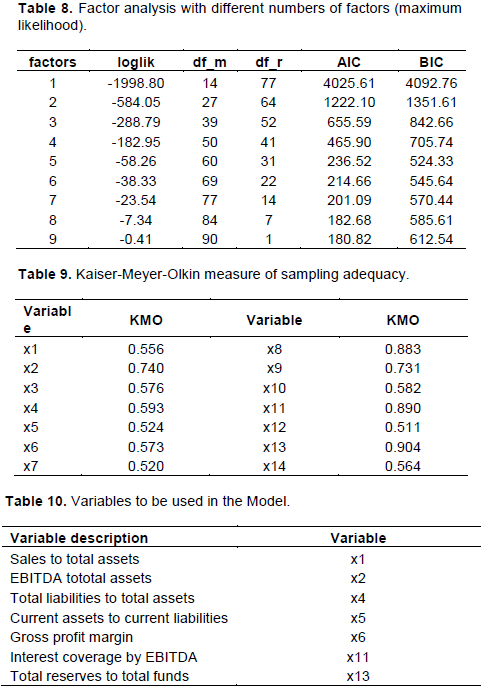
In the following tables, we present the comparative results following the assessment of the models we developed in the previous sections, both in terms of predictive capability and assessments of the coefficients of the model (Tables 11 and 12, respectively). The analytical results, that is, estimates by sector and sub- sector for one and for two years before bankruptcy are presented at the end of this section.
A significant improvement is observed in both the overall predictive capability of the Logit model and in the predictive capability of the samples of failed and healthy firms as the specialization of activities increases, that is, the homogeneity of the accounting and financial characteristics, during the first and the second year before bankruptcy.
The percentage of classification of the sample of bankrupt companies far exceeds the classification percentage of the sample of healthy companies in all three sample cases, while the predictive capability of the Logit model during the 1st year before bankruptcy exceeds that of the 2nd year before bankruptcy in all three samples.
In particular, the predictive capability of our model
regarding bankrupt firms,for a year before bankruptcy, when we investigated the entire sample ofcommercial enterprises was 78.99%. When the survey was focused only on wholesalers, the percentage stood at 84%, that is, it was improved by 6%, while when we reduced the sample to the sub-sector of the wholesale trade, the percentage stood at 90.32%, improving by 7.5% and a total of 14.34%. The respective percentages for the healthy businesses were 66.67% for the whole sample, 67.57% for the wholesale trade, and 80% for the sub-sector. Similar differences were also observed for the second year before bankruptcy. We believe that the homogeneity of the sample influenced the predictive capability of the model catalytically, mainly for the following reason: As long as the sample is homogenized, the effect of the variables has greater separation capacity. This may be happening because the variance of variables between firms across the broade rsector is greater, so their impact on the healthy and the bankrupt ones is more likely to be identical.
It was noticed here that the analyses were repeated using the Probit model. The results were about the same.
In the first year before bankruptcy, for variables x1, x5, x11, as the homogeneity of the samples increases as well as the degree of significance, the coefficient decreases (getting increased in absolute values), which shows that the influence of sales, liquidity and profitability are significantly increased. The dramatic increase of the influence of firm’s profitability is also apparent from the variable x2 whose coefficient in the wholesale trade sub-sector has the lowest value, -9.360.
The coefficient of the variable x2 (EBITDA to total assets) in both the 1st and the 2nd year prior to bankruptcy appears with negative sign, though statistically significant only at Trade sector(p-value<0.05) (Table 13). The coefficient of the variable x4 is positive and statistically significant (p-value <0.05) indicating that high leveraged firms face financial distress more often than firms with low ratio of total liabilities to total assets. However, Ikpesu and Eboiyehi (2018) argue that the ratio of Long term loans to total assets has negative impact on financial distress. This is because firms that received long term loan are expected to be positively evaluated from their lenders/creditors (institutions or banks).
The Tables (14-25) below, present the analytical results of the estimation of model (1). The contents of the tables are interpreted as follows:
1. symbol“D”: bankrupt companies
2. symbol“~D”: “healthy” companies
3. symbol“+”:classification as bankrupt
4. symbol“-“:classification as “healthy”
5. Sensitivity: the percentage of correct classification of bankrupt companies
6. Specificity: the percentage of correct classification of
healthy companies
7. Positive predictive value: the percentage of the actually bankrupt companies in the total of those that were classified as bankrupt (in the example 76/103=73,79%)
8. Negative predictive value: the percentage of actually “healthy” companies in the total of those that were classified as “healthy” (in the example 74/99=74,75%)
9. Type ΙΙ error
10. Type Ι error
11. the error of the percentage in "Positive predictive value”
12. the error of the percentage in "Negativepredictive value”
13. the total predictive capability of the model. One year before bankruptcy
This paper examines the existence of differences in the ability to predict business failure by applying the logit model to specific sectors of the economy. We examined the forecast of the bankruptcy of Greek trading companies and, in particular, the relation between the predictive capability of forecasting techniques and the degree of homogeneity of the samples of bankrupt and healthy companies.
It was find, in the first place, that the percentage of classification of the sample of bankrupt companies far exceeds the percentage of classification of the sample of healthy companies in the three sample cases, both in the first year and in the second year before bankruptcy. This is interpreted by the fact that the samples of firms that include bankrupt companies are more homogeneous than the samples of healthy companies,which have been created by random sampling process.
The increasing homogeneity of firm samples leads to an overall better predictive capability of the model. In the first year before bankruptcy, the overall predictive capability of the Logit model for all trading companies is 72.88%, while when it comes to the wholesale trade sub-sector, the predictive capability of the model is 85.25%. Correspondingly, in the second year before bankruptcy, the total predictive capability of the model is increased from 71.24% to 80.00%.
Also, the increasing homogeneity of firm samples leads to a better predictive capability of the model, both in the sample of bankrupt and in that of healthy businesses.
The predictive capability of the Logit model in the first year before bankruptcy is higher than that of the 2nd year before bankruptcy in all three samples.
The percentage change in the predictive capability of the model increases as the specificity of the activities increases, that is, the homogeneity of the accounting and financial characteristics of the firm samples, in all cases.
The capital structure variable (debt to total assets), shows in all three cases the best explanatory ability. It is statistically significant and shows a positive sign, which means that an increase in the value of the variable increases also the probability of bankruptcy.
The financial ratios (independent variables), which describe the accounting and financial characteristics, differ in their degree of significance among the three above-mentioned firm samples.Finally, we note that these results are based on Greek enterprises, which are mostly non-listed and family-owned. The process we presented in our paper could be repeated in other areas of economic activity, as for example in the manufacturing sector and its sub-sectors. Also, its application on a sample of listed companies would be interesting. The results of our study suggest that analyses designed top changes in the firms’ behavior that mark their course towards failure or bankruptcy should necessarily refer to more homogeneous samples. Analysts, managers, banks, and generally all interested parties should therefore use firm samples relating to the sub-sector level for comparisons, in order to reach unbiased conclusion about the probability of business failure.
The authors have not declared any conflict of interests.
REFERENCES
|
Agarwal V, Tafler R (2008). Comparing the performance of market-based and accounting-based bankruptcy prediction models. Journal of Banking and Finance 32(8):1541-1551.
Crossref
|
|
|
|
Altman E (1968). Financial Ratios, Discriminant Analysis and the Prediction of Corporate Bankruptcy. The Journal of Finance 23(4):589-609.
Crossref
|
|
|
|
|
Altman E, Margaine M, Schlosser M, Vernimmen P (1974). Statistical credit analysis in the textile industry: A French experience. Journal of Financial and Quantitative Analysis 9:195-211.
Crossref
|
|
|
|
|
Altman E, Haldeman R, Narayanan P (1977). Zeta Analysis: A new model to identify bankruptcy risk of corporations. Journal of Banking and Finance 1:29-54.
Crossref
|
|
|
|
|
Altman E, Hartzell J, Peck M (1995). A scoring system for emerging market corporate bonds. Salomon Brothers High Yield Research.
|
|
|
|
|
Anderson PW (1972). More is different. Broken symmetry and the nature of the hierarchical structure of science. Science 177:393-396.
Crossref
|
|
|
|
|
Aziz A, Emanuel D, Lawson G (1988). Bankruptcy prediction – An investigation of cash flow based models. Journal of Management Studies 25(5):419-437.
Crossref
|
|
|
|
|
Beaver W (1966). Financial Ratios as Predictors of Failure. Journal of Accounting Research 4:71-111.
Crossref
|
|
|
|
|
Bhargava M, Dubelaar C, Scott T (1998). Predicting bankruptcy in the retail sector: an examination of the validity of key measures of performance. Journal of Retailing and Consumer Services 5(2):105-117.
Crossref
|
|
|
|
|
Blum M (1974). Failing company discriminant analysis. Journal of Accounting Research 12(1):1-25.
Crossref
|
|
|
|
|
Camska D (2016). Accuracy of Models Predicting Corporate Bankruptcy in a Selected Industry Branch. Journal of Economics 64(4):353-366.
|
|
|
|
|
Charalambakis CE (2013). On the prediction of corporate financial distress in the light of the financial crisis: empirical evidence from Greek listed firms. Working Paper 164, Bank of Greece.
|
|
|
|
|
Charalambakis EC, Garrett I (2016). On the prediction of financial distress in developed and emerging markets: Does the choice of accounting and market information matter? A comparison of UK and Indian firms. Review of Quantitative Finance and Accounting 47(1):1-28.
Crossref
|
|
|
|
|
Charitou A, Neophytou E, Charalambous C (2004). Predicting corporate failure: empirical evidence for the U.K. European Accounting Review 13(3):465-497.
Crossref
|
|
|
|
|
Chava S, Jarrow RA (2004). Bankruptcy Prediction with Industry Effects. Review of Finance 8(4):537-569.
Crossref
|
|
|
|
|
Chen KH, Shimerda TA (1981). An Empirical Analysis of Useful Financial Ratios. Financial Management 10(1):51-60.
Crossref
|
|
|
|
|
Chen YW, Chang Y (2013). Peer effects on corporate cash holdings. Working paper.
|
|
|
|
|
Dambolena I, Khoury S (1980). Ratio stability and corporate failure. The Journal of Finance 35(4):1017-1026.
Crossref
|
|
|
|
|
Deakin EB (1972). A Discriminant Analysis of Predictors of Business Failure. Journal of Accounting Research 10(1):167-179.
Crossref
|
|
|
|
|
Diamond J (1976). Pattern Recognition and the Detection of Corporate Failure. Ph.D Thesis, New York University.
|
|
|
|
|
Dimitras A, Slowinski R, Susmaga R, Zopounidis C (1999). Business failure prediction using rough sets. European Journal of Operational Research 114:263-280.
Crossref
|
|
|
|
|
Edmister R (1972). An empirical test of financial ratio analysis for small business failure prediction. The Journal of Financial and Quantitative Analysis 7(2):1477-1493.
Crossref
|
|
|
|
|
Efron B (1975). The Efficiency of Logistic Regression Compared to Normal Discriminant Analysis. Journal of the American Statistical Association 70(352):892-898.
Crossref
|
|
|
|
|
Frydman H, Altman E, Kao D (1985). Introducing Recursive Partitioning for Financial Classification: The Case of Financial Distress. The Journal of Finance 40(1):269-291.
Crossref
|
|
|
|
|
Gemara G, Monicheb L, Moralesc AJ (2016). Survival analysis of the Spanish hotel industry. Tourism Management 54:428-438.
Crossref
|
|
|
|
|
Gombola M, Ketz J (1983). A Note on Cash Flow and Classification Patterns of Financial Ratios. The Accounting Review 58(1):105-114.
|
|
|
|
|
Gombola M, Haskins M, Ketz J, Williams D (1987). Cash Flow in Bankruptcy Prediction. Financial Management 16:55-65.
Crossref
|
|
|
|
|
Grablowsky BJ, Talley WK (1981). Probit and discriminant factors for classifying credit applicants: A comparison. Journal of Economics and Business 33(3):254-261.
|
|
|
|
|
Green H W (2003). Econometric Analysis. 5th ed., Prentice-Hall, Inc.
|
|
|
|
|
Hanweck G (1977). Predicting bank failure. Research Papers in Banking and Financial Economics, Financial Studies Section, Board of Governors of the Federal Reserve System, Washington D.C.
|
|
|
|
|
Hossari G (2009). Absence of Industry Effect in Modelling Corporate Collapse in Australia. Global Economy and Finance Journal 2(1):20-30.
|
|
|
|
|
Ikpesu F, Eboiyehi OC (2018). Capital structure and corporate financial distress of manufacturing firms in Nigeria. Journal of Accounting and Taxation 10(7):78-84.
Crossref
|
|
|
|
|
Johnsen T, Melicher R (1994). Predicting corporate bankruptcy and financial distress: Information value added by multinomial logit models. Journal of Economics and Business 46:269-286.
Crossref
|
|
|
|
|
Kahya E, Theodossiou P (1999). Predicting Corporate Financial Distress: A Time-Series CUSUM Methodology. Review of Quantitative Finance and Accounting 13(4):323-345.
Crossref
|
|
|
|
|
Keasey K, McGuinness P (1990). The Failure of UK Industrial Firms for the Period 1976–1984, Logistic Analysis and Entropy Measures. Journal of Business Finance and Accounting 17(1):119-135.
Crossref
|
|
|
|
|
Keasey K, Watson R (1991). Financial distress prediction models: a review of their usefulness. British Journal of Management 2:89-102.
Crossref
|
|
|
|
|
Kim JO, Mueller CW (1978a). Introduction to factor analysis: What it is and how to do it", Sage University Paper Series on Quantitative Applications in the Social Sciences, series no. 07-013. Newbury Park, CA: Sage.
|
|
|
|
|
Kim JO, Mueller CW (1978b). Factor analysis: Statistical methods and practical issues. Sage University Paper Series on Quantitative Applications in the Social Sciences, series no. 07-014. Newbury Park, CA: Sage.
|
|
|
|
|
Kim SY (2011). Prediction of hotel bankruptcy using support vector machine, artificial neural network, logistic regression and multivariate discriminant analysis. The Service Industries Journal 31(3):441-468.
Crossref
|
|
|
|
|
Lang HL, Stulz R (1992). Contagion and Competitive intra-industry effects of Bankruptcy announcements. Journal of Financial Economics 32:45-60.
Crossref
|
|
|
|
|
Kosmidis K, Venetaki M, Stavropoulos A, Terzidis K (2011). Predicting financial distress in Greek business: A viability factors perspective. MIBES Transactions 5(2):158-170.
|
|
|
|
|
Leary MT, Roberts MR (2014). Do peer firms affect corporate financial policy?. The Journal of Finance 69:139-178.
Crossref
|
|
|
|
|
Liang D, Lu CC, Tsai CF, Shih GA (2016). Financial ratios and corporate governance indicators in bankruptcy prediction: A comprehensive study. European Journal of Operational Research 252(2):561-572.
Crossref
|
|
|
|
|
Luoma M, Laitinen EK (1991). Survival Analysis as a Tool for Company Failure Prediction. Omega International Journal of Management Science 19(6):673-678.
Crossref
|
|
|
|
|
Martin D (1977). Early warning of bank failure: A logit regression approach. Journal of Banking and Finance 1:249-276.
Crossref
|
|
|
|
|
McGurr P (1996). Failure prediction of retail firms through use of financial ratios. Ph.D. Thesis, Purdue University.
|
|
|
|
|
McGurr P, DeVaney S (1998). Predicting Business Failure of Retail Firms: An Analysis Using Mixed Industry Models. Journal of Business Research 43(3):169-176.
Crossref
|
|
|
|
|
Meyer PA, Pifer HW (1970). Prediction of bank failure. Journal of Finance 25:853-868.
Crossref
|
|
|
|
|
Micha B (1984). Analysis of Business failures in France. Journal of Banking and Finance 8:81-291.
Crossref
|
|
|
|
|
Michalopoulos M, Zopounidis C, Kouris I (1993). An integrated DSS for assessment of the risk of failure. Applied Stochastic Models and Data Analysis, World Scientific Publishing Co Pte, Ltd, New Jersey pp. 606-625.
|
|
|
|
|
Ohlson J (1980). Financial Ratios and the Probabilistic Prediction of Bankruptcy. Journal of Accounting Research 18(1):109-131.
Crossref
|
|
|
|
|
Ooghe H, Waeyaert N (2004). Causes of Company Failure and Failure Paths: The Rise and Fall of Fardis. European Case Study pp. 1-8.
|
|
|
|
|
Parsa HG, Self J, Sydnor-Busso S, Yoon HJ (2011). Why restaurants fail? part II - the impact of affiliation, location, and size on restaurant failures: Results from a survival analysis. Journal of Foodservice Business Research 14(4):360-379.
Crossref
|
|
|
|
|
Peel MJ, Peel DA (1988). A multilogit approach to predicting corporate failure–some evidence for the U.K corporate sector. Omega 16(4):309-318.
Crossref
|
|
|
|
|
Pinkwart A, Proksch D, Schefczyk M, Fiegler T, Ernst C (2015). Reasons for the Failure of New Technology-Based Firms: A Longitudinal Empirical Study for Germany. Credit and Capital Markets 48(4):597-627.
Crossref
|
|
|
|
|
Platt H, Platt M (1990). Development of a class of stable predictive variable: the case of bankruptcy prediction. Journal of Business Finance and Accounting 17(1):31-51.
Crossref
|
|
|
|
|
Popadak JA (2012). Dividend payments as a response to peer influence. Working Paper Available at SSRN 2170561.
|
|
|
|
|
Pozzoli M, Paolone F (2016). An Overlook at Bankruptcy Prediction in Italy in 2016: An Application of the Altman's Model on Failed Italian Manufacturing Companies In The 2016 - First Quarter. International Journal of Accounting and Financial Reporting 6(2):293-309.
Crossref
|
|
|
|
|
Richardson G, Taylor G, Lanis R (2015). The impact of financial distress on corporate tax avoidance spanning the global financial crisis: Evidence from Australia. Economic Modelling 44(C):44-53.
Crossref
|
|
|
|
|
Rosner R (2003). Earnings Manipulation in Failing Firms. Contemporary Accounting Research 20(2):361-408.
Crossref
|
|
|
|
|
Ross J, Ziebart D, Meder A (2018). A new measure of firm-group accounting closeness. Review of Quantitative Finance and Accounting 2018:1-25.
Crossref
|
|
|
|
|
Situm M (2015). Analysis of Correlational Behavior of Solvent and Insolvent Firms Based on Accounting Ratios. Journal of Modern Accounting Auditing 11(5):233-259.
|
|
|
|
|
Skogsvik K (1990). Current cost accounting ratios as predictors of business failure: The Swedish case. Journal of Business Finance and Accounting 17(1):137-160.
Crossref
|
|
|
|
|
Soo YK (2018). Predicting hospitality financial distress with ensemble models: The case of US hotels, restaurants, and amusement and recreation. Service Business 12(3):483-503.
Crossref
|
|
|
|
|
Standard and Poor's Corporation (1982). Credit overview: Corporate and international ratings. New York pp. 30-33.
|
|
|
|
|
Stokes D, Blackburn R (2002). Learning the hard way: the lessons of owner-managers who have closed their business. Journal of Small Business and Enterprise Development 9(1):17-27.
Crossref
|
|
|
|
|
Taffler R, Tisshaw H (1977). Going, Going, Gone – Four Factors Which Predict. Accountancy 88:50-54.
|
|
|
|
|
Taffler R (1982). Forecasting company failure in the U.K using discriminant analysis and financial ratio data. Journal of the Royal Statistical Society 145(3):342-358.
Crossref
|
|
|
|
|
Theodossiou P (1993). Predicting Shifts in the Mean of a Multivariate Time Series Process: An Application in Predicting Business Failures. Journal of the American Statistical Association 88(422):441-449.
Crossref
|
|
|
|
|
Thornhill S, Amit R (2003). Learning About Failure: Bankruptcy, Firm Age, and the Resource-Based View. Organization Science 14(5):497-509.
Crossref
|
|
|
|
|
Wu Y, Gaunt C, Gray S (2010). A comparison of alternative bankruptcy prediction models. Journal of Contemporary Accounting and Economics 6(1):34-45.
Crossref
|
|
|
|
|
Zavgren C (1985). Assessing the Vulnerability to Failure of America Industrial Firms. A Logistic Analysis. Journal of Business Finance and Accounting 12(1):19-45.
Crossref
|
|
|
|
|
Zmijewski M (1984). Methodological issues related to the estimation of financial distress prediction models. Journal of Accounting Research 22:59-86.
Crossref
|
|