The study empirically examines the relationship between macroeconomic conditions and corporate tax compliance in the Greek setting where extreme aggregate fluctuations have taken place. Using a sample of 246,867 firm-year observations from 2004 to 2014, the study found strong evidence that there is negative association between economic conditions, as measured by the rate of gross domestic product, and corporate tax avoidance magnitude thus confirming recent prior evidence. We however, found that the association between the state of economic conditions and corporate tax evasion magnitude is positive. In other words, based on quantitative results combining firm-level and macroeconomic data, we argue that, all other things being equal, during recession phases of the economy firms are basically intended to avoid taxes whereas during expansion phases firms are basically focused and apply in a greater extent tax evasion practices. To the best of this study knowledge this is the first study providing empirical evidence on how macroeconomic cycles affect all aspects of corporate tax compliance behavior.
Key words: Tax avoidance, tax evasion, economic cycles.
This paper studies the relation between macroeconomic fluctuations and corporate tax compliance in an ideal experimental setting: the Greek business environment for the period 2004 to 2014 when the remarkable post Euro-entrance growth period was followed by the recession of 2009 onwards, and when at the same period the corporate tax rates changed seven times.
The interaction between macroeconomic forces and tax compliance dimensions is examined at micro-level on a panel dataset comprising all public and private firms obliged to prepare financial statements in Greece. To date, the impact of the macroeconomic conditions has been tested only on the corporate tax avoidance framework. Here we extend prior research by considering both aspects of tax compliance that is, tax avoidance and tax evasion.
Following Weisbach (2003), we classify tax avoidance as legal tax planning and tax evasion as illegal. Both tax planning activities (legal or illegal) have a wide range of transactions whose primary intent is to lover firm’s tax liability.
We employ a panel data set with detailed firm-level information on all incorporated firms operating in Greece over the period 2004 to 2014. To empirically test the link between macroeconomic fluctuations and tax compliance aspects, we formulate several hypotheses employing various proxies of corporate tax avoidance and tax evasion as dependent variables.
The study independent variable is the most representative macroeconomic variable (GDP) expressed at regional level (NUTS II) in order to capture existing significant inequalities among Greek regions. Control variables used in prior literature complete the set of variables for this study. All hypotheses are tested through multivariate regression analysis considering additional sensitivity analysis and robustness tests.
Unlike what might be expected, the study results indicate a different interaction and impact of macro-economic terms to tax avoidance and tax evasion behavior of sample firms respectively. More specifically, while we find a negative association between economic conditions and corporate tax avoidance thus confirming recent prior evidence we also found that the association between the state of economic conditions and corporate tax evasion is positive.
In other words, based on quantitative results combining firm-level and macroeconomic data, we argue that, all other things being equal, during recession phases (expansion phases) firms tend to mostly avoid rather than evade taxes (mostly evade rather than avoid). To the best of this study, this is the first study providing empirical evidence on how macroeconomic cycles affect corporate tax compliance behavior.
The results of this study contribute to the literature by providing evidence of a rather paradoxical tax compliance behavior adopted by firms depending on the state of the overall economy. It remains unclear whether this behavior is inherently stimulated by firm- specific motivations or it is the governmental practices, policy decisions and tolerance that lead to this phenomenon as a mean (unconfessed though) for example to mitigate the effect of crisis to the society. In any case we believe that the confirmation of these results in different institutional and cultural settings along with the identification of possible factors driving tax planning corporate decisions and in a complicated and inconstant economic environment constitute important issues for future research.
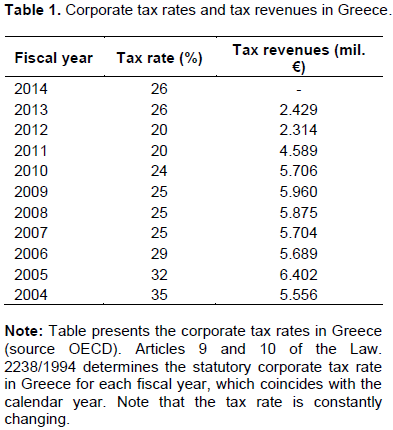
Corporate taxation and compliance framework in Greece Since 2009, Greece has entered a period of deep recession as a consequence of prevailing serials structural problems of the economy for many years. At the same period, government tax reform efforts and imposed corporate tax rate increases have not resulted in anticipated tax revenues (Table 1).
Concerning its accounting system, Greece is traditionally classified to the group of countries considered to have a high book-tax alignment regime. Greek Academic Achievement Plan (GAAP), since their introduction in late 1980, were basically oriented to serve tax collection purposes, and in almost all areas tax regulations supersede GAAP. However, recently, standard setters in Greece in accordance with the EU Directive 2013/34 concerning the modernization of the reporting system of EU non-listed firms, introduced the new Greek Accounting Standards.
More specifically with the Greek Law 4308/2014 which incorporated legislation regulations of Directive
34/2013/EU, former Greek GAAP and the Code of Tax Reporting and Transactions were abolished, and new Greek Accounting Standards were applied from 1.1.2015 onward. New standards, governed by the philosophy of International Financial Accounting Standards (IFRS), aim to enhance reliability and transparency of smaller entity’s financial statements with a special view to the tax avoidance and tax evasion issues thus introducing the obligation of an entity to monitor the accounting basis as well as the tax basis of the documentation regarding revenue, expenses, assets, liabilities and equity.
In their empirical study, about firms tax-induced incentives for earnings management, Karampinis and Hevas (2013) investigate the effect of IFRS adoption in the perceived book-tax conformity in Greece and conclude that IFRS releasing financial income from tax implications by reducing book-tax conformity. Further their findings suggest that due to high book–tax conformity in the pre-IFRS period tax pressure restricts (exacerbates) upward (downward) earnings management an effect that weakens after IFRS adoption.
International monetary fund (IMF) provides a comprehensive overview (IMF Country Report No. 13/155) about the tax revenue administration characteristics in Greece, and their implications for the economic growth. According to the report, tax collection in Greece is very low by European Union (EU) standards mainly due to two essential problems:
(1) Nonpayment of a large share of assessed taxes and
(2) Extensive usage of tax avoidance and tax evasion schemes.
Weak enforcement and inadequate instruments or workforce are expressed as the main sources of the first problem. High self-employment rates, low probability of detection, low effective penalties, weak social norm of compliance, frequent use of amnesty schemes, and pressure for business survival are among other factors identified as critical for the prevalence of corporate non-compliance.
Results of other empirical studies are also indicative, and confirm the aforementioned arguments. Schneider and Buehn (2012) in a cross-country study estimate the size of the shadow economy in Greece at around 27% of gross domestic product (GDP), compared to an Organisation for Economic Co-operation and Development (OECD) average of 20.2%. According to the authors, self-employment appears the most significantly correlated variable with the size of the shadow economy in Greece.
Similarly, Papageorgiou et al. (2012) find that the largest difference between the tax systems of Greece and the Euro Area countries concerns the effective tax rate on self-employment income, which in Greece is significantly lower, while 59% of the capital income tax base in Greece consists of self-employment income.
Using data on the outcomes of tax audits to Greek listed firms for the period 1992-2006, Kourdoumpalou and Karagiorgos (2012) estimated the mean rate of tax evasion at about 16%, a rather high percentage for a country where, at least until IFRS introduction in 2005, book and tax accounting were strongly aligned.
Research background and Hypothesis development Studies on the understanding of microeconomic responses to aggregate fluctuations have mainly concentrated on the effect of macroeconomic cycles on firm default probabilities (Hackbarth et al., 2006; Bernanke et al., 2009; Jacobson et al., 2013).
In general, their results provide evidence of a substantial impact from aggregate fluctuations on business defaults rates. The association between macroeconomic conditions and quality of corporate financial reporting has been investigated in various contexts (Johnson 1999; Ho et al., 2001; Davis-Friday et al., 2006; Jenkins et. al. 2009; Kousenidis et. al. 2013; Filip and Raffournier 2014) producing however mixed results.
Concerning business reaction and tax behavior during crises, traditional studies (Brondolo 2009; Sancak et al., 2010) suggest that recessions cause a worsening in firms’ tax compliance due to several factors such as shortage of liquidity, deterioration of operational performance and minimal perceived risk of tax aggressiveness compared to the potential upside gains (avoiding bankruptcy).
Useful insights are also given by other more recent empirical studies focused on the interaction of macroeconomic terms and firm-specific characteristics. Edwards et al. (2013) provide convincing evidence, by using a large sample of firms from 1987 to 2011, that firms in financial distress increase tax aggressiveness (lower near-term cash ETRs.) to generate additional cash flows (firms require additional cash in order to finance existing operations and remain solvent).
Richarson et al. (2015) based on a sample of US publicly-listed firms over the 2006 to 2010 period, indicate that both financial distress and the global financial crisis are positively associated with tax aggressiveness. In a similar study, the same authors, Richarson et al. (2015) investigate for the same period
the effect of crisis on tax aggressiveness of publicly-listed Australian firms and reach a similar study to that of the US result that is, that tax aggressiveness is magnified during periods of severe financial distress such as that experienced during the crisis of 2008. It should be noted that in these studies, the term tax aggressiveness is used more as a synonym to tax avoidance and not to tax evasion.
In the Greek context, Pappadà and Zylberberg (2015) measure corporate tax evasion by computing the VAT collection efficiency after 2010. Using a theoretical model calibrated to firm-level balance sheet data for 30.000 Greek firms authors show that following a VAT increase, the response of tax evasion to the austerity plan was larger among medium-size firms while around one third of the tax increase is lost because small and medium size firms expand their share of non-declared activity.
Tagkalakis (2013) using data from the Greek Economic Crime Fighting Unit tax inspections that took place in 2012 investigates the links between tax audits and tax offenders, and find that improvements in economic sentiment are associated with lower tax offenders-to-audits ratio.
In sum, there is evidence of significant relation between macroeconomic conditions and tax compliance. But due to the mixed results in prior literature, whether an improvement in macroeconomic conditions lead to a higher level of tax compliance for a firm is an empirical question. Stated formally, we formulate the following hypotheses to be tested in the study Greek sample:
(1) H1: Ceteris paribus, there is no difference in perceived firms’ tax compliance between recession and expansion phase of the economy.
(2) H2: Ceteris paribus, an improvement in macro-economic conditions decreases firms’ tax avoidance.
(3) H3: Ceteris paribus, an improvement in macro-economic conditions decreases firms’ tax evasion.
Empirical model
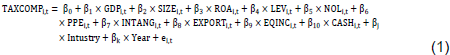
In order to investigate the association between corporate tax compliance and market fluctuations, we specify the following cross-sectional regression by firm i in year t:
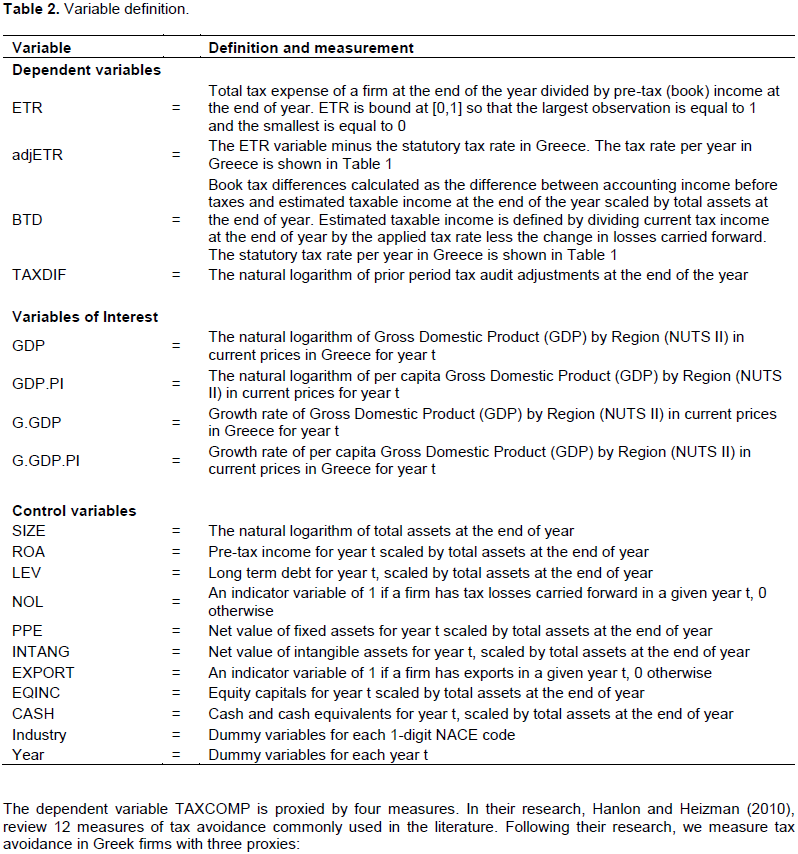
The model followed previous studies of Plesko (2007), Frank et al. (2009) and Omer et al. (2012). Table 2 present the variables included in the analysis.
The dependent variable TAXCOMP is proxied by four measures. In their research, Hanlon and Heizman (2010), review 12 measures of tax avoidance commonly used in the literature. Following their research, we measure tax avoidance in Greek firms with three proxies:
(1) Effective tax rate (ETR)
(2) Adjustable effective tax rate (adjETR) and total book-tax differences (BTD).
Each proxy capture different type of tax avoidance activities. Based on Dyreng et al. (2010) we define effective tax rate (ETR) for a given firm i for year t as:

According to Greek Accounting Standards (Greek GAAP) total income tax expense coincides with total current tax expense. That occur because Greek GAAP do not recognize deferred taxes.
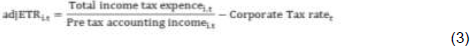
[1] In order to eliminate the effects of extreme values, measure of ETR is bound at [0,1] so that the largest observation is equal to 1 and the smallest is equal to 0. A lower (higher) value of ETR indicates an increased (decreased) level of tax avoidance. Prior empirical US literature that used ETR measure was based in a major assumption. The assumption that statutory corporate tax rate is stable over long periods of time. However in Greece as it is already mentioned, the statutory corporate tax rate changed seven times during 2004 to 2014. Therefore, we have to customize ETR measure to address this volatility, by using the adjusted ETR (adjETR) defined for a given firm i for year t as:
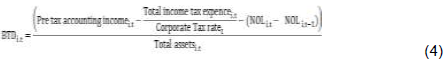
The third measure, following Wilson (2009), which used to measure tax avoidance is total book-tax differences (BTD). Calculated as the difference between accounting and estimated taxable income, scaled by total assets. Due to the confidentiality of taxable income, we can only estimate it, by the amount of total income tax expense. As a consequence, estimated taxable income is defined by dividing total income tax expense by the applied corporate tax rate of the year, less the change in losses carried forward. Resulted BTD for a given firm i for year t is:
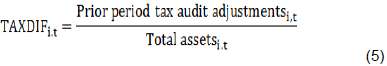
Finally, in order to measure tax evasion we used a unique measure (TAXDIF) that has not been applied in prior literature so far, and in the study opinion could provide a good approximation of the tax evasion magnitude in the absence of other sources of information such as results on real audits. TAXDIF of a firm i for year t is:
The rationale behind this measure is that tax offenders will have more prior period audit adjustments, identified by actual audits, than the other companies. Tax offenders manage to minimize the taxable income with illegal ways in order to pay less taxes.
In Greece, every year tax authority’s staff is supposed to check for their accuracy the tax forms of the companies that are obligated to submit. If tax infringements are identified then the firm has to make tax adjustments and pay additional taxes as a penalty.
Tax offenders rely on low probabilities of detection and low auditor productivity, said characteristics of the Greek tax revenue administration. A possible disadvantage of this measure identified on the quality of the control mechanisms of the tax authorities. The official body for implementation of audits in Greek enterprises is “Financial and Economic Crime Unit” (in Greek the initial is ΣΔΟΕ). But in recent years due to the economic crisis, the public sector in Greece
declined rapidly in staff, either because of personal retirements or of the staff-transfer to other departments. Thus,S the understaffing of tax authorities, that are responsible by the law for tax auditing in Greek firms, leads to scarce audits especially after 2011.
After all, we assume that firms with lover ETR and/or adjETR and higher BTD engage in more tax avoidance behavior. Additionally, firms with higher TAXDIF engage in more tax evasion behavior. Cross-sectional multiple regression (1) is then estimated separately for each of the four measures.
Our main test variable is GDP, representing the market fluctuation in Greece in order to investigate the association with corporate tax compliance. For these purpose we use two basic measures. The first is the natural logarithm of gross domestic product by region (NUTS II) in current prices in Greece (GDP). The second measure is the natural logarithm of per capita gross domestic product by region (NUTS II) in current prices in Greece (GDP.PI). The methodology we follow in order to match a firm with the GDP by region is quite simple. We track the zip code of the company address in which (out of the 13 regions of Greece (NUTS II)) is established and then match it with the GDP of the region. Note that the zip code is unique and appears only in a specific region and do not duplicated in
another.
A number of control variables identified in prior literature (Hsu et al. 2014; Powers et al. 2013 and Hanlon et al. 2012) that influence tax avoidance and tax evasion included in the study analysis. In the study egression (1), we include total assets (SIZE) because larger firms have resources and ability to avoid taxes, the ratio of net value of intangible assets to total assets (INTANG), the ratio of long and short debt to total assets (LEV), the ratio of net value of fixed assets to total assets (PPE), the profitability of the firm (ROA) since more profitable firms have mores incentives to avoid taxes, the tax losses carried forward (NOL) and the ratio of equity capitals to total assets (EQINC).
Finally we also include the ratio of cash and cash equivalents to total assets (CASH) and an indicator variable identifying firms with foreign operation (EXPORTS) because income from different countries present greater opportunities to avoid taxes. The control variables are defined in detail in Table 2. Last we control for industry fixed effects by included industry dummy variables (Industry) for thirteen out of fourteen industries in the study sample.
Dyreng et al. (2010 find evidence that the independent variables vary systematically across industries, and in order to control for potential serial correlation we included year dummy variables (Year) for year fixed effects. Note also that to mitigate the effect of extreme values, all continuous variables used in equation (1) are winsorized at the 1st and 99th percentiles.
Sample formation
The initial sample includes all firms that are available in the database of Infobank Hellastat (IBHS) covering the years from 2004 to 2014. The initial sample consists of 328,508 firm-years observations. For uniformity and comparability reasons, we require all firms of the study sample to prepare their individual financial statements at the end of the fiscal year (31/12) under the Greek Accounting Standards (Greek GAAP).
Consistent with prior research (Pesko, 2007; Lisowsky, 2009; Hanlon and Shevlin 2005; Zinn and Spengel 2012), banks, insurance companies and other financial institution (NACE rev. 1.1, Section J - Financial intermediation) were removed since different reporting requirements may apply. The sample is limited to firms with data in zip code (28,682 observations excluded) in order to retain all observations with sufficient data to calculate test variables and control variables. The dataset comprised data about gross domestic product of Greece from the Eurostat database.
Finally from the sample excluded firms without data on industry code (4,664 observations), the resulting final sample used in the main analysis consists of 246,867 firm-year observations during the period 2004 to 2014. As additional sensitivity analysis, we subsequently perform many additional sub-sample tests. Table 3 presents the sample selection process.
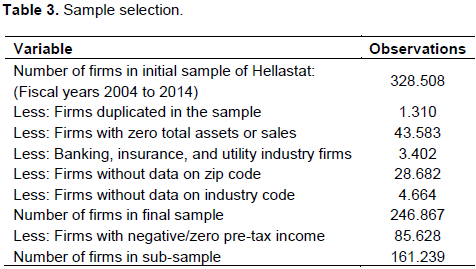
In order to avoid biases due to location or the industry sector, consideration was given both to the industry and the location of firms. Table 4 provides a description of the industry distribution for the companies included in the final sample. The industry distribution follows the Statistical Classification of Economic Activities of the European Community (NACE Rev. 1.1). The majority of firms in the sample (31.57%) belong to the “Wholesale and retail trade” industry (Nace code G) followed by the “Manufacture” sector with 21.18%, while the industry containing the fewer firms, with only 209 firm-years observations, is “Public administration and defence; compulsory social security” (Nace code L).
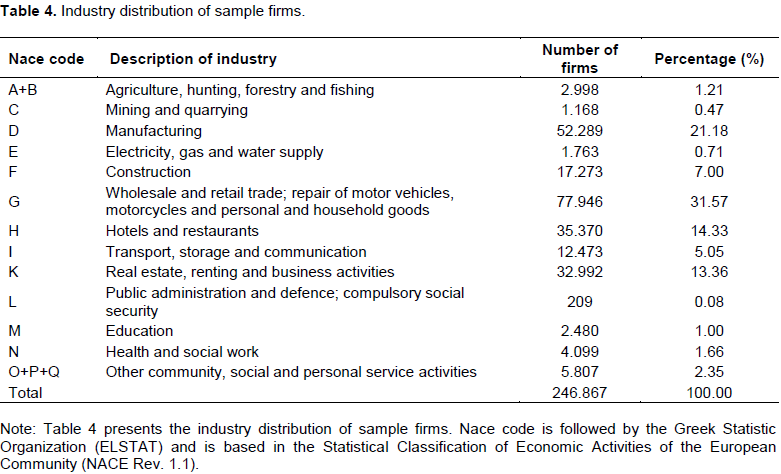
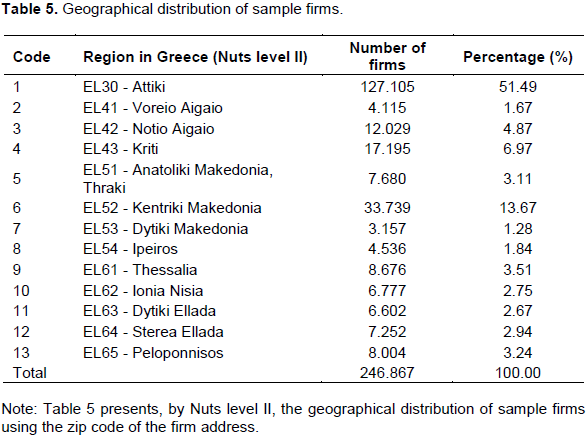
Table 5 presents the geographical distribution of the sample. The distribution is based on Eurostat Nuts (Nomenclature of Territorial Units for Statistics) level II. The study main purpose is to cover the whole geographical territory of Greece without exceptions by categorizing all firms to the thirteen (13) Greek regions according to the zip code and address. As expected, the majority of firms belong to the region of Attiki - EL30 (51.49%). The lowest number of firms located in the region of Dytiki Makedonia (EL52) with only 3,157 firm-years observations and approximately 287 firms per year.
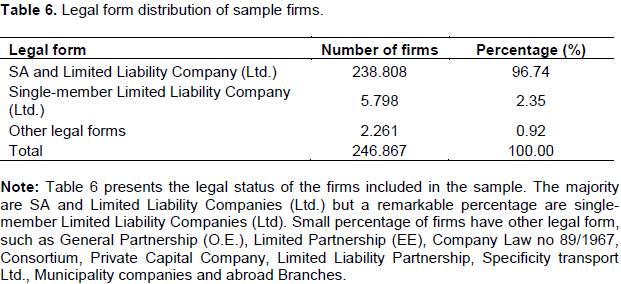
Table 6 presents the legal form distribution of sample firms. The majority of the firms that are obliged to prepare financial statements in Greece are SA
[1] and Limited Liability Companies (96.74%), and only a minor percentage are single-member Limited Liability Companies (2.35%).
Descriptive statistics
Table 7 summarizes the descriptive statistics of the variables used in equation (1). The full sample consists of 246,867 firm-year observations covering a period of 11 years (2004 to 2014). It is worth noting that the distribution of observations across the eleven years is approximately equal. Descriptive statistics are presented for three periods.
Column A presents descriptive statistics for the period 2004 to 2008 (representing the period before the economic crisis), Column B the period 2009 to 2014(representing the period during the economic crisis) and Column C for the whole period. The mean of the independent variables shows a significant change between the two periods (A and B).
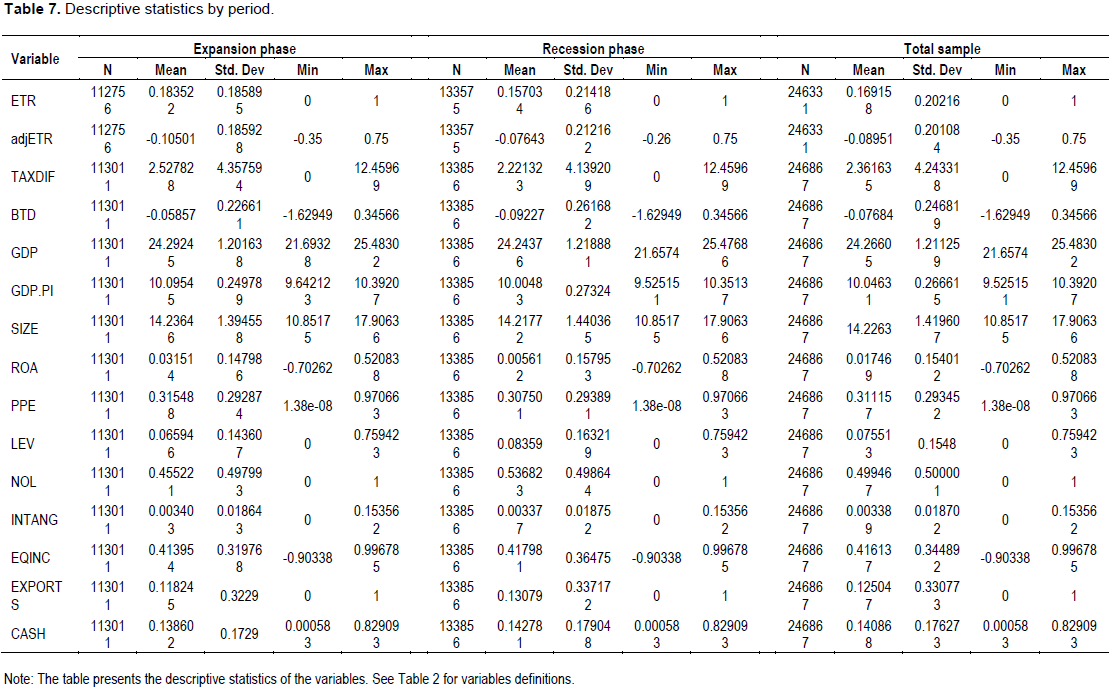
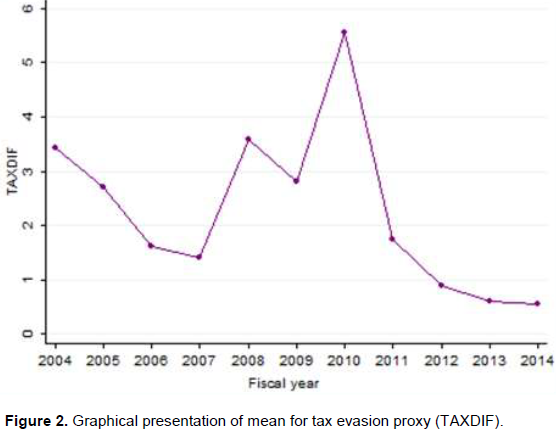
Especially, the mean of ETR fall from 0.18 to 0.16 showing that firms pay less taxes when the macroeconomic conditions are deteriorating. Also the mean of TAXDIFF, a variable that represents tax evasion size, fall from 2.53 to 2.22. This interesting result can be explained either as a “true” decline of tax evasion in Greece during the economic crisis, or as a weakness of the audit mechanism of Greece authorities to conduct actual detailed audits and calculate measures of tax evasion (Figure 1 to 3). Figure 1 indicate that ETR measure during the whole period from 2004 to 2014 is under the statutory tax rate in Greece and tax evasion proxy (TAXDIF) follows a declining trend from 2010 to 2014 (Figure 2). As far as the total book-tax differences (BTD), the mean in absolute value, increased during 2006 to 2011 (Figure 3). This indicates that the differences (gap) between book income and tax income increased approximately from 0.06 to 0.11 in absolute values.
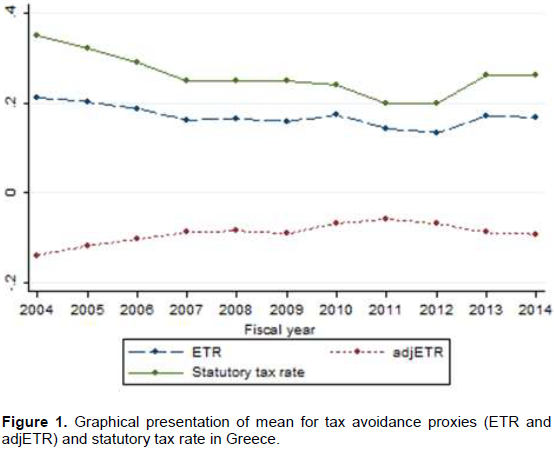
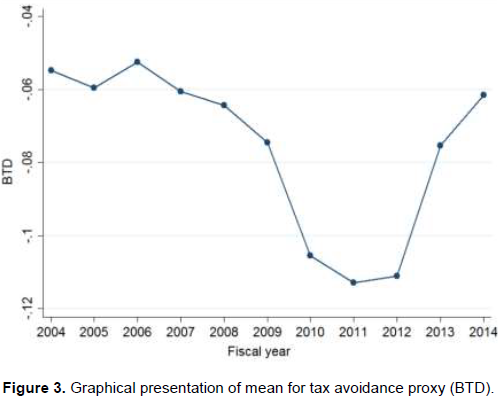
More interestingly, the negative sign of the differences means that the tax income is higher than the book income. Yet, according to the literature, an increase in the gap between book and tax income indicates an increase in tax avoidance magnitude as well. Finally, the intended variable adjETR that incorporates changes in the tax rate, increases from -0.11 (expansion phase) to -0.08 (recession phase).
Descriptive statistics reveal that the mean GDP and GDP.PI decreased from one period to the other. The mean GDP (GDP.PI) equals 24.29 (10.09) in the recession phase (2004 to 2008), and decreases to 24.24 (10.00) at the expansion phase (2009 to 2010).
Regarding the control variables, the majority of them (SIZE, ROA, PPE and EQINC) following the impact of economic crisis and decreased. It is worth mentioning the decline of ROA from 0.03 to 0.005, a variable that measure firm’s profitability. The mean LEV increased from 0.07 to 0.08, and EXPORTS from 0.12 to 0.13. This increase shows that the majority of firms in Greece turned to foreign markets, and burdened with new loans and obligations. Also, a major increase is on variable NOL which measure tax losses carried forward of a firm. The number of firms that appears tax losses carried forward increased from 0.46 to 0.54 showing that more than the half firms of the sample have losses
instead of profits during the crisis.
Additionally, the ratio of net value of intangible assets to total assets (INTANG) remains approximately constant (0.003). A notable fact is the fluctuation on the ratio of cash/cash equivalents to total assets (CASH). The mean increased from 0.139 to 0.143 showing that firms holds more cash in their treasury in an attempt to address possible exceptional liquidity needs.
For the sample of 246,867, Table 8 provides the results of a mean and median test, performed in order to evaluate if tax compliance (tax evasion and tax avoidance) in Greece before and during the economic crisis is statistical equal (H1 hypothesis). Variables of interest are ETR, adjETR and BTD as proxies of tax avoidance and TAXDIF as proxy of tax evasion. The two periods in which we perform the test is from 2004 to 2008 (period before the economic crisis) and from 2009 to 2014 as the period during the economic crisis. Table 8 column (1) presents the results of mean test (t-test) and column (2) of median-test (Mann-Whitney test). First cell in column (1) reports the test that the tax avoidance (ETR) before and during the economic crisis is equal cannot be accepted (t=32.85).
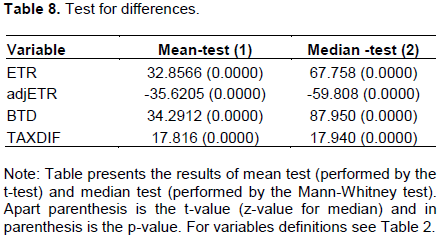
Similarly, in cell 2, 3 and 4 in column (1) the results show that the mean of adjETR, (t=-35.62) BTD (t=34.29) and TAXDIF (t=17.82) are not equal in two periods. These results are rather expected given the issues discussed earlier.
Additionally, column (2) shows the median comparison of the aforementioned four variables in the two periods. Findings indicate that the median during the two periods is not equal as the p-value for both tax avoidance measures and tax evasion measure is zero. These results suggest to reject hypothesis H1.
Correlation analysis
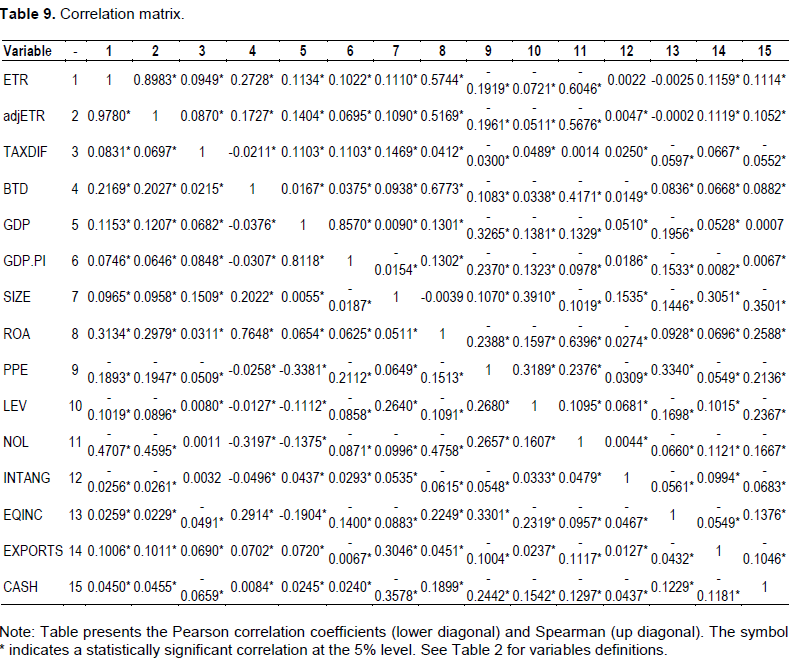
Table 9 present Pearson (lower diagonal) and Spearman (upper diagonal) correlations for all the variables used in equation (1).
The study primary concern here is the potential for harmful collinearity among the variables. Table 9 suggests that collinearity is not a problem in our data as the highest correlation coefficient among the independent variables is -0.47 (between ETR and NOL based on Pearson correlation) and -0.46 (between adjETR and NOL based again on Pearson correlation).
The variables of interest (GDP and GDP.PI) are significantly correlated at 5% level with ETR, adjETR, TAXDIF, BTD and with the majority of control variables (only the variables NOL and INTANG do not have a significant correlation at 5% level with TAXDIF). It is observed that GDP and GDP.PI have a positive and significant correlation with ETR, adjETR, TAXDIF and a negative and significant with BTD. The analysis provides initial support that GDP and/or GDP.PI are first approximation of tax conformity although regression analysis will evaluate the accuracy.
Findings shows that proxies used to measure tax avoidance of a firm (that is, ETR, adjETR and BTD) have the same signs of correlation with the control variables. In particular, tax avoidance measures are positively (negatively) and significantly related to firm size, profitability, equity capitals, foreign income and cash/cash equivalents (net value of fixed assets, total liabilities, tax losses carried forward and net value of intangible assets).
Additionally, TAXDIF exhibits a significant positive (negative) association with firm size, profitability, total liabilities and foreign income (net value of fixed assets, equity capitals and cash/cash equivalents). Correlation analysis shows that the signs on statistical significant variables (p<0.05) remain the same using either Pearson correlation method or Spearman (Table 9).
Multivariate analysis
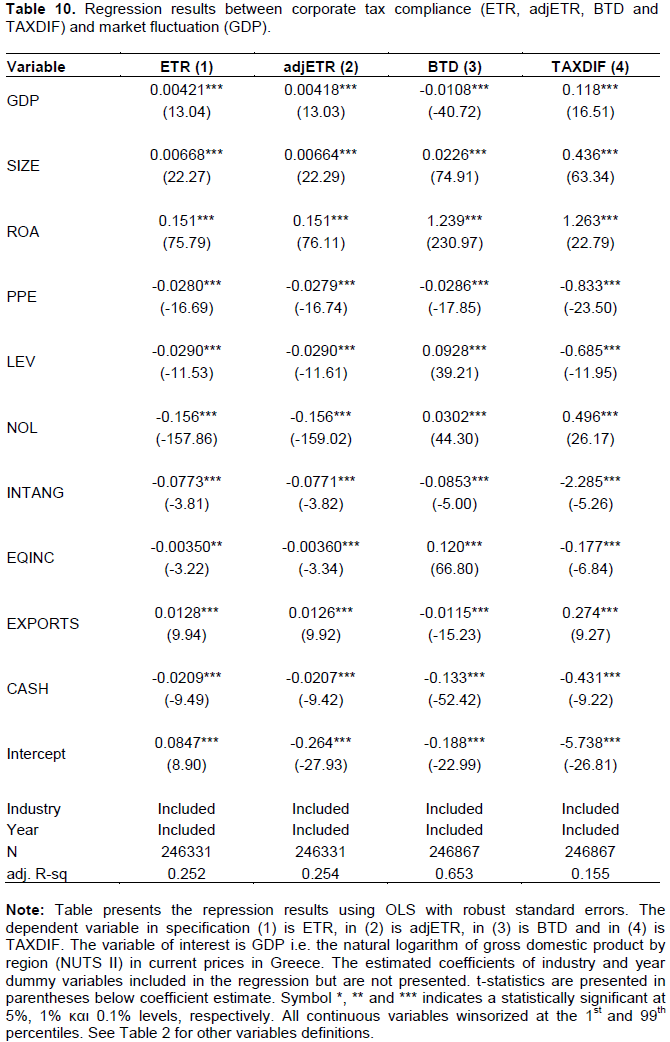
Table 10 presents the results for the study main regression analysis (test of hypothesis H2 and H3). The regressions include all firm-year observations of the final sample. Column (1) presents the regression results of equation (1) using dependent variable as the measure of tax avoidance, ETR and in column (2), (3) and (4) used as dependent variable for the measures of adjETR, BTD and TAXDIF, respectively.
Consistent with H2, we find a significantly positively relationship (at 0.1% level) between the tax avoidance (measured by ETR or adjETR) and the variable of interest (GDP) that represented gross domestic product by region (NUTS II) in Greece. This indicates that higher level of GDP (that is, improvement of macroeconomic conditions) is linked with lower level of tax avoidance. As explained earlier a higher (lower) level of ETR or adjETR connected with lower (higher) level of tax avoidance.
In column (3) using the other measure of tax avoidance (BTD), the regression results confirms the study first findings about the positive relation between GDP and tax avoidance. The coefficient on BTD is negative, and significant at 0.1% level (-0.011) showing that there is a positive relation between tax avoidance (as measured by BTD) and market fluctuation (as measured by GDP). Indicating that a big gap in book-tax income (that is, higher BTD) indicate higher level of tax avoidance.
The regression results in specification (column (4)) shows that the association between the variable of interest (GDP) and tax evasion (TAXDIF) is significantly positively (at 0.1% level) with a coefficient of 0.118, indicated in conflict with previous results that an increase in GDP indicate an increase in tax evasion.
In firm-level analysis in all regressions, the estimated coefficients of control variables are statistically significant at 0.1% level. Finally, the estimated coefficients of industry and year dummy variables included in the regressionare are not presented (Table 9).
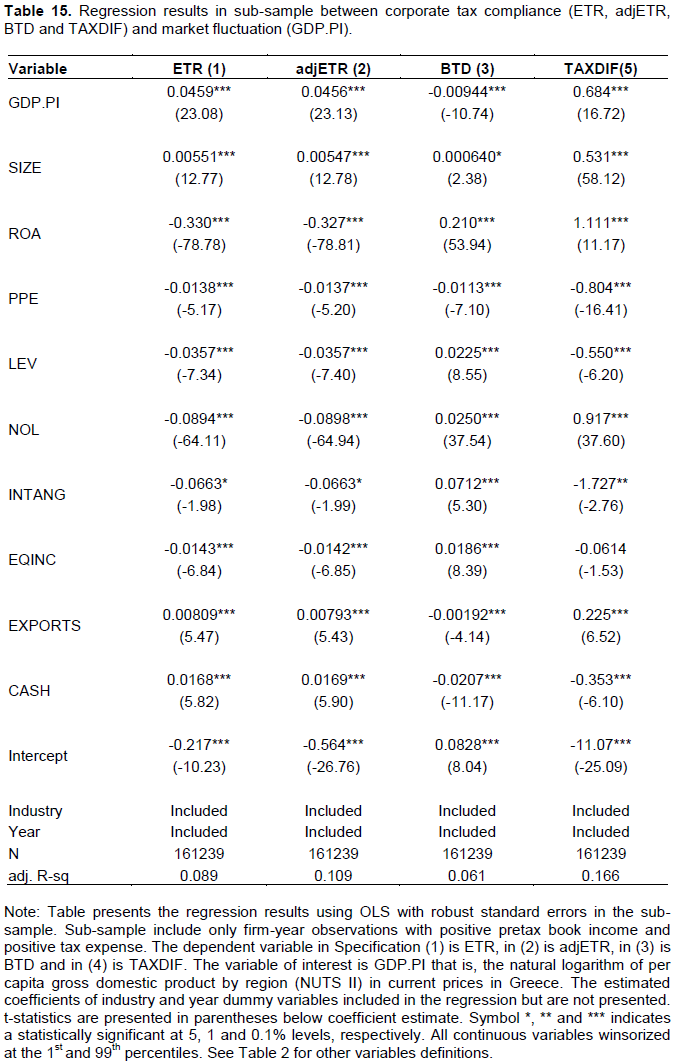
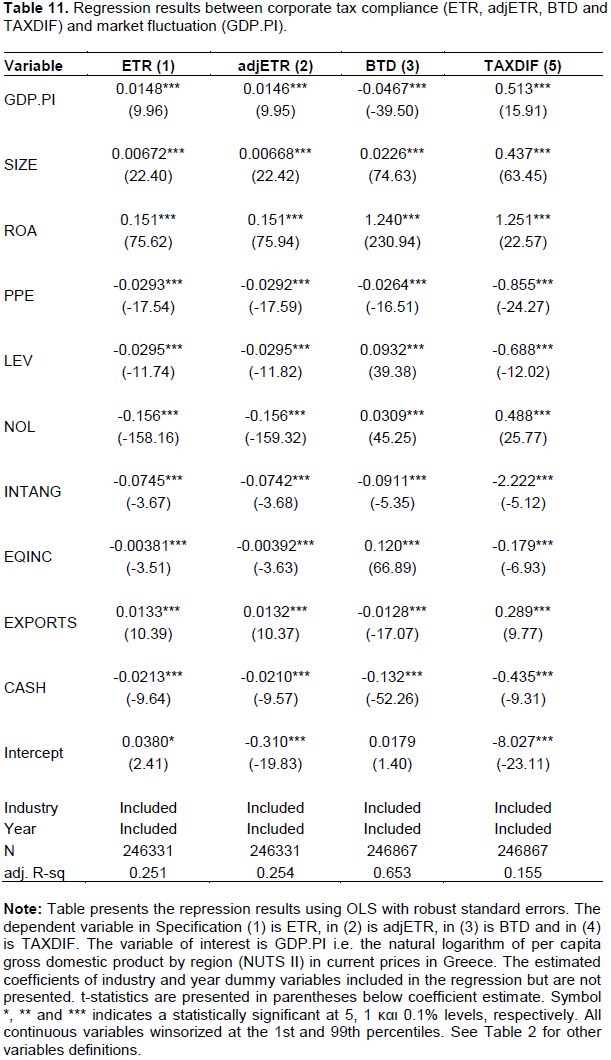
The next set of results, examines the relationship between the dependent variables (tax avoidance and tax evasion) and the per capita gross domestic product by region (NUTS II) in Greece. We therefore repeat the analyses aforementioned, included in the regression the variable GDP.PI instead of GDP. The control variables remain the same (Table 10). Results shows that the sings of coefficient to all the control variables do not change, and the adjusted R-squared remain the same with the equation in Table 10.
In conclusion, we found a strong and positive significant relation between the measures of ETR, adjETR, and TAXDIF with per capita gross domestic product by region (GDP.PI). Additionally, the estimate coefficient between BTD and GDP.PI is negative and statistically significant (-0.0467). These results confirm the study previous results, and force us to accept the H2 hypothesis that there is positive relation between GDP and tax avoidance, and a negative with tax evasion (reject H3 hypothesis).
Robustness tests
In order to determine the robustness of the core model a robustness test was performed. First, the regression model (1) was re-examined by changing the variables of interest. Instead of GDP that is, the natural logarithm of gross domestic product by region (NUTS II) in current prices in Greece, the growth rate of GDP by region (NUTS II) in current prices in Greece was used(G.GDP). Also, instead of GDP.PI that is the natural logarithm of per capita gross domestic product by region (NUTS II) in current prices, we use the growth rate of per capita GDP by region (NUTS II) in current prices in Greece (G.GDP.PI).
Furthermore, instead of winsorized all continuous variables at the 1st and 99th percentiles (as performed in equation 1), the extreme observations of all continuous variables at the 1st and 99th percentiles were deleted. As a result of these amendments, the final sample used in the robustness analysis is 194,117 firm-year observations during the period 2004 to 2014. These tests are motivated in order to check whether the study findings affected by its choice in the variables of interest. The results of the robustness analysis are largely consisted with those reported in Tables 10 and 11. The findings almost support the study core results that market fluctuation is a significant source of tax avoidance and tax evasion.
Tables 12 and 13 present the results of robustness analysis. When ETR and adjETR are the dependent variable (column (1) and (2), (Tables 12 and 13), the coefficients on firm size (SIZE), the profitability of a firm (ROA) and firms export orientation (EXPORTS) are significantly positive whereas the coefficients on the other control variables (LEV, PPE, NOL, EQINC, and CASH) are negative and significant (only the variable net value of intangible assets (INTANG), is insignificant). When BTD is the dependent variable (column (3), Table 12 and 13), the coefficient on net value of fixed assets to total assets (PPE), net value of the intangible assets to total assets (INTANG), firms with foreign operation (EXPORTS) and cash/cash equivalents (CASH) is negative and significant. Alongside the coefficient on SIZE, ROA, LEV, NOL and EQINC is positive and significant.
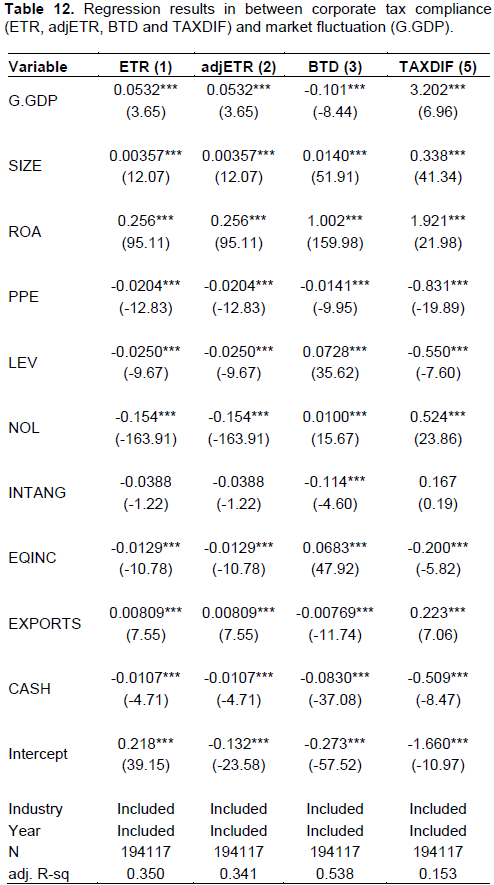
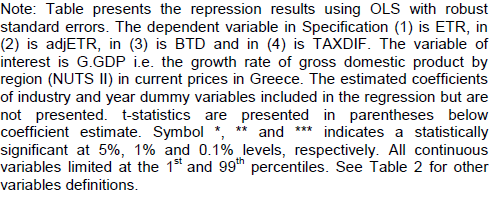
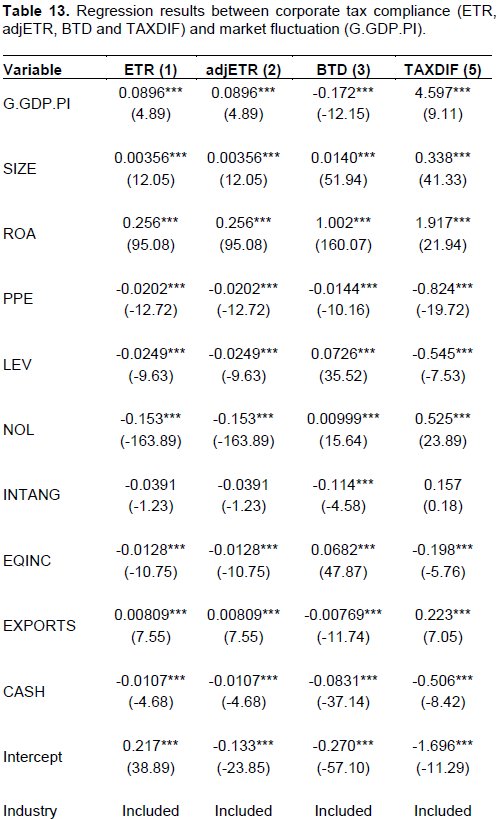
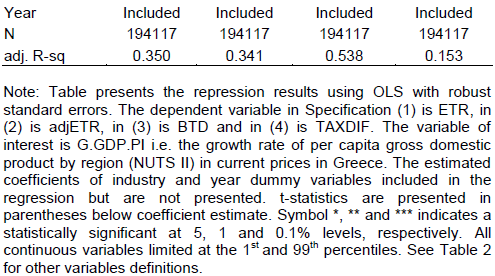
Finally, when TAXDIF is the dependent variable (column (4) on Tables 12 and 13), the coefficient on firm size (SIZE), the profitability of a firm (ROA), the tax losses carried forward (NOL) and firms with foreign operation (EXPORTS) is positive and significant while on net value of fixed assets (PPE), the ratio of long and short debt to total assets (LEV), equity capitals (EQINC) and cash/cash equivalents (CASH) is negative and significant. Like column (1) and (2) the net value of intangible assets (INTANG) is insignificant.
As far the variables of interest, on G.GDP and G.GDP.PI the signs remain unchanged and significant like previous results (ithat is, GDP and GDP.PI in table 10 and 11). The growth rate of GDP by region (G.GDP) is significant positive with ETR, adjETR, TAXDIFF and significant negative with BTD (so positive with tax avoidance). Additionally the growth rate of per capita GDP by region (G.GDP.PI) is significant positive with tax evasion measure (TAXDIFF) and tax avoidance measures (ETR and adjETR) and significant negative to tax avoidance measure BTD.
Finally, the results indicate that the explanatory power in terms of the adjusted R-squared of 0.35, 0.341, 0.538 and 0.153 is different from the corresponding adjusted R-squared of 0.252, 0.25, 0.653 and 0.155 in the main test reported in Table 10 and 11.
Therefore, it can be concluded that the modifications made to the variables of interest in the additional tests increased the overall fit in the depended variables ETR and adjETR.
Supplement analysis
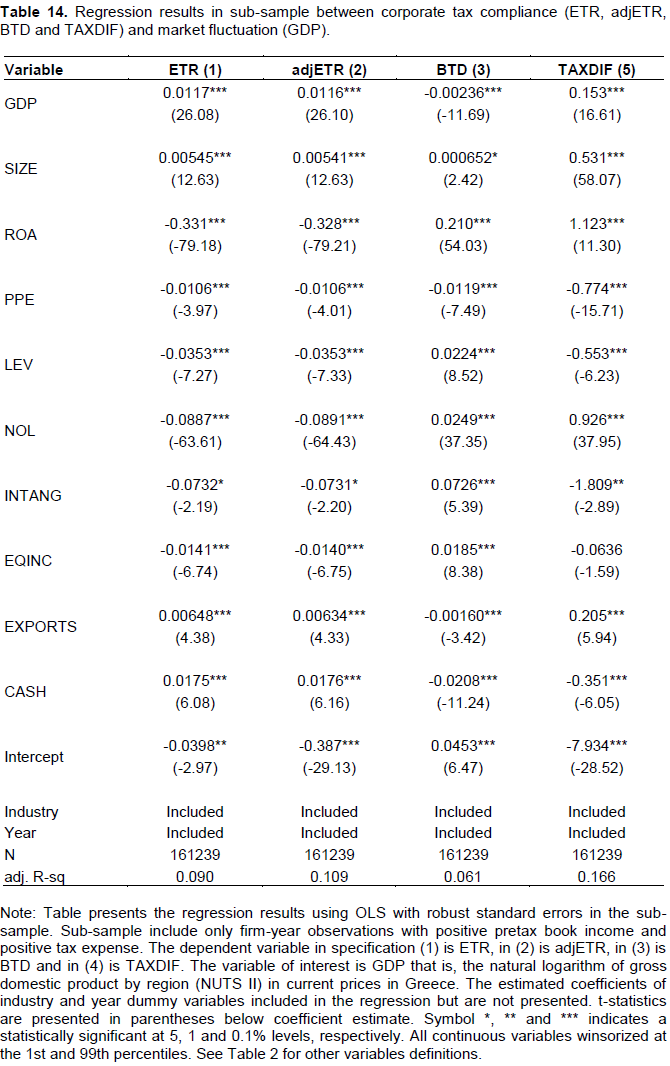
Prior literature such as Lisowsky et al (2010), has shown that loss firms have different financial and tax-reporting incentives. For this purpose, on further analysis employed an alternative sample in order to exclude firms with negative pretax book income and negative tax expense. As a result of this, the new sample (sub-sample) focus on firm-years observations during which tax avoidance/evasion is likely to be a priority.
The sub-sample consists of 161,239 firms-year observations during period of 2004 to 2014. As in previous sections, we want to examine the relation between tax avoidance measures (ETR, adjETR and BTD) and tax evasion measure (TAXDIF) with gross domestic product (GDP) by region (NUTS II) in Greece (or per capita GDP by region), but now only in firms with positive pretax book income. Looking at the results on table 14 and 15 the findings indicate that GDP and GDP.PI have a positive and significant relation with ETR, adjETR and TAXDIF, and a negative and significant with BTD. These significant confirm the results of our basic model that there is negative relationship between tax avoidance (positive with tax evasion) and gross domestic product by region (or per capita gross domestic product by region).
With regard to the control variables, the results (Tables 14 and 15) show that all control variables have a significant effect on tax avoidance measures (p<0.05) with the exception of EQINC in specification (4) (insignificant at 5% level). The coefficients estimated for these variables have the save sign like the coefficients in the core model (Tables 9 and 10) apart from ROA and CASH in column (1) (2) and INTANG in column (3). Showing that in firms with positive pre-tax book income a negative (positive) relation exist between profitability (cash/cash equivalents) and tax avoidance measures ETR/adjETR. Also in the sub-sample, the relation of BTD and net value of intangible assets is positive.
Finally, the adjusted R-squared for specifications (1), (2) and (3) decreased to 0.09, 0.11, 0.06, respectively, and only in specification (4) increased to 0.166 compared to these in core model (Tables 10 and 11).