Full Length Research Paper

ABSTRACT
Earnings announcement affects respective firms’ share prices based on their performances. Financial markets react to the bottom figure of the financial statements, which the authors believe include earnings management components. Similarly, earnings surprise also affects the market share. Therefore, they believe that there is a need for empirical analysis to understand the effects of earnings management and earnings surprises on firms’ market performance. The authors use a shorter 3-day window to measure the market-adjusted returns in contrast to the existing literature because they believe that the markets are efficient and will be able to mitigate the shocks in the longer run. A shorter window excludes the likely effects of other events that could affect the returns. They use the discretionary accrual modified model and real earnings management to proxy for earnings management. Earnings management is the management’s discretionary choice to manipulate earnings to achieve the financial targets. Earnings surprise is the difference between firms’ reported earnings and the Wall Street estimates, which affects individual firms’ stock prices around the earnings announcement and in the long run. We apply multivariate-pooled OLS heteroscedasticity-consistent standard error regressions. The study results suggest that the magnitude of earnings management has a positive and significant relationship with firms’ market-adjusted return. Similarly, good news also shows a positive relationship, and a significant negative relationship exists with bad news. This indicates that the earnings announcement does indeed have significant effects on firms’ market-adjusted returns.
Key words: Market adjusted returns, earnings management, analysts’ forecasts, earnings surprise, earnings announcement, accruals earnings management, real earnings management.
INTRODUCTION
Firms prepare their financial statements to provide the information to their end users including potential investors along with other capital market players. The incentive for firms to produce useful information is to protect those potential investors, who become one of their funds generating sources. They are also part of the capital market that influences the total market value of individual firms. For that purpose, Othman and Zeghal (2006) discuss the country policies on the investor protection to establish an economy that is sustainable and stable for the overall growth of the economy. Knowing these users influence the market value, firms have that added pressure of making up the numbers to present better view of their performance (Levitt, 1998). Schipper (1989) defines earnings management as the use of discretionary powers by firms to manage the earnings and dress up the numbers to show good performance.
Furthermore, Healy and Wahlen (1999) also define it as the use of discretionary choices to hide the actual financial performance and alter the financial reports to achieve the targets. Prior literature has provided the two techniques to used measure the earnings management. Jones (1991) introduces the Accruals Earnings Management (AEM) technique, which Kothari et al. (2005) modifies. Roychowdhury (2006) gives another technique that is, Real Earnings Management (REM). The authors use both techniques in their statistical analyses of this study.
Firms’ earnings announcements affect their share price returns. Potential investors require financial information to make any informed investing decision. First source of such information is the financial statements that firms prepare and issue that is, earnings announcement. Lyle et al. (2018) discuss the difference in the market reaction in relation to the timing of the earnings announcement. They believe that the firms, which announce the earnings outside of regular trading hours, give investors enough time to process the financial information before the trading begins again. Therefore, the announcements during the pre-open period have slower market reactions. Beaver et al. (2020) deal with the change in the market response towards the earnings announcement during different periods. They document increased response during 2001-2011 and over time. The authors analyze the effects of earnings quality on the market returns and differentiate the users of financial statements into potential investors and financial analysts.
This study focuses on the study of earnings quality and its effects on investors’ decision-making, which further explains the behavior of firms’ returns adjusted against the market. Prior literature mostly deals with the earnings surprises. Frankel et al. (2010) investigate the effects of missing forecasting targets on investors’ relations. They use analysts’ conference calls with managers as the proxy of investor relations and analyze the effects of small negative earnings surprises. A survey study was done to analyze the effects of missing market expectations on the investor relations and they find that the firms that miss expectations generally have longer call lengths. This relationship is the negative effect of missing market expectation on investors’ relations. No significant evidence was found to support Graham et al. (2005) that missing earnings benchmark results in severe economic implications.
While Keung et al. (2010) studied market reaction to the positive earnings surprises, and found that investors are skeptical when firms just meet or beat their earnings expectations and consider the existence of earnings management. Other studies discuss the use of earnings management to meet or beat analysts’ forecasts in case of Buy (Sell) rated firms (Abarbanell and Lehavy, 2003), and use of earnings management to achieve financial targets (Burgstahler and Eames, 2006). Abarbanell and Lehav (2003) explain how firms are motivated to meet or beat their targets when rated as a Buy and vice-versa in case of Sell. Burgstahler and Eames (2006) find that firms manage their earnings to meet or beat their earnings expectation to have zero or small positive earnings surprises to avoid consequences of earnings shocks.
The study is motivated by the prior literature and talks about the effects of earnings management on firms’ returns on the stock market adjusted by the capital market returns. We explain this phenomenon in two stages: the first stage explains how firms are motivated to manage their earnings to meet or beat earnings targets (Abarbanell and Lehavy, 2003) and the second stage talks about the reactions of the market to the quality of the earnings reports and earnings surprises thereof on firms’ stock returns adjusted against the market’s return. Existing literature mostly focuses on the relationship between small positive (negative) earnings surprises and the share price returns. Therefore, there is a need for an extension to the existing literature and our study contributes to the literature by including the share price returns of the firms adjusted against the markets, which minimizes the unwanted effects of extremely positive (negative) returns.
LITERATURE REVIEW
There is extant literature that deals with the earnings surprises and abnormal share returns (Keung et al., 2010), sales surprises and abnormal share returns (Shih, 2019), and meeting or beating earnings expectations (Abarbanell and Lehavy, 2003; Oler et al., 2018). Burgstahler and Eames (2006) discuss the use of earnings management to achieve zero or small positive earnings shocks or surprises, while Frankel et al. (2010) discuss the reactions of the capital markets to the small negative earnings surprises. There is a large literature, which also deals with the market reaction toward the earnings announcement (Lyle et al., 2018), and achieving the financial thresholds with earnings management (Ebaid, 2012; Mindak et al., 2016). Levitt (1998) says that firms manage their earnings to beat the market expectations to avoid any significant negative effects on their market share. This research focuses on the study of firms’ earnings management techniques and their effects on the market-adjusted returns (hereafter MAR) of individual firms. These MARs explain the actual performance of the firm relative to the market. Literature largely focuses on the alpha returns of firms, which measure the growth rate of firms’ market share-price returns. Like Fuller et al. (2002), they measure MAR, using the market-adjusted return model, as the difference between returns of individual firm and market index return over shorter 3-day window instead of 5-days period. The reasons to choose the shorter window are to exclude the likely effects of other events that could affect the returns and to assess the market reaction towards the earnings announcement and the earnings surprises thereof. We assume the markets are efficient and they will be able to mitigate the shocks in the longer run. This study also emphasizes the two techniques firms use to manage their earnings to reach their financial targets. These techniques include accruals earnings management and real earnings management (hereafter AEM and REM, respectively).
Existing literature has put a little emphasis on the shorter window returns instead has focused more on firms achieving their earnings targets or benchmarks (Barua et al., 2006; Mindak et al., 2016). The study is motivated by recent literature that talks about firms’ choices to meet or beat the thresholds (Abarbanell and Lehavy, 2003; Levitt, 1998) and whether the stock market or investors are skeptical about the small positive surprises and perceive them as the signal of earnings manipulation (Keung et al., 2010; Shih, 2019). Frankel et al. (2010) discuss the reactions of the capital markets on the small negative earnings surprises and Burgstahler and Eames (2006) discuss the use of earnings management to achieve zero or small positive earnings shocks or surprises. These studies discuss firms’ decisions to manage their earnings in order to achieve their targets. These targets include the financial analysts’ forecasts by focusing more on the abnormal returns and zero or small positive (negative) earnings surprises. The study emphasizes firms’ overall behavior or attitude towards their earnings management decision-making and its effect on the market reaction and firms’ MAR. This study investigates the effects of firms’ decisions to manage earnings upward (PEM) or downward (NEM) on their MAR.
Contributions of this study include the use of MAR with a 3-day window in days [-1 +1] and two 2-day windows ([0 +1] and [-1 0]) around the earnings announcement, to be discussed later in more detail. We also contribute to the literature by analyzing firms’ attitude towards earnings management and its effects on market reaction, that is, returns.
We incorporate earnings surprise (good and bad news) to check the sensitivity analysis and to compare our results with the works of Keung et al. (2010), Burgstahler and Eames (2006) and Graham et al. (2005). They also contribute by using the latest period 2006-2018 to analyze the new trend to observe the results of Keung et al. (2010).
The study results suggest that the magnitude of the earning management positively affects MAR, that is, firms’ return adjusted against the market return. However, their results are still consistent when they split their sample in the two categories: firms with PEM and NEM attitude. The firms with PEM attitude are those, which overstate their earnings to achieve the forecasting targets. While other categories belong to those firms, which understate their earnings. The study result proves that when firms apply the PEM approach to their earnings, their MAR increases; while the firms with NEM approach find their MAR decreasing. The results are robust with the inclusion of earnings surprise in our statistical analysis and provide similar evidence that the good (bad) news in terms of earnings surprises positively (negatively) affects the firms’ returns or growth.
The following section extends the review of relevant literature about the reactions from capital markets or potential investors to firms’ decision-making choices for financial targets including analysts’ forecasts. Section 3 develops the hypotheses of their research study. The data sampling, research methodology and variable definition are part of section 4. Sections 5 and 6 present the empirical data analyses including descriptive statistics, correlation, and multivariate regression results. Section 7 concludes this empirical study with a summary and limitations.
Hypotheses development
This study is motivated by existing literature and its primary focus is to analyze empirically the relationship between earnings management and firms’ market-adjusted return (MAR). Following Abarbanell and Lehavy (2003) and Burgstahler and Eames (2006), who discuss the use of earnings management to meet (zero earnings surprise) or beat (positive earnings surprise) the targets, the authors assume that the earnings surprise is the function of earnings management. Hence, they use these two proxies separately to analyze the effects on firms’ MAR. They posit that the market reaction is the function of firms’ discretionary choices to manage earnings and earnings surprises. They hypothesize that firms’ MAR increases when they amplify the earnings managements (H1) or when there is a positive earnings surprise that is, good news (H2 and H2a). The authors also analyze the effect of firms’ attitude that is, PEM and NEM, towards the earnings management on the MAR (H1a and H1b). They also hypothesize that the negative earnings surprise that is, bad news will affect the MAR negatively (H2b).
H1: Magnitude of earnings management is positively associated with firms’ MAR.
H1a: PEM affects firms’ MAR positively.
H1b: NEM affects firms’ MAR negatively.
H2: Magnitude of earnings surprises is positively associated with firms’ MAR.
H2a: Positive earnings surprise (that is, good news) has positive effect on firms’ MAR.
H2b: Negative earnings surprise (that is, bad news) has negative effect on firms’ MAR.
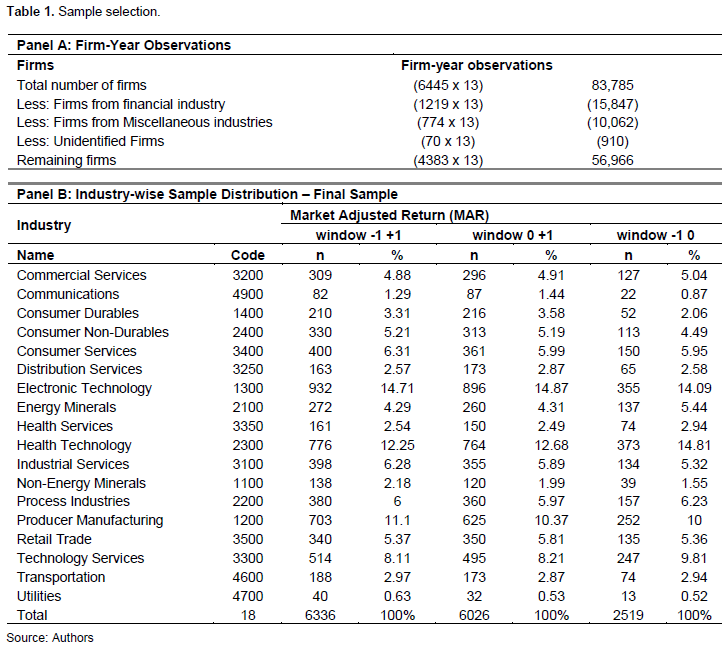
Data sample selection
The study data include non-AAER (Accounting and Auditing Enforcement Release) US market firms and have 83,785 firm-year observations spread over 13 years (6,445 firms each year) from 2006 to 2018. The authors obtained the data from the Factset Database based on Excel Connect including Factset Fundamentals, Factset Actuals, Factset Estimates, Reuters Global Fundamentals, Thomson Reuters DataStream, I/B/E/S, and Center for Research in Security Prices (CRSP). They extracted the data related to earnings and earnings forecasts from
I/B/E/S/ and market return data from CRSP.
Following Fama and French (1992) and Payne and Robb (2000), they exclude observations from financial firms because they use unique accounting procedures and principles, as well as the difficulty in estimating discretionary accruals.
Since there are insufficient data under unspecified and miscellaneous firms, these observations were excluded from the analysis.
Table 1 shows the final sample (unbalanced panel data) of firm-year observations under three different windows after removing the firms and the application of trimming criteria. They have one 3-day and two 2-day windows.
METHODOLOGY
The method used for the empirical analysis is in two- folds: the earnings management was measured at the first stage. At the second stage, the earnings management was applied as proxies to empirically test the study hypotheses. Prior studies often only use one measure of earnings management in their analysis. To provide robust results, both measures of the earnings management were used, AEM (Kothari et al., 2005) and REM (Roychowdhury, 2006). Kothari et al. (2005) used the performance-matching approach to estimate the earnings management, that is, equation (1). The discretionary accruals were estimated for each firm i in a year t (that is, residuals ) by regressing equation 1, cross-sectionally for the firms within the same 2-digit SIC code each year.
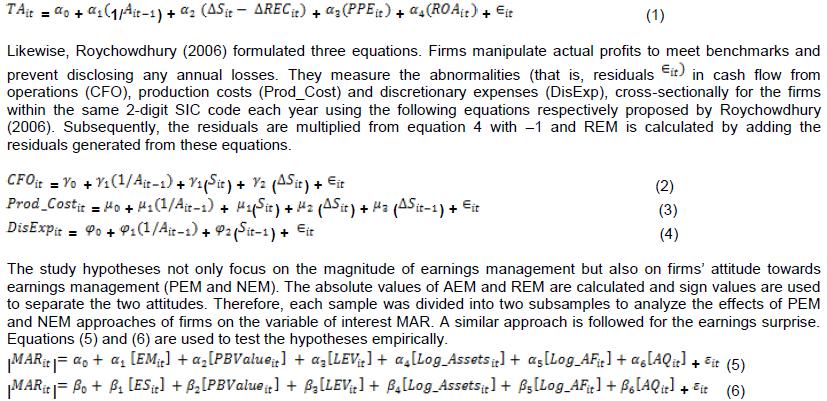
The earnings surprise is measured as the difference between the reported earnings and I/B/E/S mean earnings forecast 45-days before the firms announce their earnings instead of using the latest I/B/E/S mean earnings forecasts commonly used in literature. The latest earnings forecasts do not provide firms sufficient time to manage earnings to meet or beat their targets. These forecasts might also generate the number closer to reported earnings anyway after incorporating all the recent and private information. Therefore, it is assumed that a 45-day window provides firms with reasonable incentives and motivations to manage their earnings to meet or beat the targets to avoid earnings shocks (or bad news) and untoward market reactions.
The multivariate models explain how firms manage earnings (PEM or NEM) to achieve their financial targets. The financial targets of firms can include meeting or beating forecasts, issuing good news to market players to receive positive market reactions and consequently achieve positive MAR. Similar to Keung et al. (2010), the initial primary MAR period consists of 3-day window from one day prior to one day after the earnings announcement; but a market model was used to measure the cumulative abnormal return based on Fuller et al. (2002) and Rosen (2006) who used Brown and Warner (1985)’s market-adjusted return model. The market-adjusted return model is used to eliminate the data complexity of the market model. Two 2-day windows were used to check for the robustness of the results. One of these two windows consists of the day of earnings announcement and a day after [0 +1], and the second window consists of the day before the earnings announcement and the day of earnings announcement [-1 0].
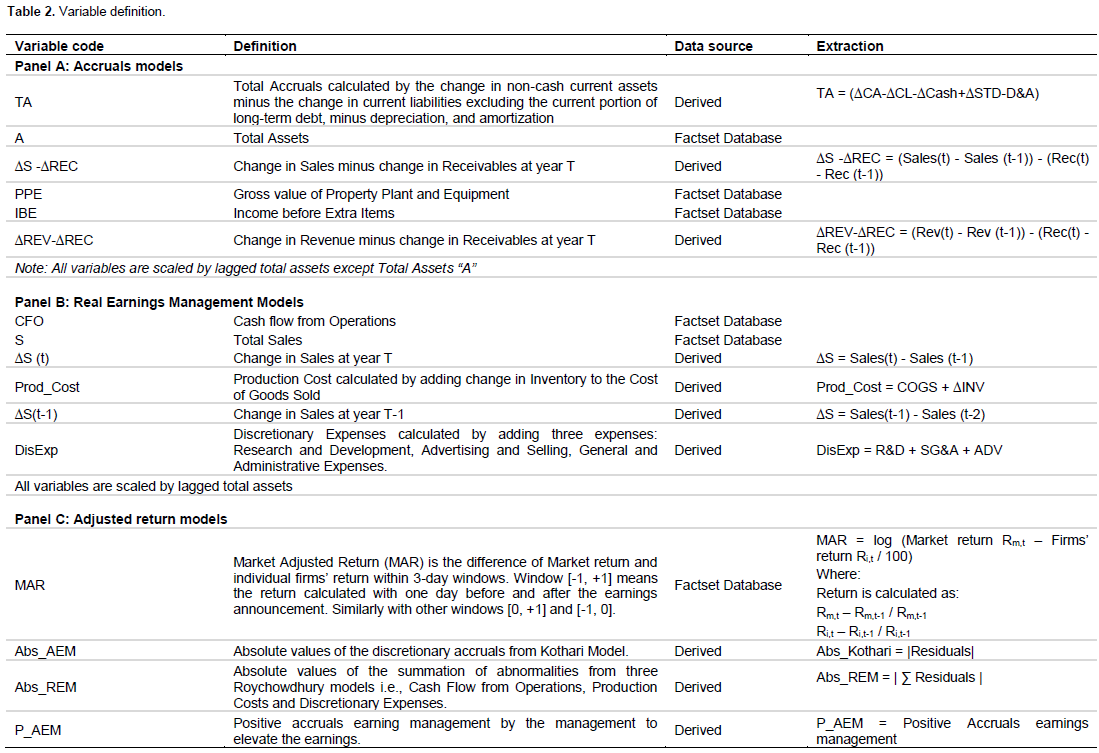
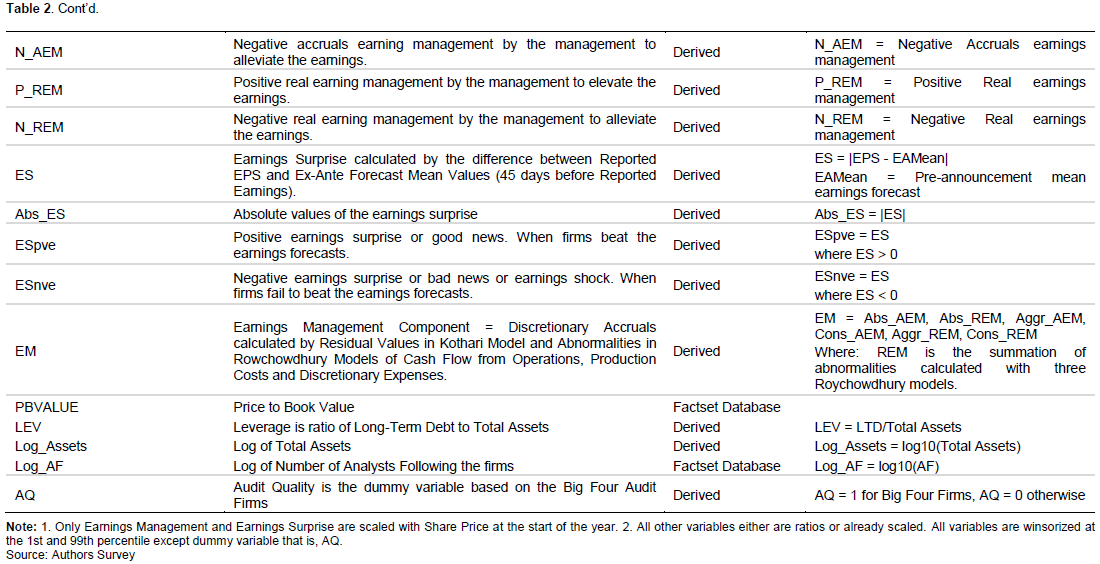
Given past studies in earnings management and earnings surprises, the models include several control variables. The variables Price-to-Book value and Analysts based on PBValue, Log_Assets and Log_AF, respectively explain varying degrees of the size of firms. Literature does not explicitly employ these variables on share price returns, but these variables have significant effect on earnings management and forecast accuracy (Embong and Hosseini, 2018; Richardson, 2000). PBValue is expected to have a positive sign with returns because it shows there is good news to market players if it is higher. Log_AF has positive relationship because bigger sized firms attract more followers (including all stakeholders), which generates public information for all analysts to produce a consensus forecast with low dispersion. One of the two incentives used to manage earnings is to avoid debt covenant violation (Richardson, 2000); therefore, Leverage (LEV) is included to control the firms’ leverage risk. Firms engage less with earnings management when they are audited by big four auditing firms, and it plays a role in their earnings quality (Clinch et al., 2012). Assuming market players react better when they have confidence in the quality of earnings report and its informational value. Thus we expect Audit Quality (AQ) to have positive sign with MAR. Table 2 describes the variables included in the empirical analyses.
Descriptive statistics and correlation
Descriptive statistics
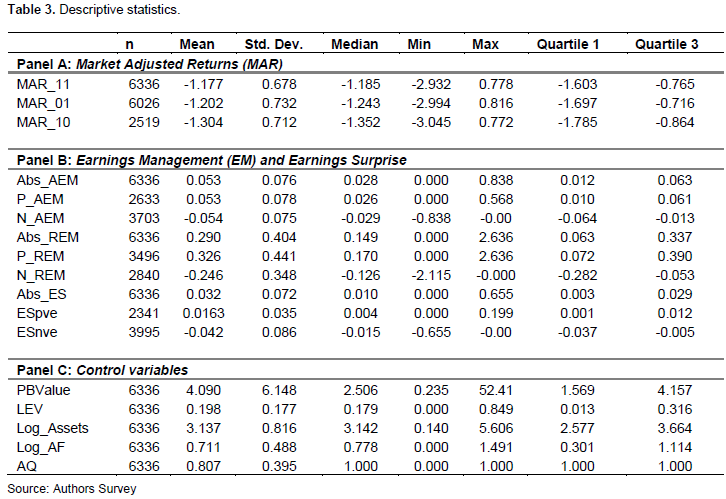
Table 3 shows the statistical summary of the variables employed in the empirical study. Panel A of Table 3 presents the descriptive statistics of the dependent variables. 3-day window is employed for MAR as the primary variable for the data analysis and the other two windows were used to support the primary results. The means of market-adjusted returns are consistently lower than the median across three windows, indicating the negatively skewed distribution.
Panel B of Table 3 reports the statistics for AEM and REM, where the mean and median values in AEM are lower than those of REM. Since the analyses include studying the magnitude of the earnings management and firms’ attitude towards these discretionary choices, there were absolute PEM and NEM. These values suggest that managers use REM more than AEM to manage their earnings.
Panel C of Table 3 shows the list of control variables. The majority of PBValue and LEV values is in the fourth quartile and lean towards the positive skewness. With the big four audit firms as their external auditors, AQ represents 80.70% of the sample firms in our report.
Correlation matrix
Table 4 presents the correlation among different variables used in the study. The aim is to assess the correlation between the explanatory variables; a low moderate correlation is anticipated because a strong correlation may imply unreliable and biased results. Since the analyses do not employ AEM and REM simultaneously, the inter-correlation was overlooked.
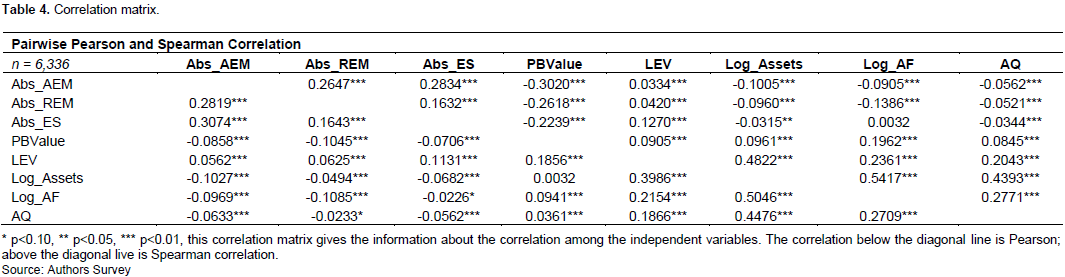
Statistically, no significant correlation was observed among the explanatory variables, suggesting that the predictors of the models do not have a multicollinearity problem, leading to the assumption that the regressions can generate reliable results. The authors use the variable inflation factor (VIF) technique for each of the regressions to assess the robustness of the bivariate inter-correlation or multicollinearity. The findings are identical and display no evidence of substantial multicollinearity among the explanatory variables, creating questions about the model's reliability.
RESULTS AND DISCUSSION
The empirical analysis is in two-fold: in the first stage, the earnings management was measured by using equations 1 to 4. In the second stage, the regressions were run on equations 5 and 6. The second stage of the empirical analysis is in two-fold, which includes the primary analysis with earnings management, and robustness check with earnings surprises.
Primary analysis
The primary analysis includes regression of the multivariate-pooled OLS heteroscedasticity-consistent standard errors and firm-specified panel regression on equation 5. The earnings management was used as the explanatory variable on the firms’ MAR with 3-day window starting from one day before the earnings announcement to one day after [-1, +1].
Table 5 includes the results of the primary analysis. The results are consistent with Burgstahler and Eames (2006), who believe that firms manage their earnings to avoid severe economic consequences. The magnitude of earnings management (AEM and REM) has significant positive relationship with MAR. This means that firms, which involve in these discretionary activities, benefit from the positive market reaction with better stock returns. The results are in line with hypothesis H1 of this study, which states that, the magnitude of the earnings management is positively associated with MAR.
Moreover, as described earlier, the study extends the literature and divides the firms based on their attitude towards the earnings management. H1a of the study says that firms with PEM attitude should realize better stock returns and vice versa in case of H1b for the NEM firms. The results consistently show that firms with PEM (P_AEM or P_REM) have positive relationship with their MAR (that is, 0.380* or 0.058**). While firms with NEM (N_AEM or N_REM) show a negative relationship (that is, -0.167 or -0.051). In cases of N_AEM and N_REM, they do not find significant coefficients, but they show negative signs, as expected and in line with hypothesis H1b. The control variables, except PBValue, show accurate signs of consistency with the prior literature and significant coefficients except AQ. Table 6 from firm-specified panel regression shows consistently similar results as in Table 5 from pooled OLS heteroscedasticity-consistent standard errors regression.
.png)
Robustness check
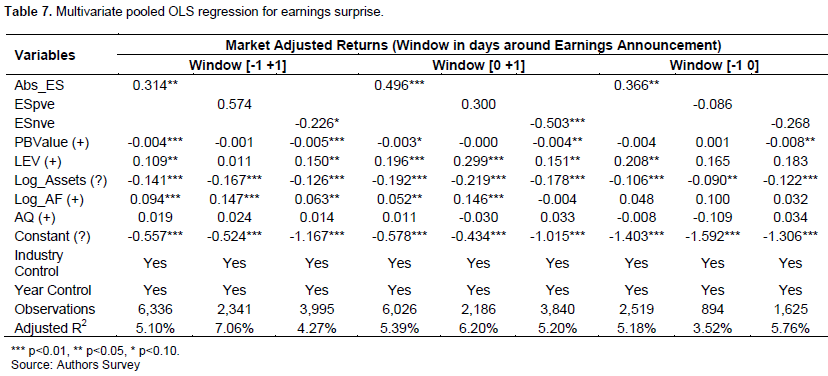
Similarly, the authors run multivariate-pooled OLS heteroscedasticity-consistent standard errors regression on equation 6. Earnings surprise is used as the explanatory variable on the firms’ MAR with all three short interval 3-day and 2-day windows [-1, +1], [0, +1] and [-1, 0], respectively.
Table 7 presents the results of hypotheses H2, H2a and H2b of this study. Hypothesis H2 states that the magnitude of the earnings surprises has positive relationship with firms’ MAR. Since magnitude uses the absolute values, that is, non–negative values, it is expected to have positive linear relationship. The results in Table 7 support hypothesis H2, which shows the significant positive coefficients of absolute values of earnings surprises (Abs_ES) with MAR across all three windows.
CONCLUSION AND LIMITATIONS
This study investigates the link between firms’ intentions to achieve financial targets and the stock returns. The study contributes to the extensive literature in using the stock returns adjusted against the market. The study also adds to the literature by using the 3 different short interval windows of the market-adjusted return. The researchers place little importance on the use of firms’ attitude (PEM and NEM) to analyze the effects on stock market performance. The researchers investigate earnings surprises (good news or bad news) separately. This study covers all these aspects of the literature and provides robust results. The results consistently support the study hypotheses and the existing literature from different empirical tests. They provide empirical evidence, using various analyses including multivariate pooled OLS heteroskedasticity-consistent standard error regression and firm-specific and industry-specific panel regression, that the firms use discretionary powers to manage their earnings to meet or beat the Wall Street Journal earnings expectations or forecasts. They do so to improve their stock market performance, that is, stock returns and avoid any severe consequences in the capital markets. The results are consistent with the earnings surprises, with good news or positive earnings surprises to improve the stock returns and vice versa in case of bad news or negative earnings surprises.
While this study contributes to the literature on a few fronts, there are limitations also. There is more work required on the use of PEM and NEM and earnings surprises. NEM attitude is not synonymous to bad news and this study does not differentiate between the NEM firms with good news and bad news. The other limitation of this study is the use of the US market only, which limits the sample size. This study includes 80.7% of firms audited by big four firms. This represents the number of big-sized firms limiting the wider application. Future research can help to overcome these limitations and expand the reach of the literature.
CONFLICT OF INTERESTS
The authors have not declared any conflicts of interests
REFERENCES
|
Abarbanell J, Lehavy R (2003). Can stock recommendations predict earnings management and analysts' earnings forecast errors? Journal of Accounting Research 41(1):1-31. |
|
|
Barua A, Legoria J, Moffitt JS (2006). Accruals management to achieve earnings benchmarks: A comparison of pre?managed profit and loss firms. Journal of Business Finance and Accounting 33(5?6):653-670. |
|
|
Beaver WH, McNichols MF, Wang ZZ (2020). Increased market response to earnings announcements in the 21st century: An Empirical Investigation. Journal of Accounting and Economics 69(1):101244. |
|
|
Brown SJ, Warner JB (1985). Using daily stock returns: The case of event studies. Journal of Financial Economics 14(1):3-31. |
|
|
Burgstahler D, Eames M (2006). Management of Earnings and Analysts' Forecasts to Achieve Zero and Small Positive Earnings Surprises. Journal of Business Finance and Accounting 33(5-6):633-652. |
|
|
Clinch G, Stokes D, Zhu T (2012). Audit quality and information asymmetry between traders. Accounting and Finance 52(3):743-765. |
|
|
Ebaid IES (2012). Earnings management to meet or beat earnings thresholds. African Journal of Economic and Management Studies 3(2):240-257. |
|
|
Embong Z, Hosseini L (2018). Analyst forecast accuracy and earnings management. Asian Journal of Accounting and Governance 10:97-108. |
|
|
Fama EF, French KR (1992). The cross?section of expected stock returns. The Journal of Finance 47(2):427-465. |
|
|
Frankel R, Mayew WJ, Sun Y (2010). Do pennies matter? Investor relations consequences of small negative earnings surprises. Review of Accounting Studies 15(1):220-242. |
|
|
Fuller K, Netter J, Stegemoller M (2002). What do returns to acquiring firms tell us? Evidence from firms that make many acquisitions. The Journal of Finance 57(4):1763-1793. |
|
|
Graham JR, Harvey CR, Rajgopal S (2005). The economic implications of corporate financial reporting. Journal of Accounting and Economics 40(1):3-73. |
|
|
Healy PM, Wahlen JM (1999). A review of the earnings management literature and its implications for standard setting. Accounting Horizons 13(4):365-383. |
|
|
Jone JJ (1991). Earnings management during import relief investigations. Journal of Accounting Research 29(2):193-228. |
|
|
Keung E, Lin Z, Shih M (2010). Does the stock market see a zero or small positive earnings surprise as a red flag? Journal of Accounting Research 48(1):105-136. |
|
|
Kothari SP, Leone AJ, Wasley CE (2005). Performance matched discretionary accrual measures. Journal of Accounting and Economics 39(1):163-197. |
|
|
Levitt Jr A (1998). The numbers game. The CPA Journal 68(12):14. |
|
|
Lyle MR, Rigsby C, Stephan A, Yohn TL (2018). The speed of the market reaction to pre-open versus post-close earnings announcements. Available at: |
|
|
Mindak MP, Sen PK, Stephan J (2016). Beating threshold targets with earnings management. Review of Accounting and Finance 15(2):198-221. |
|
|
Oler M, Pitre TJ, Song CJ (2018). Perverse market rewards for meeting or beating earnings expectations. Asia-Pacific Journal of Accounting and Economics 25(1-2):57-74. |
|
|
Othman HB, Zeghal D (2006). A study of earnings-management motives in the Anglo-American and Euro-Continental accounting models: The Canadian and French cases. The International Journal of Accounting 41(4):406-435. |
|
|
Payne JL, Robb SW (2000). Earnings management: The effect of ex ante earnings expectations. Journal of Accounting, Auditing and Finance 15(4):371-392. |
|
|
Richardson VJ (2000). Information Asymmetry and Earnings Management: Some Evidence. Review of Quantitative Finance and Accounting 15(4):325-347. |
|
|
Rosen RJ (2006). Merger momentum and investor sentiment: The stock market reaction to merger announcements. The Journal of Business 79(2):987-1017. |
|
|
Roychowdhury S (2006). Earnings management through real activities manipulation. Journal of Accounting and Economics 42(3):335-370. |
|
|
Schipper K (1989). Commentary on earnings management. Accounting Horizons 3(4):91-102. |
|
|
Shih M (2019). Investor skepticism and the incremental effects of small positive sales surprises. Journal of Economics and Business 106:105847. |
|
Copyright © 2024 Author(s) retain the copyright of this article.
This article is published under the terms of the Creative Commons Attribution License 4.0


