ABSTRACT
The stock market has continually been a source of economic development in most developing countries. This study examined the relationship between investors’ perception and profitability of quoted companies in Nigeria using secondary data obtained from the annual reports of forty (40) companies. The study employed the multiple regression techniques to analyze the relationship between investors’ perception (measured by dividend per share and earning per share) and profitability (measured by the return on equity). The results show that investors’ perception, when proxy by earnings per share, have a positive and significant impact on profitability. However, the study noted that investors’ perception, when measured by dividend per share, tend to have a positive effect on profitability, but it is statistically insignificant. By implication, investors and other stakeholders that are interested in investing in stocks can predict the earning capacity of listed firms in the stock market.
Key words: Investors, perception, listed companies, profitability, Nigeria.
Investment decision made by investors is a crucial issue that affects listed companies as a whole, and the stock market generally (Thair and Thair, 2016). Factors that affects investors’ perception and decisions ranges from financial to non-financial, economic and political, but specifically, investors are more concerned with the financial indicators also known as stock market indicators in the context of this study and they are; earnings per share, dividend per share, share price and price earnings ratio (Solomon et al., 2016; Adefila et al. 2004). Thus, this study used earnings per share and dividend per share as a measure of investors’ perception and used return on equity as a measure of profitability.
Most investors, existing and potential investors are less interested in investing in stocks due to factors like; prevalent corporate scandals, creative or cosmetic accounting, low returns from investment, global financial crisis, lack of transparency and inadequate supervision and high cost of transaction (Ikeobi, 2015). For instance, the total number of investors in Nigeria is over three million in a country whose population is over 150 million (Ikoku, 2015). So also, Investors lost about 6.9 trillion naira when the Nigerian stock Exchange had a major crash in the year 2008; as a result, investors are avoiding the Stock Exchange because they are still recuperating from the losses (Ayodeji and Adeniran, 2018). Therefore, the major aim of this study is to help potential investors in making the right economic decisions based on key stock market indicators identified in this study. Hence, the central objective of this study is to examine the relationship between investors’ perception and profitability. But specifically the sub objectives are; to ascertain if there is any relationship between return on equity and dividend per share of the selected quoted companies and to determine if there is any relationship between return on equity and earnings per share of the selected quoted companies.
Theoretical review
The bird in hand theory
The basic theory underpinning this study is the bird in hand theory. The bird in hand theory introduced by Lintner (1956) connotes “a bird in hand (that is, dividend) is preferable than two birds (that is, future capital gain) in the bush”. This theory also establishes the fact, that firm value is affected by dividend payout, and that most investor will prefer dividend to capital gain because it is less risky than capital gain which is receivable in the future (Amidu, 2007). The theory also suggests that firms paying a high dividend to its shareholder will have a higher market value because its shareholder will only require a minimal discounting rate.
Empirical review
It has been empirically proven that stock market indicators influence investors in making an economic decision regarding an entity. For instance, an empirical study on investors’ behavior on the Athens Stock Exchange indicates that investors base their investment decisions on stock market indicators and other non-financial variables (Merilkas et al., 2003). One of the essential stock market indicator investigated by extant studies is earnings per share (EPS) (Ikoku, 2015; Amidu, 2007). Equity stockholders use earnings per share to evaluate the financial performance and the imminent prospect of a company and also serve as a means of estimating the disposal value of shares (Solomon et al., 2016).
Asides EPS, another important stock market indicator that forms investors’ perception and investment decision, is dividend per share (DPS). Dividend payment can be referred to as the act of sharing profits to the shareholders of a company (Thafani and Abdullah, 2014). Dividend also connotes the part of the company’s net earnings that the directors recommend to be distributed to shareholders which is usually in proportion to their existing shareholding in the company (Pandey, 2005; Al- Malkawi, 2007; Bierman, 2012).
DPS indicates how profitable a company is and most importantly, indicates the financial health of an organization and dividend disbursement is one of the key factors that indicate that a good corporate governance structure (Jo and Pan, 2009; Miller and Modigliani, 1961). Dividend payment decisions have also been identified as one of the primary element of corporate finance policy (Uwuigbe et al., 2012; Baker et al., 2001).
Thus, the earning capacity and the profitability of listed companies are essential because dividends are paid out of profit earned by the organization and the non-payment of dividends indicates a poor financial status (Uwuigbe et al., 2012). As a matter of fact, profitability reveals the company’s capability to generate profit and adequate return on investment. Similarly, profit indicates the residual of income after the deductions of all expenses, but profitability determines the degree and sustainability of profit (Blakely-Gray, 2017; Gupta, 1989). Therefore, stock market indicators and profitability affects investors’ perception and investment decisions which invariably have an impact on the growth of the capital market (Ikoku, 2015; La Porta et al, 2012).
Apart from the aforementioned stock market indicators, other indicators investors commonly look out for are, price-earnings ratio, and share price. For instance, the result from the study conducted in Nairobi based on secondary data extracted from eleven companies listed on the Nairobi Stock exchange between years 2001 to 2005 indicate that EPS, Dividend yield, price earnings ratio and share price all a have a positive correlation with the changes in share price (Musyoki, 2011).
Furthermore, investors tend to relate profitability of stock or companies with the growth of share price, and most extant literature use share price as a measure of the listed stocks earning capacity and profitability. In particular, earliest studies on investors’ ratio and share price indicated a positive relationship (Asienwa, 1992; Brown, 1993).
Additionally, Menaje (2012) studied the impact of financial variables on the share price of listed companies in Philippines using EPS, Return on Assets (ROA) as proxies for financial variables. The result from the study shows that there is a strong positive relationship between EPS and share price, while there is a negative relationship between ROA and share price.
On the contrary, evidence from another study in Nigeria, based on secondary data extracted from 140 companies listed on the Nigeria stock exchange from 2005 to 2009 show that EPS does not have a prognostic influence on stock prices (Umar and Musa, 2013). One prominent question that investors tend to ask is the predictability capacity of these variables in indicating a viable stock and it is crystal clear that a single stock market indicator or investor ratio is not sufficient to have an influence on the profitability of firms except by combining it with other performance indicators (Gatuhi and Macharia, 2013).
In this study, the return on equity is used as a measure of profitability, and it has been defined as an indicator of profitability determined by dividing net income for the past 12 months by common stockholder equity (adjusted for stock splits) (Kennon, 2018). Investors use ROE as a measure of how a company is using its financial resources. A high return on equity indicates that the company is spending wisely and is likely profitable; a low return on equity indicates the opposite. As a result, high returns on equity lead to higher stock prices. ROE has been described as the topmost benchmarking tool for profitability because it indicates the true financial health of an organization.
This study is based on an Ex-post Factor research design, which emphasises the use of past data to predict the current behaviour of the selected variables. The population of the study for this research work comprises of all the quoted companies in the Nigeria stock exchange which according to the Nigeria stock exchange website, are two hundred (200) in numbers, however for the purpose of this study, and because of the sampling method adopted, only 40 companies will be used. The companies are Tripple GEE and Co PLC (TRIPPLEG NL), Trans-Nationwide Express PLC (TRANSEXP NL) Secure Electronic Technology PLC (NSLTECH NL), Skye Bank PLC (SKYEBANK NL), SCOA Nigeria PLC (SCOA NL), Transnational Corp of Nigeria PLC (TRANSCOR NL), Transcorp Hotels Plc (TRANSCOH NL), Tourist Co of Nigeria PLC (TOURIST NL), Total Nigeria PLC (TOTAL NL), Tantalizers PLC (TANTALIZ NL), Studio Press Nigeria PLC (STUDPRES NL), Sterling Bank PLC (STERLNBA NL), Stanbic IBTC Holdings PLC (STANBIC NL), Sovereign Trust Insurance PLC (SOVRENIN NL), Smart Products Nigeria PLC (SMURFIT NL), McNichols Consolidated PLC (MCNICHOL NL), May & Baker Nigeria PLC (MAYBAKER NL), AXA Mansard Insurance PLC (MANSARD NL), Northern Nigeria Flour Mills PLC (NNFM NL), NPF Microfinance Bank PLC (NPFMCRFB NL), Nigeria Enamelware Co PLC (ENAMELWA NL), Niger Insurance PLC (NIGERINS NL), Nestle Nigeria PLC (NESTLE NL), NEM Insurance PLC (NEM NL), Neimeth International Pharmaceuticals PLC (NEIMETH NL), NCR Nigeria PLC (NCR NL), Nigerian Breweries PLC (NB NL), Nigerian Aviation Handling Co PLC (NAHCO NL), Mutual Benefits Assurance PLC (MBENEFIT NL), Pharma-Deko PLC, Omoluabi Mortgage Bank PLC, Okomu Oil Palm PLC (OKOMUOIL NL), Oando PLC (OANDO NL), Multiverse Mining and Exploration Plc (MULTIVER NL), Regency Alliance Insurance Co PLC (REGALINS NL), Red Star Express PLC (REDSTARE NL), Arbico PLC (ARBICO NL), PZ Cussons Nigeria PLC (PZ NL), Newrest Asl Nigeria Plc (AIRSERVI NL), AIICO Insurance PLC (AIICO NL) and MRS Nigeria PLC (MRSOIL NL). Furthermore, the analysis for this study is based on secondary data obtained from the financial statement of the companies understudied; the data obtained includes earnings per share, dividend per share, and return on equity. The statistical analysis for this study was done using regression analysis and correlation. Also, the sampling method adopted was purposive sampling technique.
Model specification for regression analysis
The model specification used in this study is based on the description of the relationship between the dependent and independent variables of this research work.
Y = f(Xi) (1)
Where Y = Dependent variable which is profitability (Return on Equity); Xi = Independent Variable which is Investors Perception;But,
Xi = X1, X2,
Where X1 = dividend per share; X2 = earnings per share.
The multiple linear regression model for this study is defined as:
Y= β0 + β1x1+β2x2 + e (2)
Here, Y = the dependent variable which was represented by the profitability of listed company using Return on Equity as a proxy; Xi= independent variable, which was represented by the Stock Market Indicators of the selected quoted companies used dividend per share and earnings per share as proxies. β0 represents the constant. β1 is the regression coefficient of regression. e = error term.
By substituting the above into the multiple linear regression models above, we have:
Y= β0 + β1DPS+ β1EPS +e (3)
Statistical analysis of the effect of investor perception on the profitability of the selected quoted companies will be examined in this segment. Analysis of the trend of the variables will be examined first to describe the characteristics of the variables, followed by the correlation of the variables, the VIF, and tolerance analysis to check multi-collinearity of the model will also be presented before presentation and discussion of the regression result.
Descriptive statistics
To show the descriptive statistics for each of the variables; return on equity (ROE), dividend per share (DPS) and earnings per share (EPS), the mean, standard deviation, minimum, maximum, skewness and Kurtosis values will be presented. It will help in understanding the measures of central tendency, measures of variances associated with the variables of the study, and the normality of the data used in the study.
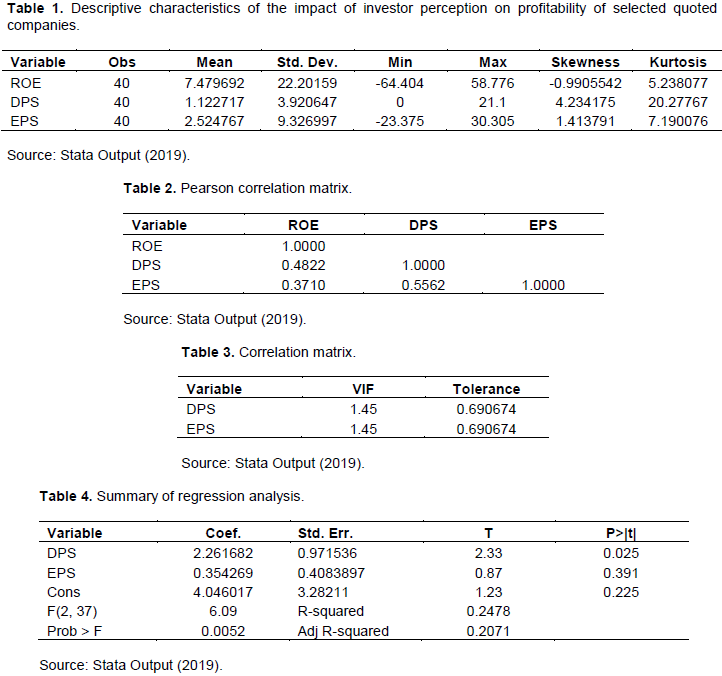
Table 1 demonstrates that the mean value of return on equity of all the companies understudied is 7.479692 with a range of -64.404 to 58.776 while the level of dispersion is 22.20159. By this, it means the average profitability of selected quoted companies in Nigeria is 7.479692 to 58.776, and the deviation from both sides of the mean is 22.20159. This implies that the dispersion of the data from the mean is too wide because the standard deviation is higher than the mean value. The peak of return on equity is indicated by the kurtosis value of 5.238077, suggesting that most of the values are smaller than the mean, which implies that the data meet a normal distribution assumption. The coefficient of Skewness of -0.9905542 implies that the data is negatively skewed, which means most of the data are on the left hand-side of the normal curve.
The highest of dividend per share is 21.1 with the mean of 1.122717 and standard deviation of 3.920647. The zero value recorded indicates that in a certain year the selected quoted companies declare zero dividends for every ordinary share outstanding. Within the period of the study, the earnings per share range from -23.375 to 30.305 with a mean value of 2.524767 and the data deviate from both sides of the mean by 9.326997. The peak of investors’ perception is indicated by the kurtosis value of 20.27767 and 7.190076 for dividend per share and earnings per share, respectively. The coefficient of Skewness of investor’s perception is 4.234175 and 1.413791, which implies that dividend per share and earnings per share respectively have long right tails.
Correlation matrix
The relationship between the dependent variable and independent variables are presented in Table 2. The relationship between the independent variables is also shown by the table. The values were extracted from the Pearson correlation of two-tailed significance carried out with Stata. The results in Table 2 show the degree of association between profitability as represented by return on equity (ROE) and investors’ perception, which was represented with dividend per share and earnings per share. There is a positive relationship between the profitability of selected quoted companies and investor perception, as reflected in Table 2. The relationship between return on equity and dividend per share from the correlation coefficient is 0.4822. This relationship implies that as the return on equity increases the dividend per share of the sample firms will also increase. The relationship between return on equity and earnings per share from the correlation coefficient is 0.3710. This relationship implies that as the return on equity increases the earnings per share of the sample, firms will also increase.
Multicollinearity test
The Variance Inflation Factor (VIF) and tolerance value are reasonable measures of availability of multi-collinearity between the independent variables. Variance inflation factor and tolerance value are used for the investigation of the existence of multi-collinearity between dividend per share and earnings per share, which are the independent variables. The result of the multi-collinearity check is presented in Table 3. The table shows that the VIF of the two variables were consistently smaller than 10, which is an indication of the complete absence of multicollinearity. This implies that the study model that is fitted with the two independent variables is appropriate. Also, the tolerance values further substantiate the fact that there is a complete absence of multi-collinearity between dividend per share and earnings per share since the tolerance values are consistently smaller than 1.
Multiple regression analysis
The results of the multiple regression analysis which examine the effect of investor perception on the profitability of selected quoted companies in Nigeria were discussed. The summary of the multiple regression analysis results is presented in Table 4.
Cumulatively, as shown in Table 4, the coefficient of determination for the regression is 0.2478 as depicted by the R2 which implies that about 24.78% of the systematic variation of the profitability of selected quoted companies in Nigeria is accounted for by the investor perception.
The F-statistic of 6.09 is greater than the F-tabulated (3.25192385), this shows that the model of the study is well fitted, and this is further established by the significant value of 0.0052 which is smaller to 0.05 and it shows that the cumulative effect of the investor perception measured with (dividend per share and earnings per share) was significant at 0.05% to profitability of selected quoted companies, which can be inferred that impact of investor perception on profitability of selected quoted companies.
Table 4 reveals that the t-value for dividend per share (DPS) is 2.33 with a coefficient value of 2.261682 with a P-value of 0.025 while the t-tabulated is 2.02107539. This implies that dividend per share is not statistically significant to the profitability of selected quoted companies in Nigeria.
Earnings per share as depicted in Table 4 shows t-value of 0.87 and a coefficient value of 0.354269 with a P-value of 0.391 while the t-tabulated is 2.02107539. This signifies that earning per share has a significant impact on the profitability of selected quoted companies in Nigeria. This implies that for every one percent increase in earnings per share, the profitability of selected quoted companies will increase by 35.43%.
The findings of this research work shows that the stock market indicators used to represent investors perception in this research work have significant joint relationship with profitability of the selected quoted companies, but when individual significance relationship was examined, the significance was visible between earning per share and profitability of selected quoted companies in Nigeria which the analysis reveals that the relationship between dividend per share and profitability of selected quoted companies in Nigeria was not statistically significant. The findings show that making a profit from investment in the capital market requires various financial indicators. Therefore, this research work established that the relationship between profitability and stock market indicators can be fully understood by combining more than one financial indicator. This is because, total dependence on one financial indicator can lead to a wrong conclusion, and this was why this study used dividend per share and earnings per share as proxies for investor perception.
CONCLUSION AND RECOMMENDATIONS
The study concludes that investors need more than one stock market indicator to identify a viable stock when making investment decisions. Furthermore, the statistical analysis confirms that there is significant relationship between Investors’ perception and profitability, but this relationship was more conspicuous when collinearity test and regression test were combined to analyse the other indicator of investors’ perception (earnings per share and return on equity). Therefore, the study recommends that researchers must use more than one statistical method when studying the relationship between investors’ perception and profitability in order to fully understand the strength and the direction of relationship between investors’ perception and profitability, so as not to arrive at a wrong conclusion.
The authors have not declared any conflict of interests.
REFERENCES
|
Adefila JJ, Oladipo JA, Adeoti JO (2004). The effect of dividend policy on the market price of shares in Nigeria: Case study of fifteen quoted companies. International Journal of Accounting 2(1):82-91.
|
|
|
|
Ayodeji EA, Adediran AG (2018). Historical development, regulation and sanitization of Nigeria's capital market. Journal of Advances in Social Science and Humanities 4(11):379-395.
|
|
|
|
|
Al-Malkawi HA (2007). Determinants of corporate dividend policy in Jordan: an application of the Tobit model. Journal of Economic and Administrative Sciences 23(2):44-70.
Crossref
|
|
|
|
|
Amidu M (2007). How does dividend policy affect performance of the firm on Ghana stock Exchange. Investment Management and Financial Innovations 4(2):103-112.
|
|
|
|
|
Asienwa TK (1992). The relationship between investment ratios and share performance of companies quoted on the Nairobi Stock Exchange. Unpublished MBA Project, University of Nairobi.
|
|
|
|
|
Baker HK, Veit ET, Powell GE (2001). Factors influencing dividend policy decisions of Nasdaq firms. Financial Review 36(3):19-38.
Crossref
|
|
|
|
|
Bierman Jr H (2012). Increasing shareholder value: distribution policy, a corporate finance challenge. Springer Science and Business Media.
|
|
|
|
|
Blakely-Gray R (2017). Profit versus profitability Available at:
View
|
|
|
|
|
Brown LD (1993). Earnings forecasting research: its implications for capital markets research. International Journal of Forecasting 9(3):295-320.
Crossref
|
|
|
|
|
Gatuhi SK, Macharia PI (2013). Effect of Financial Performance Indicators on Market Price of Shares in Commercial Banks of Kenya. International Journal of Management and Business Studies 3(3):57-60.
|
|
|
|
|
Gupta M (1989). Profitability Analysis. An Empirical Approach. Jaipur: Pointer publisher.
|
|
|
|
|
Ikeobi NR (2015). Challenges faced by individual investors in the Nigerian capital market. European Journal of Business and Management 7(23):36-43.
|
|
|
|
|
Ikoku AE (2015). Is the stock market a leading indicator of economic activity in Nigeria? CBN Journal of Applied Statistics 1(1):17-38.
|
|
|
|
|
Jo H, Pan C (2009). Why are firms with entrenched managers more likely to pay dividends? Review of Accounting and Finance 8(1):87-116.
Crossref
|
|
|
|
|
Kennon J (2018) Return on Equity & Income statement analysis. Available at:
View
|
|
|
|
|
La Porta R, Lopez-de-Silanes F, Shleifer A, Vishny R (2000). Investor protection and corporate governance. Journal of Financial Economics 58(1-2):3-27.
Crossref
|
|
|
|
|
Lintner J (1956). Dividends, Earnings, Leverage, Stock prices and the Supply of Capital to Corporations. The Review of Economics and Statistics 44:243-269.
Crossref
|
|
|
|
|
Menaje PM (2012). Impact of Selected Financial Variables on Share Price of Publicly Listed Firms in the Philippines. American International Journal of Contemporary Research 2(9):98-104.
|
|
|
|
|
Merilkas A, Prasad D (2003). Factors influencing Greek investor behavior on the Athens stock exchange. Journal of Business 66(1):1-20.
|
|
|
|
|
Musyoki D (2011). Changes in share prices as a predictor of earnings for financial firms listed in Nairobi Securities Exchange. International Journal of Business and Public Management 2(2):1-11.
|
|
|
|
|
Miller M, Modigliani F (1961). Dividend policy, growth, and the valuation of shares pp. 411-433.
Crossref
|
|
|
|
|
Pandey MI (2005). Financial Management (9th ed.). New Delhi: Vikas publishing House Pvt Limited.
|
|
|
|
|
Solomon AZ, Muturi W, Memba FS (2016). Significance of accounting information on equity share investment in Nigerian listed companies. Research Journal of Finance and Accounting 7(2):166-175
|
|
|
|
|
Thafani F, Abdullah M (2014). Impact of dividend payout on corporate profitability: evident from Colombo stock exchange. Advances in Economics and Business Management 1(1):27-33.
|
|
|
|
|
Thair A, Thair K (2016). Financial Analysis and Investment Decision-Empirical Study on the Jordanian Stock Market 2011-2015. International Journal of Economic Research 14:18.
|
|
|
|
|
Umar MS, Musa TB (2013). Stock prices and firm earning per share in Nigeria. Journal of Research in National Development 11(2):21-33.
|
|
|
|
|
Uwuigbe U, Jafaru J, Ajayi A (2012). Dividend policy and firm performance: A study of listed firms in Nigeria. Accounting and Management Information Systems 11(3):442-454.
|
|