Full Length Research Paper

ABSTRACT
In modern industrial sectors, the margins for companies’ development constantly shrink, urging a rise in R and D and various sections’ expenditures. Throughout this phase, the role of innovative firms has submerged, especially via the knowledge-based entrepreneurship. Knowledge-based entrepreneurship can potentially benefit companies performing in the high-tech sectors, in terms of economic performance and financial management. Research’s main focus shifts to Greek high-tech industrial market and more specifically to innovative firms and companies seeking to capitalize various economic factors to boost economic performance. For this purpose, sample was collected from high-tech innovative firms during 2009-2012, regarding economic and demographic stats, as well as information about their staff members. Methodological framework of the paper consists of cluster analysis, likelihood estimation methodology and regression analysis. As a result, the research concluded that, staff members of high-tech companies with high levels of technical knowledge led to increased financial and economic performance, in comparison to companies in the same industrial sector, employing less technically qualified staff.
Key words: Economic factors, innovation, knowledge-based entrepreneurship, economic growth, cluster analysis, regression analysis.
INTRODUCTION
The concept of entrepreneurship is strongly heterogeneous, due to the many different processes involved in firms' creation. Creation factors vary by firms because of the different founders' motivations, the different environments and the different inputs and outputs. This results in the heterogeneity of entrepreneurship, which is difficult to explain by embracing a general model. A classification of firms according to their specific characteristics, indicating certain models of entrepreneurial behavior, is required.
As part of this research, firms have been classified in various high-tech sectors based on their characteristics linked to the phenomenon of knowledge-based entrepreneurship (KBE). Although these firms are technology-related and most firms are expected to have high knowledge reserves and significant innovation performance, this is not the case for the majority of firms the authors would expect, because a large set of firms is characterized by relatively low-intensity innovation and knowledge. Therefore, the fact that a firm can operate in a high-tech sector in the Greek area does not necessarily ensure that the firm will be distinguished for its basic characteristics related to knowledge entrepreneurship.
Therefore, the state policies concerning the promotion of this type of entrepreneurship, which usually refer to sectors with technological content, should be done under other conditions and, above all, be targeted at the specific features of Greek firms. Understanding the differences in business behavior can play an important role in this, and the proposed classification can help. Since knowledge entrepreneurship is a kind of high-potential entrepreneurship and can be a driving force for economic growth, its targeted promotion can be realized if people focus on those factors that can influence it.
Regulation, market circumstances, technology, and laws all have significant consequences for financial management in businesses (Yurdakul and Kazan, 2020). Entrepreneurs act as detrimental transformational leaders and differ from small business entrepreneurs through operational model variation: instead of focusing solely on financial gain, they vigorously attempt to determine market distortions and generate wealth that demonstrates a growing industry while upending network infrastructure and systems in large enterprises. Commodities that produce or destroy value can fuel such a paradigm. The consequences are the domestic and foreign implications of resource usage as a function of company actions and exports.
Financial models aim to maximize and transform them via company operations and exchanges to generate exports and results which establish or degrade value for the company, its stakeholders, industry, and the ecosystem during the immediate, moderate, and long run. Accordingly, in assessing an institution's corporate value, one must examine the interdependence between the institutions creating competitive advantage and the stakeholders, supply chains, and eco - systems (Bakker et al., 2020). To determine the operational structure that specifies methods to improve a company's economic performance; it began with the topic of yearly financial information, the potential for reflecting the relationships between paternalist aspects, as well as the findings of past study (Burja, 2011).
In the context of the research, the authors have seen that such factors may be the knowledge and skills that the founders possess the size of the firm, their ability to recognize and exploit market opportunities, their export orientation and whether they have been established before or after the economic crisis. That is to say, the simple assumption that the creation of new firms in high-tech sectors will provide multiplier effects and benefits for the other economic sectors will not be absolutely correct.
In order to make sense in the search for such businesses in high-tech industries, a firm should consider the following: whether it is distinguished by the technical knowledge of its founders, is sufficiently large or has the potential to grow in a short time, has the ability to adapt to technological changes and produce diverse products and services, is extroverted, and was founded by taking advantage of a market opportunity rather than the need that may have been caused by the economic crisis.
Some of these factors also have a strong influence on the financial performance of firms. Generally, the economic course of firms depends positively on the founders’ technical knowledge, export activity, ability to perceive and adapt to technological changes and offer similar products and services, implement a strategy that focuses on increasing sales through the creation of new products and services and through entry into new market islands, and whether a business belongs to a cluster of firms, based on the proposed classification, which are distinguished for characteristics linked to KBE.
Throughout the literature, research gap can be spotted, concerning intense focus on the plethora of knowledge-based factors affecting the economic performance of high-tech firms. Since high-tech firms can be divided into, at least, 4 distinct categories/clusters, analysis of individual clusters as well as of the whole high-tech market is yet to be materialized. Thus, setting the propriate knowledge-based factors and connecting them with the economic performance of the ensemble of high-tech firms could provide valuable insights for their growth and development.
This paper is organized as follows: in literature review section, theoretical background for key definitions in this research was provided, while in the methodology section the structure of the framework is elaborated. Next, in results section, the authors extensively assay the process followed for main outputs extraction, while in conclusion and discussion section, a throughout quotation of the inferences takes place.
LITERATURE REVIEW
Knowledge-based entrepreneurship
Every form of entrepreneurship is based on the exploitation of some kind of knowledge, even when it comes to arbitrage opportunities (investment opportunity that brings profit without risk). KBE is a special form of entrepreneurship and is linked to the so-called knowledge economy, which is characterized by the crucial role of ICT, the high proportion of knowledge-intensive activities, the largest capital of intangible resources in relation to the corresponding capital of material resources in the whole stock capital, and increased R and D costs (Foray, 2004; Stam and Garnsey, 2008). When KBE is talked about, it refers to activities in which the role of creating new knowledge is central to creating value (Garavaglia and Grieco, 2005).
Starting from a broader definition of entrepreneurship and incorporating the concept of knowledge into it, the authors consider that: “entrepreneurship is the process of creating something new with value, devoting the necessary time and effort to knowledge-intensive economic activities, taking on economic, mental and social risks, and taking as a reward monetary and personal satisfaction and independence”, (Hisrich et al., 2005; Bosma, 2010). This definition is based on three key characteristics of entrepreneurship. First, the creation process, and indeed the creation process, of something new that is of value both to the entrepreneur himself and to the target audience. Secondly, the time and effort required to create this new one, which must also be operational. All time and effort are estimated only by those involved in the firm process.
Finally, the third important aspect of entrepreneurship that stands out from this definition is the assessment of the risks needed to obtain the expected benefits. These risks, despite their diversity, focus on the economic, psychological and social areas. When studying the KBE phenomenon, it is important to take into account, in particular, the first of three key aspects of entrepreneurship. In the context of the article, we will adopt some key elements that Malerba and McKelvey (2010) present for the concept of KBE. Therefore, KBE is linked to:
1) New firms,
2) Innovative firms (in terms of knowledge-based manufacturing processes),
3) Firms with significant knowledge intensity in their activities,
4) Firms that exploit innovative opportunities not only in high-tech sectors but in various sectors and
5) Firms participating in collaborative networks (Groen, 2005; Radosevic et al., 2008).
KBE is not just about start-ups. It's more than just new firms. These are new and innovative firms with high knowledge intensity in their activities, involved in a process of transforming knowledge into innovation. These firms are transforming knowledge into new or significantly improved products and services that can be brought to market. They are also firms that exploit innovative opportunities in various sectors and achieve through the strategy that pursue sustainable competitive advantage.
Innovation and economic growth
World financial difficulties have resulted in the conclusion that most businesses are run on unsustainable economic models. There has been agreement in discourses. In order to discover answers to those same difficulties, things must be done in a distinct way, so the common methodologies entail, to a significant part, the development of new knowledge and innovation (OECD, 2011). Chesborough (2003) addresses the shift into innovation, wherein linkages and interactions are as crucial as knowledge creation and property. According to Schumpeter (2017), innovation is considered as a revolutionary commodity, methodology, or technique of industry, with novel markets or supply of goods, or an innovative economic enterprise or corporation.
The preceding results highlight the relevance and urgency of examining entrepreneurs' perspectives on economic regulatory, since they not only expand the worldwide knowledge, but ultimately report back to economic regulators (Derdemezi et al., 2021). In investigating the importance of total factor productivity in describing economic growth, Barcenilla-Viss et al. (2013) studied datasets for 15 OECD nations between 1989 to 2004. Their findings suggest that technology, as measured via internal R and D expenditures, drives variance in technological evolution. The assessed findings suggest that the relationship among entrepreneurship and growth is not quite as evident as predicted by the variety of internal growth models (Kacprzyk and Dory, 2017).
Companies’ economic performance factors
Companies in the industry accomplish economic performance, by utilizing the most relevant factors that indicate factors connected to economic growth and company efficiency growth must be selected from across the relevant profitability variables (Burja, 2011). Methodologies created to investigate financial performance inside firms’ link performance with the involvement of different factors to increased performance, represented in degrees of revenue (Dumbrav?, 2010).
Industrial data suggest that even sustainable firms do not really outperform those lacking such characteristic in terms of financial growth. The above implies the fact that, there appears to be no financial rewards for businesses to embrace more sustainable plans and operations (Santis et al., 2016). When the revenue and solvency ratios were examined, additional factors, such as sectorial categorization had a higher impact on the firms' economic and financial performance, in comparison with expenditure in sustainable projects (Santis et al., 2016).
Decrease in profit and increased costs have a detrimental effect on a company's economic performance and financial management. Enterprises are in a debt spiral due to a shortage of or extremely limited expected revenue (Ivanov et al., 2020) from selling as well as constant cash expenditure to support constant expenditures (e.g., payroll, debt obligations, etc.). To Afonso et al. (2012), the essential avenue for exploration consideration would be categorizing organizations based on innovation strategies and analyzing those that have a stronger relationship between innovation and economic success. According to Ivanov et al. (2020), innovative technologies benefit organizations by lowering operating expenses, establishing a technical barrier that permits geographic separation, and offering an economic edge over non-innovative enterprise.
Networking, R and D and low innovation intensity factors
High-tech firms which are likely to become more tightly connected to international markets rely heavily on national and local connections. Companies participating in the innovation process understand the need of developing R and D collaboration to get necessary skills. As a result, internal capacities for developing new goods can be improved. Cooperation with other organizations and companies in R and D are an important strategy for creative enterprises to make exterior resources available since they allow for extensive sharing knowledge, capital sharing, and organizational learning (Becker and Dietz, 2002). R and D collaborations are employed as a supplement towards the innovation cycle; increasing enterprises' innovation contribution is measured by the concentration of in-house R and D and the implementation of innovative products (Becker and Dietz, 2002). R and D cooperation among firms and organizations increase the results of innovation processes. Firms operating in networking clusters do not achieve automatically better growth or economic performance (Broekel et al., 2015). Lee (2011) highlighted that firms located outside networks stimulate the R&D development better than other firms operating outside of clusters, named in this research R and D firms.
Lee et al. (2010) back up the idea of open innovation in low-innovation firms by pointing to interaction and collaboration as one potential strategy to improve their innovativeness. Such companies lack the skills and expertise in engineering, administration, promotion, and long-term R and D financing that are required to turn innovations into products or processes. One of the most important external factors in low innovation intensity firms’ innovation process is the barriers to innovation (Lee et al., 2010). From the above review, the aim of this study is to clarify the research field regarding the evaluation of Greek high-tech firms’ results, in terms of economic and accounting performance, and the role of knowledge-based entrepreneurship factors in them. For this purpose, authors seek to identify the impact of six separate knowledge-based factors on Greek high-tech firms’ economic performance, organized in 4 clusters, and thus settle 3 hypotheses containing 2 factors each. The referred review and research’s objectives can be addressed through the research hypotheses listed below.
H1: Does the adaptability of Greek high-tech firms in technological and market changes affect their economic performance?
H2: Greek high-tech firms’ product strategy and exports pose a significant factor for enhancing their economic performance.
H3: The level of market knowledge and the innovation level of Greek high-tech companies can impact their economic performance.
METHODOLOGY
Variables of analysis
Some of the key features of knowledge-based firms are: knowledge, innovation and networking. In addition, another feature of interest to us in the context of KBE is the 'age' of firms and the sector to which they belong. The focus of the investigation is new firms operating in high-tech sectors, and therefore the selection of the sampled companies was based on their date of establishment and the economic sector in which they operate. Companies were searched throughout the web, including Greek government companies’ registry (ACCI, 2022), in order to construct a list of firms to send the questionnaire for completion. The total response of the firms reached 26% of the total survey questionnaires sent, forming a sample of 209 high tech firms. Therefore, for the first three traits of KBE it is necessary to have indicators that will allow us to measure the specific sizes; while for the other two traits the initial selection of the firm population was sufficient to satisfy. All the variables that were used to determine the characteristics of KBE are presented below.
In order to classify firms on the basis of specific traits that they have and which relate to the concept of knowledge entrepreneurship, we have used three categories of variables. The first category is the knowledge intensity of firms. We distinguish this category into two subcategories of variables: (a) sources of knowledge and (b) the firms’ knowledge stock. The sources of knowledge contain the internal dimension of the firm as well as two ratios derived from factor analysis: the value chain (competitors - customers - suppliers) and the scientific sources of knowledge (academic institutions and research institutes - research programs - scientific journals). The firms’ knowledge stock includes the educational level of the founding group (1=Primary-Secondary-Vocational education, 2=Higher education, 3=Master, 4=PhD), the previous professional experience of the founders (Experience in founding - Experience in the sector) and the educational level of the employees (same categorization as that of the founders, but considering whether it exceeds 75%).
The second category is firm networking, where there are two indicators indicated by factor analysis. These are: exploring opportunities and creating something new (opportunities for exploiting new technologies and knowledge - developing new products/services - exploring opportunities for export activity - hiring highly qualified staff/skills) and managing day-to-day operations and obligations (addressing tax and other legal issues - operations and operations management).
The third category of variables is innovation, which includes: the creation or introduction of innovation in the last three years, the introduction of a product from abroad, the introduction of ready-made technology (e.g. equipment) from abroad, the adaptation of technology from abroad, the exploitation of results of research activity, either by own means or through cooperation, the exploitation of firms’ practices, the modernity of innovations (new/new for the enterprise - new for the market - new (new for the international market) and the protection of intellectual property in the last three years (patents, copyrights, trademarks, confidentiality agreements).
After classifying firms into clusters, variables were selected with which comparative analysis was performed between them. Here the authors have four categories of variables, where the indexes contained in each were indicated by factor analysis. The first category is the factors of firms’ creation. This category includes: the general incentives (need for personal creation - social recognition - job independence), the knowledge factors (market knowledge - work experience in the same industry), the specific incentives (job search for a livelihood - expectation of income growth), the recognition and exploitation of opportunity (recognition of a technological opportunity - recognition of a market opportunity - exploitation of scientific research results).
The second category, which is the obstacles to the operation of enterprises, always includes, according to the effects analysis: the risks and costs of developing technology (high costs for developing technology - technological risks - high costs of skilled labor) and the economic crisis (market uncertainty - limited domestic demand). Next is the third category concerning firms’ strategy, which focuses on new products and new niche market (increased sales by offering new products and services - entry to new markets).
The last category is the innovation barriers: innovation uncertainty (uncertainty associated with the commercial success of the innovative project - uncertainty in demand for innovative products/services - uncertainty associated with the technical part of the innovative project) and research requirements (high research and development costs - lack of funding for innovation - lack of qualified staff).
Comparative analysis allows us to confirm the differences between the four firm clusters by using variables that were not used in the classification process. Thus, the authors try to confirm some logical differences that exist between the groups and are associated with the selected variables. In order to do so, the authors organized the methodological framework by dividing the total 209 firms of the sample into 4 discrete clusters with similar characteristics. It was done by harvesting the factor analysis. Then, the authors present a comparative analysis of the 4 clusters in 5 important variables. They are included in the latter stage of the regression analysis, so as to give descriptive information of each cluster. Furthermore, descriptive statistical analysis and gradient accounting regression analysis were done, aiming to estimate each distinct independent variable’s impact on firms’ economic performance dependent variable. Following the results section, comprehensive analysis of the results is performed, connecting them with the settled research hypotheses, and concluding the findings of this study.
The four clusters
After the analysis and in order to explain the heterogeneity of the sampled companies and propose a classification based on their specific characteristics linked to KBE, a cluster analysis technique was applied. The classification proposed by the results of the analysis is particularly useful for studying the differences and relationships that firms have with respect to the concept of knowledge entrepreneurship. It is not just a categorization of firms into groups, as it allows us to trace the different levels of knowledge, networking and innovation in firms, in order to draw useful conclusions about the theoretical framework of research.
The purpose of the cluster analysis approach is to group observations based on their similarity into a number of variables. In the context of the investigation, we have applied hierarchical approach methods, which like the other approach offered by the SPSS statistical package, K-Means, does not require the existence of a model and relies only on algorithmic solutions. The final choice of the number of groups is made after the smallest observations in the distance are united at each step (each observation is itself a group).
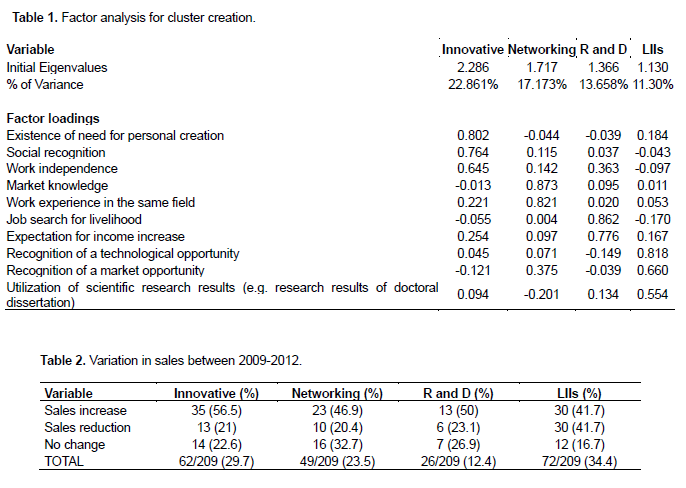
On the basis of the analysis carried out arise, four firm clusters: (a) Innovative firms (29.7%), (b) Networking firms (23.5%), (c) Research and Development enterprises (R and D) (12.4%) and (d) Low Innovation Intensity firms (LII) (34.4%). Factor loadings of each cluster as can be seen in Table 1. According to each firm’s results that were declared in the shared questionnaire, the sampled firms were classified into 4 clusters with specific characteristics. Each factor contributes to illustrate a distinct cluster and describe unique type of firms, either alone or combined with other factors. More specifically, innovative enterprises have the highest levels of innovation. Networking firms exploit to a greater extent than other firms. They explore new opportunities or settle everyday issues. R and D firms innovate, using exclusively the results of research carried out within them. LIIs show almost zero rates of innovation.
The analysis shows that the majority of the firms (34.4%) belong to the fourth category, where there are low innovation-intensive businesses. A key characteristic of KBE is that innovation does not show or it shows with minimal percentages in a large part of the sampled firms. This result is not in line with the fact that the sectors to which these firms belong are high-tech industries, expecting high innovative performance. Next in the number of projects is the category of Innovative firms with 29.7% and networking firms with 23.5%. The smallest group in terms of number is that of R and D firms with only 12.4%.
Economic trends of clusters
This part of the study will look at the financial data of firms per cluster. These figures, expressed in percentages, relate to the change in sales in 2009-2012, change in exports in the same period, change in permanent staff in the three years 2009-2011, an estimate of the change in the number of employees for 2012, and the turnover rate of innovative products for 2011. Each table was completed by summing up and categorizing the financial data of each cluster firms that responded to the authors’ survey. Starting from the change in sales from 2009 to 2012 the researchers observe from the percentages in Table 2, that at least 40% of the firms belonging to each group increased their sales. In fact, 1 in 2 firms belonging to the innovative firms and R and D firms have increased their sales during this period. On the other hand, the largest percentages of companies that show a decrease in their sales belong to the LIIs (41.7%), with a considerable difference from the corresponding percentages of firms of other groups. It would also be interesting to see what percentage of sales increase or decrease in each group.
As can be seen from the data in Table 3, LIIs and R and D companies have the smallest percentage increases in their sales, as 75% and 81% of them respectively have 10% increase. However, in general the percentages beyond that (over 10%) are quite low and move mainly in single digits. It is worth noting that the largest percentage of companies that increased sales by more than 50% belongs to innovative firms (8.1%), which to some extent reflect their - anyway - strong dynamics.
The export part often indicates the innovation of a firm as, according to the literature, when a firm produces products that are "tested" abroad then it tends to be more innovative than another firm that may only approach the domestic market. The firms in the sample to a large extent do not export. The companies that belong to the R and D category are more export-oriented, where about 1 to 2 firms export products; while the LIIs are less export-oriented, since only 30% of these firms export.
Between 2009 and 2012, as portrayed in Table 4, 42% of export-oriented R and D firms showed an increase in their exports, as well as a large percentage of innovative companies showed an increase in their exports (30.6%). This element shows on the one hand the strategy followed by many of the companies belonging to these two groups of firms (Innovative and R and D) and which is based on their export character; on the other hand, it suggests that this choice resulted in the last four years, as exports in this period increased.
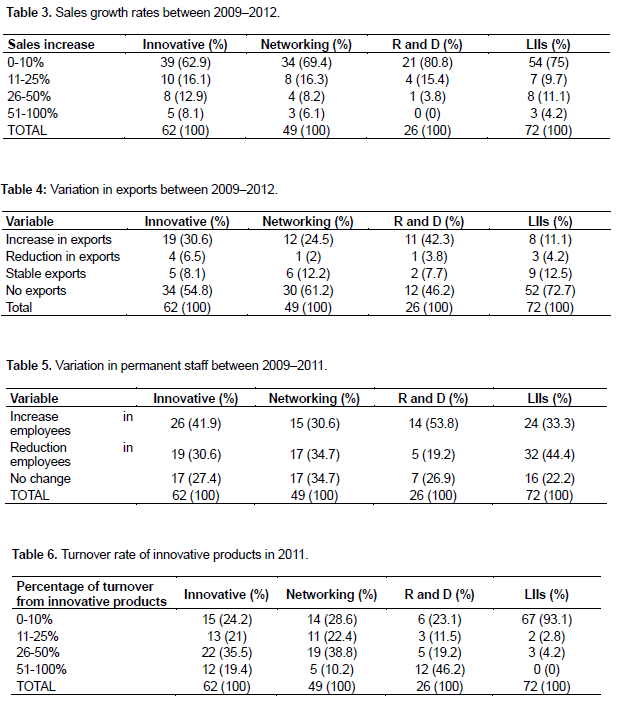
An important parameter for the development of an economy in general is employment. Firms that show positive economic data and grow employ more employees resulting in reducing the unemployment rate in the economy around them. That is why we examined the change in the permanent staff of the four groups of companies during the period 2009–2011 (Table 5). It seems that 1 in 2 R and D firms are doing well, thus attracting more people to their potential. The percentage of Innovative firms (42%) that show an increase in employees is also high. On the contrary, the biggest reduction in employees is held by firms, as 44% of them reduced their human resources in the three years 2009–2011.
In fact, as can been seen from the data in Table 5, the founders of 20% of these companies estimated that there will be another reduction in the number of their employees.
It became obvious that, most firms in all groups estimate that in 2012 there will be no change in their permanent staff. This is particularly important for R and D and Innovation firms that have recently created new jobs, which seem to have remained stable. Finally, the authors present the percentage of turnover that came through innovative products for 2011 (Table 6). It is worth noting here two important facts. First, those LIIs firms with the lowest innovation rates, when they innovate have equally small turnovers from these innovative products. The percentage of turnover from innovative products of the vast majority of these companies (93%) ranges from 0 to 10%. Secondly, that the firms with the highest percentage of turnover from innovative products belong to the R and D firms, since the turnover percentage of innovative products of 46% of these firms exceeds 50%. Therefore, it is concluded that these firms do not just innovate, but also that the result of the innovation process yields fruits and significant benefits.
However, it is important to consider, in addition to the particular characteristics of firms, the factors that affect their financial performance. It is not enough to join a firm in a certain group in order to show good financial performance and growth. In other words, the authors have to see from which factors the different "colors" of companies that we presented before affect their economic course.
In the context of this search, authors applied the method of gradual accounting regression (ordinal logistic regression), having as a dependent variable the financial performance of companies (variable "growth"). More specifically, they utilized the four clusters created at the previous stage of the methodology. The first cluster contains the firms that had a negative average sale during this period (59 companies); in the second cluster are the firms with an average growth between 0 and 10% (82 firms); in the third cluster are those that have an average growth of 11 with 50% (50 firms) and, finally, in the fourth group there are firms with an average sales increase of 51 to 100% (18 firms). The independent variables we use fall into five categories.
The first concern of the founders of the firms is choosing the technical knowledge and product design as the areas of knowledge and skills that best reflect their professional identity. The second is the ability of firms to recognize and take advantage of opportunities that, as can been seen from the results of factor analysis, there are two factors that distinguish this ability: the ability to adapt to market changes and the ability to adapt to technological change and production of differentiated products. The next independent variable is related to corporate extroversion, taking into account whether or not a firm is exporting in 2009–2012. As an independent variable, however, they also use business groups, as emerged from the cluster analysis. The companies are included in the following groups, in the order in which they were used as a variable in the analysis (in parentheses is the number of companies per group):
1) Low Intensity Innovation firms (72),
2) Networking firms (49),
3) Innovative firms (62),
4) Research and Development firms (26).
The last independent variable is the business strategy, focusing on that strategy of increasing sales by offering new products and services and entering new islets of the market (by factor analysis).
RESULTS
Previously, the proposed classification of firms belonging to various high-tech sectors was presented. Their behavior was assessed, depending on the group to which they belong, and based on the number of variables. The results of the ordinal logistic regression are interpretatively acceptable, as F-statistic is statistically significant at less than 1%. Also, the value of the adjusted R2 is satisfactory, revealing a fairly good fit to the data. As we can see all variables play a statistically important role. It is also characteristic that five of the six variables have a positive relationship with the dependent variable, while one factor which is the ability of the firm to adapt to changes in the market has a negative relationship.
The independent variables consist of specific factors from the survey, which the sampled firms filled. More specifically, technological knowledge consists of subfactors like sources of knowledge from customers, suppliers, competitors, academic institutions and research institutes, research programs and scientific magazines. Exports independent variable is based on the number of exports each firm of the sample performs, while the Market Changes and Adaptation Capacity consists of sub-factors as a company’s response to competitors’ movements, quick response to changes in demand, flexibility to produce differentiated products/ services, perception of technological changes and adaptability to them and response to following market trends.
A company’s cluster refers to sub-factors like the existence of need for personal creation, social recognition, work independence, market knowledge, work experience in the same field, job search for livelihood, expectation for income increase, recognition of a technological opportunity, recognition of a market opportunity and the utilization of scientific research results. Subfactors like uncertainty related to innovative projects’ technical part, uncertainty in demand for innovative products/services, lack of funding for innovation, uncertainty related to the commercial success of innovative projects, lack of specialized staff and high costs for research and development make up the Technological Changes and Exchanges independent variable.
Finally, Products and Adaptation Capacity consists of subfactors as increased sales through penetration into new markets by offering the same products/services, increased sales by offering new products/services, increased market share in existing markets by offering the same products/services and entry to new islets of the market factors. Therefore, the general equation of gradient accounting regression can be given as follows:

1) CEP - Company’s Economic Performance,
2) TK - Technological Knowledge,
3) EX - Exports,
4) PAC - Products and Adaptation Capacity,
5) CC - Company’s Cluster,
6) MCAC - Market Changes and Adaptation Capacity and
7) TCE - Technological Changes and Exchanges.
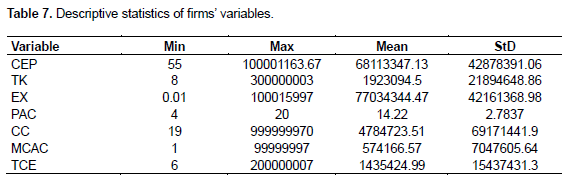
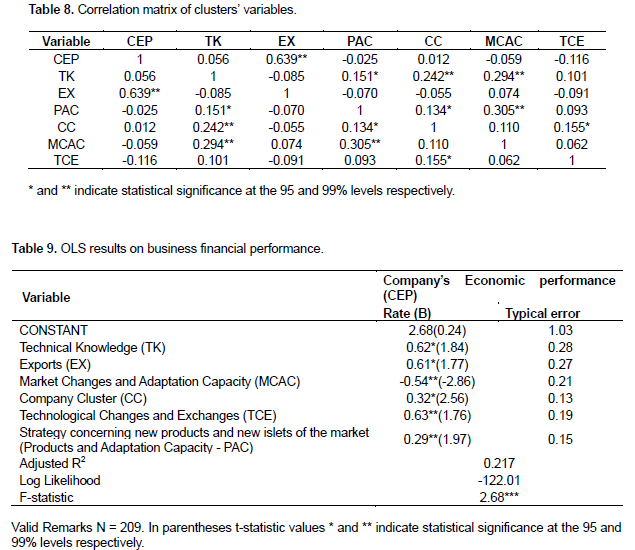
Furthermore, the necessary descriptive statistics of firms’ cluster are provided below, consisting of the mean, standard deviation, max and min statistics. Table 7 provides information about each population’s dispersion and key characteristics. Analyzing each cluster’s mean and standard deviation statistics combined with the results of the regression that follows, can allot an important base for the outcomes of the overall analysis. Table 8 shows the correlations of dependent and independent variables of the regression performed. Out of this correlation matrix, comparison of the connection of regression’s independent variables with firms’ cluster can be performed, enabling the expansion of research results. Table 9 presents the results of the regression analysis in detail.
The outcomes depicted in Table 9 give valuable insights regarding the verification of the 3 research hypotheses, settled at the Literature Review section. Since the significance level of MCAC and TCE variables is below 0.01, there is flagged significance at 99% level, and the 1st research hypothesis (H1) can be verified. This means adaptation in market and technological factors impacts significantly high-tech firms’ economic performance. The same implies to EX and PAC variables, that with significance levels below 0.05 and 0.01 barriers accordingly, the 2nd research hypothesis (H2) is also verified and Greek high-tech firms’ economic performance can be enhanced by increased efficiency of a company’s exports and products’ strategy. Lastly, the 3rd research hypothesis (H3) is verified, with the level of market knowledge and innovation of Greek high-tech firms impacting their economic performance, since TK and CC variables of the regression have significance levels below the 0.5 barrier.
DISCUSSIONS
As can be deducted from the regression analysis above, certain abilities and skills provide increased economic and thus, accounting performance for most types of firms. The authors included highly innovative firms, networking and R and D firms, as well as, lower innovation rate firms. Research results show that all independent variables are significant for enhancing the economic performance of firms, but in particular, firms’ ability to adapt efficiently to market and technological changes combined with effective product adaptation strategy can increase firms’ economic performance.
Therefore, firms with founders with significant technical knowledge and product design skills, who have a clear export orientation, perceive and adapt to technological changes by offering quality products, follow a strategy that is more associated with achieving innovative results, and belonging to clusters that have high reserves of knowledge and achieve significant innovative performance, are more likely to show better financial performance. The percentages of companies that forecast a decrease in sales and exports for 2012 are lower. 29% of companies estimated that they reduced their sales by an average of 24% and 16% of exporting companies that they reduced their exports by 10% (average). However, there are however, firms that -according to their founders- would have no change in sales and exports (21% and 23% respectively).
As part of the research, authors tried to create a model that assesses the factors that affect the financial performance of firms. For this reason, we distinguished them according to the average sales they had for the period 2009–2012. The first group included the firms that had negative sales during the period under review; the second grouped the firms with an average growth between 0 and 10%, and the third group of those firms that had an average growth of 11 to 50% and, finally, the fourth with average growth of 51 to 100%.
The variables used as independent variables in the model were technical knowledge and product design such as the most important areas of knowledge and skills of the founders, the ability of companies to adapt to market changes but also to adapt to technological changes by offering similar products, the export business orientation, the four business clusters resulting from the proposed classification and, finally, the firm strategy based on increasing sales by offering new products and services and entering new market islands.
Regarding the regression outcomes, it becomes obvious that firms could have an increased economic performance if they tend to adapt better to technological changes of the market, enhance their strategy and their products’ adaptability to markets’ demand. Moreover, when referring to company cluster factor and Table 7, the bigger the value the more innovative the firm and the lesser the value the less innovative the firm. This means that values near max characterize innovative firms and values near min refer to low innovation intensity firms.
In the same context, authors distinguish the strong connection between TK, PAC, MCAC and CC variables. These strong positive correlations of the independent variables can forebode the important role of technical knowledge (TK) in enhanced levels of firms’ product and market adaptation. Apart from that, the high mean values of CC, TK, PAC and TCE variables combined with their strong positive correlations mean that firms in the innovative cluster have better performance in technical knowledge, product and market adaptation capacity variables, as attributive factors of knowledge-based entrepreneurship.
CONCLUSIONS
From the financial data of the sampled firms, during 2009–2011, the plethora of those firms did not experience significant variation in terms of their sales. On the contrary, most increased profits and exports, where they are made, in the period under review; while there was a significant decrease in research and development costs in terms of percentage of sales. In addition, the founders were optimistic about the financial performance of their companies for 2012, as one in two firms estimated that it would increase its sales by an average of 35%. The exports of 61% of the exporting firms will increase by about the same percentage, always according to the estimates of the founders themselves.
From the results of the statistical analysis, the authors saw that all these factors are important for the financial performance of firms and in fact five of the six show a positive relationship. In particular, when a firm has a founder or founders with technical knowledge related to the industry and ability to design products, it is extroverted, can perceive and take advantage of changes in technology and follow a strategy that focuses on creating new products and services and in penetrating new market islands. Then this firm is expected to show better financial performance compared to other firms that do not have the same characteristics.
In addition, when a firm belongs to the group of R and D firms, authors estimate that it will have better financialdata than another company placed in a different group, as the variable related to the classification of firms also has a positive effect on financial performance. On the contrary, the only factor that negatively affects our dependent variable, that is, the growth of firms such as percentage of sales, is the ability of firms to adapt to market changes. Remember that this variable distinguished the LIIs with the Innovative firms and in the comparison made between them in order to see how the groups differ.
RESEARCH IMPLICATIONS
Research results demonstrate the need for high-tech firms, in many countries with the characteristics of Greek economy, to enhance their economic performance in order to achieve sustainability. This concern can be addressed by investing mostly on a company’s knowledge-based factors. This research proposed investing in factors connected with high-tech firms’ adaptability to market, product and technological changes to enhance economic performance in the market. Low innovation intensity firms and generally firms aiming to improve innovation processes should focus more on enhancing the proposed factors and sub- factors of knowledge-based entrepreneurship.
CONFLICT OF INTERESTS
The authors have not declared any conflict of interests.
REFERENCES
|
ACCI (2022). Prospects and Opportunities of Greek Entrepreneurs for Trade and Investment in Nigeria Available at: |
|
|
Afonso SC, Fernandes PO, Monte AP (2012). CSR of top Portuguese Companies: Relation between Social Performance and Economic Performance. World Academy of Science, Engineering and Technology 6(6):798-802. |
|
|
Bakker R, Georgakopoulos G, Sotiropoulou VA, Tountas KS (2020). The Impact of Integrated Reporting on Analysts' Forecasts. International Journal of Economics and Finance 12(1):76-89. |
|
|
Barcenilla-Visús S, Gómez-Sancho JM, López-Pueyo C, Mancebón MJ, Sanaú J (2013). Technical change, efficiency change and institutions: Empirical evidence for a sample of OECD countries. Economic Record 89(285):207-227. |
|
|
Becker W, Dietz J (2002). R&D cooperation and innovation activities of firms-evidence for the German manufacturing industry. Research Policy 33(2):209-223. |
|
|
Bosma N (2010). Overview of theory, statistical evidence and case studies on knowledge-based entrepreneurship, clusters and economic growth. AEGIS project, del 2(1). |
|
|
Broekel T, Fornahl A, Morrison A (2015). Another cluster premium: Innovation subsidies and R&D collaboration networks. Research Policy 44(8):1431-1444. |
|
|
Burja C (2011). Factors Influencing The Companies' Profitability. Annales Universitatis Apulensis Series Oeconomica 13(2):215-224. |
|
|
Chesborough H (2003). Open innovation: The new imperative for creating and profiting from technology. Harvard Business School Press. |
|
|
Derdemezi A, Toudas K, Boufounou P, Georgakopoulos G (2021). Financial Implications of Capital Controls Enforcement on Large-Cap Companies Listed on the Athens Stock Exchange. Journal of Economics and International Business Management 9(1):20-34. |
|
|
Dumbrav? M (2010). Analysis of the firm's performance: methods and models. Economic Publishing House. |
|
|
Foray D (2004). The economics of knowledge. MIT Press. |
|
|
Garavaglia C, Grieco D (2005). Hand in hand with entrepreneurship. A critical overview from entrepreneurship to knowledge-based entrepreneurship. KEINS. Knowledge-based entrepreneurship: institutions, networks and systems. |
|
|
Groen A (2005). Knowledge intensive entrepreneurship in networks: towards a multi-level/multi-dimensional approach, Journal of Enterprising Culture 13(1):69-88. |
|
|
Hisrich R, Peters M, Shepherd D (2005). Entrepreneurship, 6. McGraw Hill. |
|
|
Ivanov SH, Webster C, Stoilova E, Slobodskoy D (2020). Biosecurity, crisis management, automation technologies and economic performance of travel, tourism and hospitality companies - A conceptual framework. Available at: |
|
|
Kacprzyk A, Dory? W (2017). Innovation and economic growth in old and new member states of the European Union. Economic Research-Ekonomska Istraživanja 30(1):1724-1742. |
|
|
Lee S, Park G, Yoon B, Park J (2010). Open innovation in SMEs-An intermediated network model. Research Policy 39(2):290-300. |
|
|
Lee CY (2011). The differential effects of public R&D support on firm R&D: theory and evidence from multi-country data. Technovation 31(5-6):256-269. |
|
|
Malerba F, McKelvey M (2010). Conceptualizing knowledge-intensive entrepreneurship: concepts and models. AEGIS project. |
|
|
OECD (2011). Better Policies to Support Eco-innovation. OECD Studies on Environmental Innovation. OECD Publishing. |
|
|
Radosevic S, Savic M, Woodward R (2008). Knowledge-based entrepreneurship in Central and Eastern Europe: myth and reality. Economics Working Papers 93. Centre for the Study of Economic and Social Change in Europe, SSEES, UCL. |
|
|
Santis P, Albuquerque A, Lizarelli F (2016). Do sustainable companies have a better financial performance? A study on Brazilian public companies. Journal of Cleaner Production 133:735-745. |
|
|
Schumpeter J (2017). A Theory of Economic Development. Routledge. |
|
|
Stam E, Garnsey E (2008). Entrepreneurship in the knowledge economy. In Creating wealth from knowledge. Meeting the innovation challenge pp. 145-173. |
|
|
Yurdakul M, Kazan H (2020). Effects of Eco-Innovation on Economic and Environmental Performance: Evidence from Turkey's Manufacturing Companies. Sustainability 12(8):3167. |
|
Copyright © 2024 Author(s) retain the copyright of this article.
This article is published under the terms of the Creative Commons Attribution License 4.0


