ABSTRACT
Oligonucleotide microarrays data pre-processing procedures impacting gene expression differential survey performances were fully evoked. RNA-Seq tool exhibited high performances (sensitivity) as opposed to microarrays in transcriptomic as well as genomic studies. The aim of this study is to evaluate microarrays data pre-processing dynamism on gene expression differential analysis outcomes, assuming RNA-Seq approach as reference. For this purpose, significantly differentially expressed genes (DEGs) candidate by processing two Vitis vinifera development stages (veraison and repining), from previous comparative transcriptomic analysis, between RNA-Seq and our own developed custom microarrays designs submitted to 20 different data pre-processing procedures combination schemes in terms of expressed genes signal normalization (DN) and background subtraction (BS) functions developed in R limma package, were structured in nine (9) blocks, depending on microarrays DN+BS and as well BS+DN arrangements, and considered for multivariate statistical analysis. In total, 17,446 genes were common across all microarrays by processing the above mentioned V. vinifera differential analysis and were detected for the subsequent survey. Findings, although recognizing data pre-processing practices as a necessary step for improving microarrays performances suggested background correction procedure (BS+DN) as promoting DEGs data variability by contrast to genes signal normalization pattern (DN+BS). Also, results revealed DN+BS microarray data pre-processing procedure as enhancing oligonucleotide microarrays positive predictive value as well as sensitivity performances. In conclusion, the present survey highlighted the strong impact of microarray data pre-processing procedures (BS+DN and/or DN+BS) on gene expression differential analysis outcome and as well confirmed RNA-Seq as an acceptable approach in assessing oligonucleotide microarray performances in transcriptomic surveys.
Key words: Microarrays, RNA-Seq, Background subtraction (BS), expressed genes signal normalization (DN), Differential analysis, Vitis vinifera.
Expression oligonucleotide microarrays are designed to quantify the amount of mRNA in a specific sample. However, this can only be done indirectly through quantifying the color intensities returned by labeled mRNA molecules bound to the array surface. Translating pixel intensities into transcript expression requires a series of computations and/or operations, generically known as data pre-processing and normalization steps (Calza and Pawitan, 2010). Usually, the first transforma-tion applied to express data, referred to as normalization, adjusts the individual hybridization intensities to balance them appropriately so that meaningful biological comparisons can be made (Yang et al., 2002). There are a number of reasons why data must be normalized, including unequal quantities of starting RNA, differences in labelling or detection efficiencies between the fluorescent dyes used, and systematic biases in the measured expression levels (Yang et al, 2002; Yang and Thorne, 2003). Conceptually, normalization is similar to adjusting expression levels measured by Northern ana-lysis or quantitative reverse transcription PCR (RT–PCR) relative to the expression of one or more reference genes whose levels are assumed constant between samples. Numerous research investigations and/or studies using custom arrays have utilized a variety of methods depending on microarrays manufacturer and purpose of analysis, including standard LOWESS normalization (Wurmbach et al., 2003), normalization by housekeeping genes (Wilson et al., 2003; Takahashi et al., 2005, de Wit et al., 2005), total intensity or global normalization (Yang et al., 2002; Held et al., 2004) and normalization using spike-in controls (Benes and Muckenthaler, 2003). However,
Oshlack et al. (2007) showed that all of these methods could produce biased results. Indeed, they demonstrated this through a series of examples by introducing a weighted LOWESS normalization method (
Oshlack et al., 2007). In addition, several studies have proposed normalization methods that are based on robust local regression and account for intensity and spatial dependence in dye biases for different types of cDNA microarray experiments. To measure gene expression and changes in microarray gene expression surveys accurately and precisely, it is important to take into account random and systematic variations that occur in every microarray experiment (a well-known source of systematic variation arising from biases associated with the different fluorescent dyes). The selection of appropriate controls for normalization procedure in microarray gene expression analysis has been fully discussed, thus allowing the introduction of innovative set of controls (that is microarray sample pool) to aid in intensity-dependent normalization. Therefore, a robust method based on maximum likelihood estimation has been proposed to adjust scale differences among slides, permitting comparisons of expression levels across slides (Yang et al., 2002). Additionally, in order to ensure the accuracy of microarrays, an effective noise-filtering scheme (background subtraction) is needed. Several researchers have proposed different strategies to remove noise from gene expression profiles based on an auto-regressive model based power spectrum analysis combined with singular spectrum analysis (Matthew et al., 2007; Vivian and Hong, 2012). In addition, custom microarrays background correction procedures were usually performed using several methods and or functions provided by R
limma package (Smyth, 2005); that is, Normexp (Matthew et al. 2007). Contrary to oligonucleotide microarray, RNA-Seq is the direct sequencing of transcripts by high throughput sequencing technologies. It has shown strong potential to become a replacement for microarrays of whole-genome transcriptome profiling (Mortazavi et al., 2008; Nagalakshmi et al., 2010; Montgomery et al., 2010; Beyer et al., 2012; Mutz et al., 2013, Dago et al., 2014a). RNA-Seq next generation sequencing (NGS) has considerable advantages for examining transcriptome fine structure such as the detection of novel transcripts, allele-specific expression and splice junctions. RNA-Seq does not depend on genome annotation for prior probe selection and avoids the related biases introduced during hybridization of microarrays. Several studies have suggested an agreement between RNA-Seq and oligonucleotide microarray platforms in calling differentially expressed genes depending on the high rate of probes set with specific oligonucleotide probes, confirming the superiority of RNA-Seq next generation sequencing (NGS) technology, as opposed to microarray in gene expression differential analysis (John et al., 2008; Nagalakshmi et al., 2010; Dago et al., 2016). Also, our previous study confirmed high performances with regard to RNA-Seq and qRT-PCR as opposed to oligonucleotide microarray technologies, with the purpose to call accurately significantly differential expressed genes (DEGs) in gene expression differential analysis especially for lower expressed genes (Dago et al., 2014b). Furthermore, microarrays have an acceptable sensitivity and specificity (good reliability) in detecting differential expression for genes with a high expression levels and exhibiting high fold change feature in differential survey, while their specificity and sensitivity tends to be relatively low as regard lower expressed genes associated with a small fold change ratio (Dago et al., 2014b; Noel et al.,
2016). So, oligonucleotide microarrays technologies are strongly influenced by oligonucleotide probes features on the array (Joseph and Ton, 2006). Tracing and maintaining the identity of the thousands of probes requires an infor-matics system throughout the fabrication process. Gene-specific oligonucleotide probes are currently used in microarrays to avoid cross-hybridization of highly similar sequences. If the probes are not optimized for sequence specificity, microarrays can generate false-positive data due to non-specific cross hybridization to highly similar sequences, gene families (Xu et al., 2001; Evertsz et al., 2001), or alternatively spliced variants (Modrek et al., 2001). Considering as a whole, microarray performance in gene expression differential analysis as well as geno-mics studies, sturdily depend on oligonucleotide probes reliability in discerning analyzed transcripts and/or genes expression level (oligonucleotide microarray probes signal intensity). In other words, expression data pre-processing procedures in oligonucleotide microarray gene expression surveys represents a crucial step guarantying high quality results in gene expression differential analysis (Joseph and Ton, 2006; Dago, 2012). Since oligonucleotide microarray performance in transcriptomic and genomic surveys, depend on the right integration between gene expression data normalization (normalization of microarray expressed genes signal intensity) and background correction procedures. Based on this observation, recycled previous comparative transcriptomic results in term of significantly differentially expressed/modulated genes (DEGs) number, discriminated by both RNA-Seq and the developed custom microarrays designs submitted to 20 different DN+BS arrangement procedures (Noel et al., 2016; Noel et al., 2017). This is with the purpose to assess microarrays data pre-processing dynamism impact and/or influence on differential analysis outcomes. In addition, it is noteworthy to underline RNA-Seq and microarrays for the purpose of gene expression differential analysis were submitted to the same biological samples consisting to two V. vinifera grape berry development stage referred as véraison and repining. Indeed, during véraison period, the embryo within the seed matures and the seed coat lignifies. This berry development stage is characterized by growth of the seed and berry. At this point, the final number of cells in the berry is determined and acids accumulate. During repining phase the berry exhibits slow growth as energy is diverted to development of the seeds. At the end of this phase, the berry result to be soften and to color. Based on these strong phenotypical differences, it is believed that a gene expression differential analysis and/or transcriptomic surveys between véraison and repining grape berry development stages. This could provide sig-nificant DEGs number useful for the present multivariate statistical analysis by assessing the impact of microarray data-preprocessing components (normalization of expressed gene signal intensity and background subtraction/background correction) combination and/or arrangement on the out-comes of differential analysis. In addition, RNA-Seq next generation sequencing approach, for commodity reasons, as well as because of it high performances as opposed to oligonucleotide microarray in transcriptomic and genomic studies (John et al., 2008; Zhao et al., 2014) has been considered as reference and or benchmark in evaluating microarrays data pre-treatment dynamism on microarray gene expression differential surveys outcomes.
Microarrays experience performed by Dago (2012), corresponding of grapevine (V. vinifera) berry tissue at veraison (characterized by growth of the seed and berry) and ripening (characterized by slow growth) stages were used. Microarrays data were processed and analyzed in combination of several background subtraction (BS) and probe intensity signal (expressed genes data) normalization (DN) procedures. Several normalization and as well data processing procedures are available, most translated by gene-expression studies and with little consensus among laboratories. Considering different characteristics with regard our developed microarrays designs strategies including 4 custom oligonucleotide microarrays platforms based on single replicate and/or multiple long (60 mer) and/or short (35-40 mer) oligonucleotide probe per gene model transcript; it is unlikely that the same normalization proce-dure could perform equally in all platforms to correct systematic differences. Results of differential gene analysis from each microarray were then compared with the results obtained from RNA-Seq experiment performed by Zenoni et al. (2010). Sample of Vitis vinifera at veraison and ripening growth phases were collected as reported in Zenoni et al. (2010) and total RNA has been extracted as described in Zamboni et al. (2008). Nanodrop 2000 instrument (Thermo Scientific) and an Agilent Bio-analyzer Chip RNA 6000, respectively essayed RNA amount and integrity.
Microarray data preprocessing and differential gene expression analysis
Data preprocessing comprises computer methods adjusting ambient intensity; background subtraction and/or correction (BS) across arrays as well as removing variation sources between arrays due to external biological factors; data normalization (DN). Therefore, the present microarray gene expression data were preprocessed using all the combinations BS+DN procedures available in the library package limma (version 3.10.3) (Gentleman, 2004; Smyth, 2005). BS methods include none (that is null or none background subtraction) and normexp methods that depends on saddle, mle and robust multichip average (rma or rma75) parameters estimation strategies. DN procedure was applied using none (that is Null or none data normalization), scale, quantile or cyclic loess normalization method. Designs are reported across the paper referring to their (i) background subtraction and/or correction (BS) + (ii) data normalization procedure (DN). Array designs were therefore preprocessed with 20 different combinations of BS+DN methods. Expression (that is intensity) values of each gene were expressed applying either mean or median values of the probe signals of the same gene across each array. Differential gene expression (DGE) analysis between veraison and repining, two grapevine berry (Vitis vinifera) development stages was performed by comparing arrays processed with the same BS+DN and/or DN+BS combination. DGE analysis was conducted by applying linear models on the log-expression values followed by an empirical Bayes moderated t-statistics on each gene, aiming to reduce data variability errors. The “lmFit” and “eBayes” functions of the limma R package (version 3.10.3) were used (Gentleman, 2004; Smyth, 2005). The False Discovery Rate (FDR) suggested by Benjamini and Hochberg (Yoav and Yosef, 1995) was adopted to control the FDR since gene expression differentially analysis usually englobes multiple comparisons statistical test. A gene was considered as differentially expressed (DE) when showing a mean difference of the expression value greater than or equal to two folds between the veraison and repining grapevine V. vinifera development stages at a False Discovery Ratio ≤ 0.05 (FDR≤0.05). Only genes shared among all the platforms were compared to RNA-Seq results (Zenoni et al., 2010). Then, significantly differentially expressed genes recognized as such by previous mentioned microarray platforms and RNA-Seq approaches were considered for the multivariate statistical analysis. In total, 17,446 genes common across all micro-arrays were selected to test the microarray performances. Since it is commonly accepted that microarrays are not recommended for discriminating small fold changes and following the requirements imposed for a transcript or gene to be called differentially expressed we arbitrarily set the two-fold change requirement to claim that a gene was differentially expressed. RNA-Seq gene expression differential analysis performed by DESeq package (Anders, 2010) on the same biological sample (veraison and repining grapevine V. vinifera development stages) detected 5650 DE genes. Results from the various microarray designs were compared with results obtained by RNA-Seq, through stimulating the formers data pre-treatment arrangement in term of: (i) DN+BS (data normalization was stimulated before background subtraction process), (ii) BS+DN (background subtraction/correction was stimulated before data normalization procedure) and (iii) Null and/or none subtraction, denotes as Null_BS (microarray pre-processed by expression data normalization only) and (iv) Null or none normalization, referred to Null_DN (microarray pre-processed by noise and/or background subtraction and/or correction).
Multivariate statistical analysis
The previous survey (Noel et al., 2016) provided heterogenic results with regard microarray gene expression differential analysis depending on applied DN and BS procedure as well as on microarrays design strategy and/or manufacture. The developed custom microarrays (house microarrays) consisted in arrays platforms, including single replicate and/or multiple long (60 mer) and/or short (35-40 mer) oligonucleotide probes per gene model transcript (Dago, 2012) exhibited different number of significantly differentially expressed genes (DEGs) in agreement with RNA-Seq, by processing above mentioned veraison and repining grapevine Vitis vinifera development stages transcriptomic survey. Here, focus was on these DEGs candidates for performing multivariate statistical analysis in evaluating microarrays data pre-processing dynamism on differential analysis outcomes. Then, DEGs candidates were organized in 9 blocks by combining. On the one hand, (i) microarrays DN procedures and BS pattern referred as None, Scale, Cyclic Lowess, Quantil and on the other hand (ii) by combining microarray BS with microarray DN procedures referred to None, RMA, RMA75, Mle and Saddle.
Multivariate statistical analysis began by computing empirical cumulative distribution function (van der Vaart, 1998; Shorack and Wellner, 1986) of ecdf R package, for each above mentioned processed DEGs blocs, based on microarrays DN and as well BS procedures. Next, Anova test was performed with the purpose to assess DEGs data blocs’ variability. DEGs data distribution was evaluated between discriminated blocs by applying the Shapiro-Wilk normality test (Sam and Martin, 1965; Patrick, 1995). Indeed, it is possible to use a significance test comparing the sample distribution to a normal one in order to ascertain whether data show a serious deviation from normality or not. Shapiro-Wilk’s method is widely recommended for normality test (Patrick, 1995). In addition, density plot checking was tested for response variable closed to normality. In Shapiro-Wilk’s method, the null hypothesis is that sample distribution is normal. If the test is significant, the distri-bution is non-normal. From the output, the p-value > 0.05 implying that distribution of the data are not significantly different from normal distribution. In other words, the normality can be assumed.
Next, DEGs blocks variance homogeneity was assessed by Bartlett test (Bartlett test of homogeneity of variances). Various correlation tests (Pearson correlation test) were performed with the purpose to evaluate the degree of similarity and /or dissimilarity between processed DEGs blocks. In addition, the multivariate statistical analysis included violin plot survey, consisting in a combination of a box plot and a kernel density plot. Specifically, it starts with a box plot. It then adds a rotated kernel density plot to each side of the box plot (Hintze and Nelson, 1998).
PCA factor analysis (Costello and Jason, 2005) function’s based on psych R library output matches the calculation. H2 and U2 are the communality and specific variance, respectively, of the standardized loadings obtained from the correlation matrix. Also, microarray performance in evaluating microarray data pre-treatment influence on gene expression differential analysis results was measured, by calculating positive predictive values (PPV) parameter (Gunnarsson and Lanke, 2002; Heston, 2011). Presently performed multivariate statistical analysis based on the developed script in R (version 3.5.1) programming environment (R core team, 2004).
In the present survey BS acronym referred to microarray submitted to background correction and then to normalization procedure, while DN indicated microarray (expressed genes signal) submitted to data normalization processed and then to background correction. Null_BS means microarrays was pre-processed normalizing expressed genes probes signal intensity, while Null_DN refers to microarrays pre-processed subtracting and/or correcting and/or adjusting noise and/or background.
Combination between microarrays data normalization and background correction procedures impacting differentially expressed genes population distribution
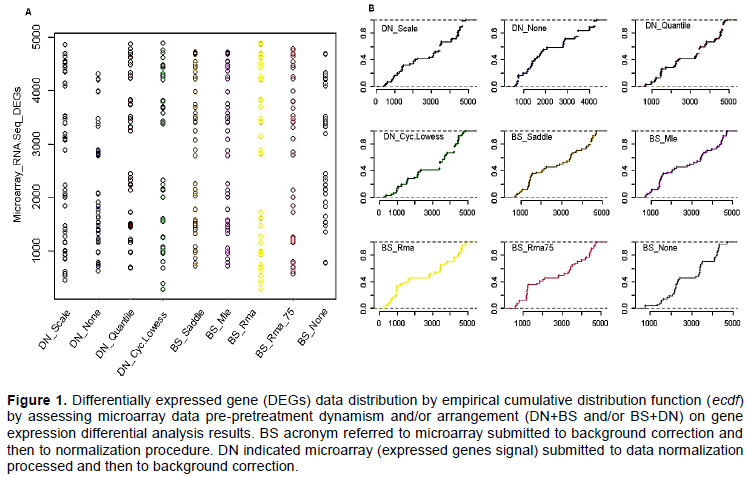
We assessed the impact of microarray data pre-processing dynamism on differentially expressed genes (DEGs) data distribution. The analysis apparently suggested a similar performances with regard all performed DN+BS and/or BS+DN rearrangement and/or combi-nation procedures (Figure 1). However, the findings clearly show differences in term of DEGs data distribution for microarrays exempted to normalization and as well as noise correction processes (Figure 1). The same investigation basing on both DEGs data dispersion (Figure 1A) and empirical cumulative distribution function (Figure 1B) suggested a strong similitude between quantile and cyclic loess normalization procedures in the present oligonucleotide microarrays gene expression differential analysis. Generally, the present dispersion survey suggested a relative high similitude between microarrays under normalization procedures as opposed to those under background correction processes (Figure 1). Also, empirical cumulative distribution function analysis by reinforcing above evoked similitude between quantile and cyclic loess normalization systems com-bined to all process background correction procedures, confirmed DEGs data distribution difference between microarrays exempted to normalization and background correction processes (Figure 1B). In other word, the present survey supposed a heterogeneous aptitude with regard oligonucleotide microarrays under background correction procedures in term of DEGs data dispersion. Considering as a whole, the present results supposed microarray gene expression data normalization procedure as adjusting DEGs candidate dispersion as opposed to background correction process.
Parallel principal component factor analysis assessing differentially expressed genes data variability by handling microarray gene expression data normalization and background correction procedures
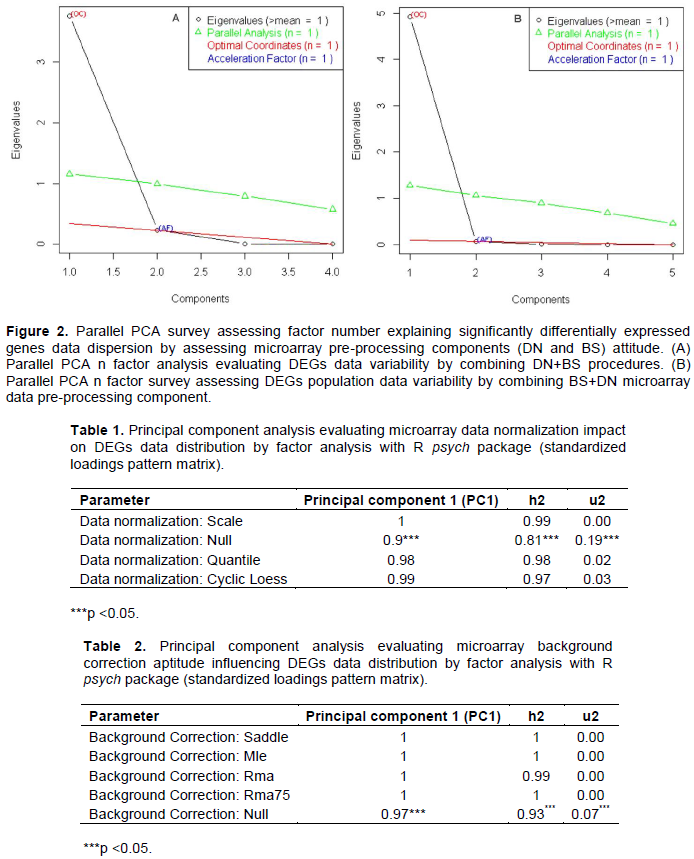
Principal component method of factor analysis in R software suggested one factor as optimal and/or enough for explaining differentially expressed genes data variability by combining and processing DN+BS and as well BS+DN procedure (Figure 2). Here, the eigenvalues and eigenvectors are computed from the Pearson correlation matrix (see material and method chapter). The present analysis by processing hypothesis test that one (1) component is sufficient for explaining DEGs data variability with regard microarrays submitted to data normalization procedures (DN+BS arrangement) exhibited the following results: the root mean square of the residuals (RMSR) = 61969.35 with the empirical chi square 2.76e+12 (p<<0.05). In other words, one (1) component is sufficient in explaining presently processed data variability. In addition, principal component survey by providing communality (H2) and specific (U2) variance, suspected Null (none) normalization pattern as triggering DEGs data dispersion in oligonucleotide microarray gene differential analysis results (Table 1). In addition, principal component method of factor analysis attributed 95% of variance proportion to Null (none) normalization pattern. This result promoted data normalization procedure in microarray gene expression analysis as guarantying result stability. Comparative analysis with regard principal component analysis by providing communality (H2) and specific (U2) variance suggested high propensity of Null (none) microarray background correction in inducing variability in microarray gene expression differentially analysis data since 99% of variance proportion of DEGs population variability result to be explained by Null background correction pattern (Table 2). Indeed, principal component method of factor survey with regard hypothesis that one (1) component is sufficient, explaining DEGs data dispersion with regard microarrays submitted to background correction procedures (BS+DN combination) exhibited the following results: the root mean square of the residuals (RMSR)=12001.2 with the empirical chi square 1.38e+11 (p<<0.05). The same survey preconized weak differences in term of variance estimation between microarrays systems submitted to normalization procedures (Table 2) as opposed to those under noise correction procedures (Table 1). Considering as a whole, these results dis-played microarray gene expression signal normalization combined with microarray background correction pattern (DN+BS arrangement) as reducing variability and/or stabilizing microarray gene expression differential analysis results.

Differentially expressed genes variance comparison by assessing microarrays data pre-processing dynamism on differential analysis results
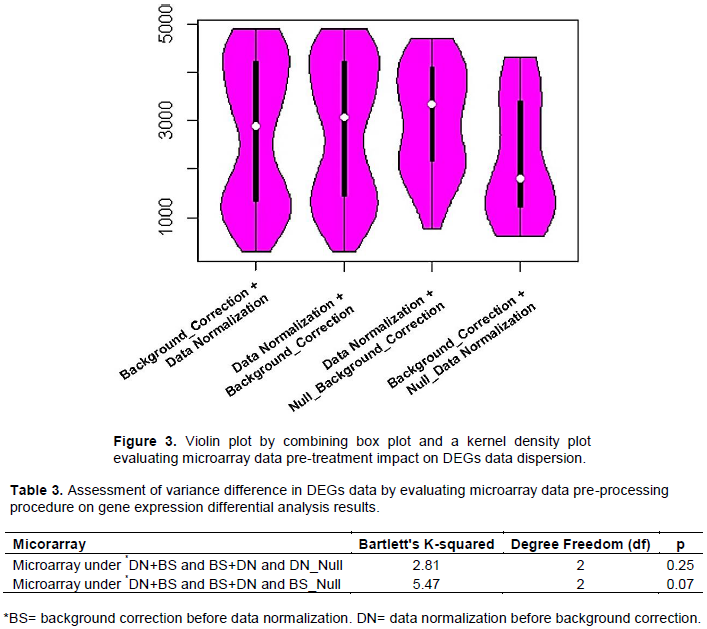
Bartlett’s test was performed, to compare the variance among DEGs data from microarray under normalization (DN combined with BS or DN+BS) and background correction (BS combined with DN or BS+DN) procedures as well as Null normalization combined with BS and Null background combined with DN process. Bartlett’s test results are as follow: Bartlett's K-squared = 7.3098, df = 3 and p = 0.06, suggesting a relative variance difference between processed DEGs data. Multivariate analysis based on violin plot that combined a box plot and a kernel density plot suggested a relative similitude in DEGs data distribution between processed DN+BS and BS+DN combination patterns (Figure 3). The same survey exhibited a high difference in term of DEGs data dispersion between microarrays under data normalization (Null and/or none background correction) and back-ground correction (Null and/or none data normalization) patterns, as well as suspected data normalization procedure as enhancing microarray sensitivity in gene expression differential analysis (Figure 3). Partial Bartlett’s test assessing DEGs data variance difference was performed with regards to: (i) microarray under DN+BS and BS+DN and DN (Null background correction) procedures and (ii) microarray under DN+BS and BS+DN and BS (Null data normalization) procedures (Table 3). Partial Bartlett’s test attributed microarray gene expression data variability to Null and/or none background correction factors (p=0.07) as oppose to Null and/none data normalization features (p=0.25). This result is in agreement with previous asserting microarray’s noise to reduce microarrays performance in gene expression differential expression analysis.
Assessment of differentially expressed genes data normality distribution by comparing microarray DN+BS and BS+DN data pre-processing systems
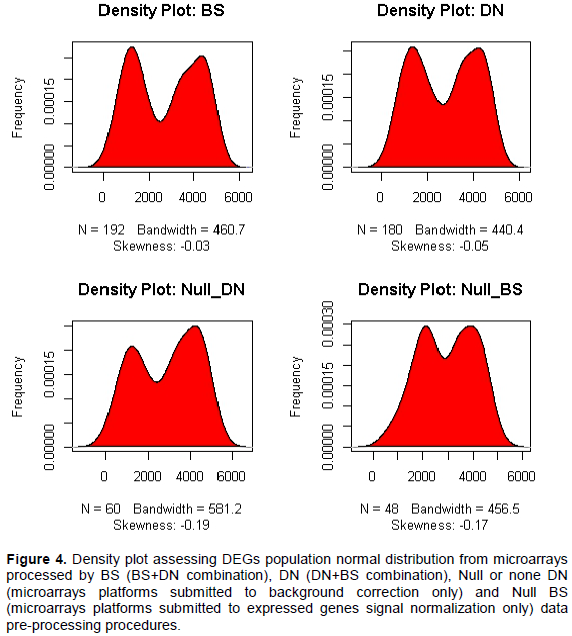
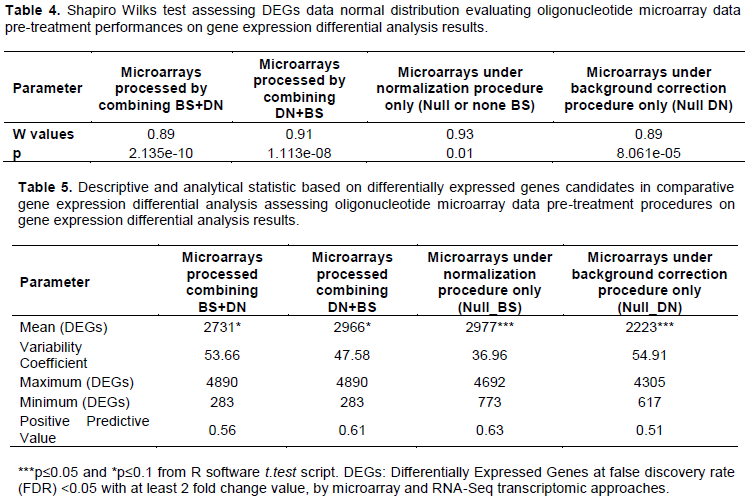
Findings showed differences in DEGs data distribution profile, depending on microarray data pre-processing procedures. In statistics, skewness is a measure of the asymmetry of the probability distribution of a real-valued random variable about its mean. Then, skewness can be quantified to define the extent to which a distribution differs from a normal distribution. Then, all processed BS+DN (p=2.13e-10) and DN+BS (p=1.11e-08) combinations procedures provided non-normal data distribution with regard to analyzing differentially expressed gene data (DEGs distribution differ to normal distribution) (Figure 4, Table 4 and Supplementary Figure 1). Findings suggested a relative good performance in term of DEGs data normal distribution for microarrays under gene expression data normalization (DN+BS) procedure as oppose to background correction (BS+DN) procedure (Figure 4). In addition, Shapiro Wilks test was performed, comparing the sample distribution to a normal one in order to ascertain whether data show or not a serious deviation from normality. From the output p>0.05 implying the distribution of data is not significantly different to normal distribution. Based on this, the findings exhibited microarray normalization data pre-treatment (DN+BS) procedure (p=0.01< 0.05) as relatively favoring DEGs data normal distribution as opposed to microarray background correction (BS+DN) pattern (p=8.061e-05 <<0.05) in the present transcriptomic comparative analysis (Table 4). Although all processed microarray data pre-processing procedures combinations (DN+BS, BS+DN, Null BS +DN and Null DN +BS) displayed a significant difference to normal distribution (p<0.05). The results suggested a selective impact with regard microarrays data pre-treatment procedures in stabilizing oligonucleotide microarrays gene expression differential analysis. Furthermore, supplementary Figure 1 clearly suggested integration between DN and BS procedures for stabilizing oligonucleotide microarray gene expression differential analysis outcome as opposed to single BS and DN procedures.
Performance assessment of microarray data pre-processing patterns on oligonucleotide microarray gene expression differential survey results
Student test in comparing DEGs proportion difference between microarrays processed by combining BS+DN and those handled by combining DN+BS, suggested a relative high sensitivity with regard microarray under data normalization (DN+BS) procedures (p=0.1) (Table 5). This result evoked a relative preeminence of microarray data normalization procedures as opposed to background correction events in improving oligonucleotide microarray sensitivity in gene expression differential analysis when RNA-Seq approach was assumed as reference. More-over, microarray submitted to normalization procedure and exempted to background correction (Null back-ground), exhibited a significant difference with regard microarray submitted to background procedure exempted to gene expression signal normalization (p<0.05) (Table 5). This result showed that microarray gene expression data normalization procedure contributes in enhancing and as well improving microarray gene expression differential analysis results sensitivity. In addition, the findings by analyzing variability coefficient parameter recorded microarray under normalization procedure only (DN only) as reducing differential expressed genes data dispersion (Table 5). Performance survey suggested higher positive predictive values parameter for microarray under normalization (DN only and DN+BS) procedures, as opposed to those under background correction (BS only and BS+DN) procedures. Moreover, the results sug-gested less impact of microarray background correction on gene expression differential analysis, once expressed genes signal intensity have been normalized (Table 5).
Gene expression analysis, using oligonucleotide microarrays, is a multi-step procedure. Preprocessing is an important part of this procedure and it is the step focused on in this survey, using RNA-Seq approach as reference and/or benchmark, because of its high performance and high dynamic range with respect to oligonucleotide microarrays in transcriptomic and genomic surveys. Oligonucleotide microarrays data pre-processing include background subtraction/corrected (BS) and normalized expression value per gene or transcript (DN) have been fully evoked (Allison et al., 2001; Astrand, 2003; Bhattacharjee et al., 2001; Binder et al., 2004; Boes et al., 2004). Also as suggested back-ground subtraction and/or correction as reducing bias in point estimates but also as increasing the variance of ex-pression measures considerably. In addition, it has been showed that normalization greatly improves sensitivity in detecting differentially expressed genes. Furthermore, all examined normalization methods were robust against a large number of differential genes as long as the changes in expression are approximately symmetrically distributed. Otherwise, most normalization methods lead to a large number of false positive genes (Astrand, 2003; Binder et al., 2004; Boes et al., 2004; Dago, 2012; Dago et al., 2016). Here several oligonucleotide microarray normalization were combined with background correction procedures based on R limma package (Gentleman, 2004; Smyth, 2005) with the purpose to assess their impact, for calling significantly differentially expressed genes by assuming RNA-Seq approach as reference. This is because of its high dynamic range as well as high sensitivity in transcriptomic and genomic surveys as oppose to oligonucleotide microarrays (Mortazavi et al., 2008; Nagalakshmi et al., 2010; Montgomery et al., 2010; Beyer et al., 2012; Mutz et al., 2013). The analysis focused on DEGs commonly expressed between our previous developed oligonucleotide microarrays (custom oligonucleotide microarrays designs based on ex Roche NimbleGen and Combimatrix platforms) and RNA-Seq high through-put in a comparative gene expression differential analysis (Zenoni et al., 2010; Dago, 2012). Indeed, the above mentioned microarrays platforms and RNA-Seq tools were submitted gene expression differential analysis (transcriptomic survey) by processing two grapevine V. vinifera development stages, which referred to veraison and repining. Interestingly, it is note-worthy to underline strong phenotypical difference with regard to véraison characterized by berry growth seed and ripening grapevine berry development characterized by slow growth. Thus, allowing a consistent high number of DEGs needed for our multivariate statistical survey, with the purpose to evaluate microarray data pre-processing dynamism on differential analysis outcomes since statistical analysis power increase with sample size. Nancy et al. (2005) via a transcript profiles analysis revealed that most activations were triggered simul-taneously with softening, occurring within only few hours for an individual berry, just before any change in colora-tion or water, sugar, and acid content can be detected.
Although most dramatically induced genes belong to unknown functional categories, numerous changes occur in the expression of isogenes involved in primary and secondary metabolism during ripening (Nancy et al., 2005; Zenoni et al., 2010). In addition, the same survey by processing transcription factor analysis revealed the induction of several genes at véraison, suggesting increasing biotic and abiotic stress conditions during ripening. This observation was strengthened by an increased expression of multiple transcripts involved in sugar metabolism. Considering as a whole, véraison and repining grapevine V. vinifera development stages exhibit sustainable differences in gene expression differential analysis, in provoked and as well normal physiological conditions. In the same tendency, our processed oligonucleotide microarrays transcriptomic analysis by processing 20 combination of DN+BS procedures recorded 17,446 genes common across all microarrays (Dago, 2012). Also, RNA-Seq transcriptomic survey, analyzing the same biological samples (grapevine V. vinifera véraison and repining development stages) by DESeq R package (Anders, 2010) exhibited 5650 DEGs at an FDR≤0.05 with 2 fold change ratio between processed véraison and repining grapevine Vitis vinifera development stages (Noel et al., 2017). For the present survey, DEGs were selected by stimulating (i) microarrays DN before BS, (ii) microarrays BS before DN and (iii) microarrays with Null BS (microarrays submitted DN procedure only) and as well (iv) microarrays with Null DN (microarrays pre-processed by applying BS only) . The research is interested in a multivariate statistical survey in assessing oligonucleotide microarray data pre-processing dynamism, influencing microarray gene expression differential analysis out-comes, assuming RNA-Seq next generation sequencing (NGS) approach as reference. Although, RNA-Seq is still a technology under active development, it offers several key advantages over microarray technology. First, unlike hybridization-based approaches, RNA-Seq is not limited to detecting transcripts that correspond to existing genomic sequence. This makes RNA-Seq particularly attractive for non-model organisms with genomic sequences that are yet to be determined. RNA-Seq can reveal the precise location of transcription boundaries, to a single-base resolution. Furthermore, several studies showed that RNA-Seq can accurately reveal gene expression difference (Song et al., 2011).
The study is aimed at evaluating preeminence of micro-array data normalization (DN) and/or background cor-rection (BS) procedures on oligonucleotide microarrays gene expression differential analysis outcomes. In the present study assessed normalization and/or background propensity influencing differential analysis results, by focusing exclusively on DEGs commonly expressed between RNA-Seq and analyzed microarrays, rather than focusing microarray probes set and as well microarray chip features. An empirical cumulative distribution analysis was computed and performed via ecdf R statistical package function (see material and method chapter) on DEGs data from (i) microarray platform from blocs where genes expression data have been first normalized, before applying background correction (DN+BS) and (ii) oligonucleotide microarrays where back-ground correction procedures have been applied before applying gene expression data normalization (BS+DN). Findings showed a relative similitude between microarrays submitted to DN+BS procedure as opposed to those processed by BS+DN in evaluating DEGs data distribution among considered blocs (Figure 1). In addition, empirical cumulative distribution function advised a high similitude between quantile and cyclic loess normalization systems applied to all background correction (Dago et al., 2017). It also showed DEGs data distribution difference for microarrays gene expression differential analysis exempted to normalization and as well background correction procedures (Figure 1B), suspecting a heterogeneous aptitude with regard oligonucleotide microarrays under background correction procedures (BS+DN). Then, findings supposed micro-array gene expression data normalization procedures as adjusting DEGs data dispersion as opposite to oligonucleotide microarray under background correction processes. Indeed several studies showed oligo-nucleotide microarray background processes as a source of data variability (Allison et al., 2001; Astrand, 2003). Next principal component method of factor analysis sug-gested one factor as optimal for explaining differentially expressed genes data dispersion for oligonucleotide microarray submitted to microarrays DN+BS and as well to BS+DN pre-pretreatment procedures (Figure 2). The comparative analysis with principal component analysis by providing communality (H2) and specific (U2) variances suggested by high tendency of Null microarray background correction in prompting high variability in microarray gene expression differentially analysis since 99% of variance proportion of DEGs data variability resulted to be explained by Null background correction pattern. Also, the same survey preconized weak differences in term of variance estimation between micro-arrays systems, submitted to normalization procedures (DN+BS) as opposed to those under noise/background subtraction procedures (BS+DN) (Table 1), suggesting oligonucleotide microarray DN+BS data pre-processing as reducing variability in microarray gene expression differential analysis results. As mentioned above, numerous studies supported that background correction reduces bias in point estimates but also increases the va-riance of expression measures significantly ((Allison et al, 2001). Interestingly, the performed partial Bartlett’s test attributed microarray gene expression data variability to microarray under Null background correction factors (p=0.07), as oppose to microarray under Null data normalization features (p=0.25). This result is in agree-ment with previous ones, asserting microarray’s noise as reducing microarrays performances in gene expression differential expression analysis (Allison et al., 2001; Astrand, 2003; Bhattacharjee et al., 2001; Binder et al, 2004; Boes et al, 2004). Also, Bartlett’s test allowed estimation variance difference between DEGs data of oligonucleotide microarrays under normalization and oligonucleotide microarrays under background correction procedures and those under Null normalization and Null background subtraction processes. Bartlett’s test suggested a relative variance difference between that processed DEGs data. Multivariate analysis based on violin graphic shown a similitude between processed microarrays DN+BS and BS+DN combination patterns in term of DEGs data distribution (Figure 3). The same survey revealed a high difference between both oligonucleotide microarrays under (i) data normalization only and (ii) background correction procedures only and suspected oligonucleotide microarray gene expression data normalization procedures as enhancing microarray sensitivity in the present gene expression differential analysis results. As suggested above, it has been showed that normalization greatly improves oligo-nucleotide microarrays sensitivity in calling significantly differentially expressed genes (Binder et al., 2004; Johnson et al., 2007; Dago et al., 2016; Noel et al., 2016). Normalization methods were robust against a large number of differential genes as long as the changes in expression are approximately symmetrically distributed. Then, normality distribution was assessed with regard to DEG data from microarray under normalization (DN+BS) and background subtraction/correction (BS+DN) procedures as well as null normalization and background correction (Figure 4 and Supplementary Figure 1). Even if all processed microarray normalization and background correction combinations procedures (DN+ BS and/or BS+DN procedures) displayed a significant difference to data normal distribution (p<0.05), the present results suggest a selective impact with regard microarrays data pre-treatment procedures on gene expression differential analysis outcomes. This is because Shapiro normality test exhibited microarray normalization data pretreatment procedure (p=0.01<0.05) as favoring DEGs data normal distribution as opposed to microarray background correction pattern (p=8.061e-05<<0.05). Next, evaluating oligonucleotide microarrays performance was focused on based on their data pre-pretreatment procedures. Oligonucleotide microarrays positive predicting values performance in calling significantly differentially expressed genes in agreement with RNA-Seq high through-put approach, increased for oligonucleotide microarrays under normalization procedures (DN+BS) as opposite to those under noise correction and/or background subtraction procedures (BS+DN). In other words, our findings linked oligonucleotide microarrays high performances in calling significantly DEGs with oligonucleotide microarray gene expression data normalization procedures, suggesting the preeminence of data normalization (DN+BS) in stabilizing gene expression differential analysis outcomes (Johnson et al., 2007; Dago et al., 2017). However, the results presented in this study could be limited and/or less exhaustive because of reduced number of processed oligonucleotide microarrays platforms (4 oligonucleotide custom microarrays platforms based on probe set design features as well as probe size) (Dago, 2012).
The findings clearly showed differences between oligo-nucleotide microarrays data pre-processing procedures in term of combining gene expression data normalization and background/noise subtraction/correction procedures. Variability in oligonucleotide microarrays gene expression differential analysis strongly depend on microarray background correction events, while gene expression data normalization improve oligonucleotide microarrays positive predictive value in calling significantly differen-tially expressed genes when RNA-Seq was assumed as reference and/or benchmark method. Although, all combinations as regards the presently processed gene expression data normalization (DN) and background subtraction (BS) methodology of limma package display an acceptable performance differential analysis, the fin-dings attributed the preeminence at the purpose of gene expression data normalization practices to improving microarray sensitivity; as well as in stabilizing differential analysis outcomes between different microarrays platforms.
The authors have not declared any conflict of interest.
REFERENCES
|
Allison BD, Gadbury GL, Heo M, Fern’andez JR, Lee C, Prolla TA, Weindruch R (2001). A mixture model approach for the analysis of microarray gene expression data. Computational Statistics and Data Analysis 39:1-20.
Crossref
|
|
|
|
Anders S (2010). Analysing RNA-Seq data with the DESeq package. EMBL Heidelberg.
|
|
|
|
|
Astrand M (2003). Contrast normalization of oligonucleotide arrays. Journal of Computational Biology 10(1):95-102.
Crossref
|
|
|
|
|
Benes V, Muckenthaler M (2003). Standardization of protocols in cDNA microarray analysis. Trends Biochemistry Science 28:244-249.
Crossref
|
|
|
|
|
Beyer M, Mallmann MR, Xue J, Staratschek-Jox A, Vorholt D, Krebs W, Sommer D, Sander J, Mertens C, Nino-Castro A, Schmidt SV, Schultze JL (2012). High-Resolution Transcriptome of Human Macrophages. PLoS ONE 7 e45466. 9.
Crossref
|
|
|
|
|
Bhattacharjee A, Richard WG, Staunton J, Li C, Monti S, Vasa P, Ladd C, Beheshti J, Bueno R, Gillette M, Loda M, Weber G, Mark EJ, Lander ES, Wong W, Johnson BE, Golub TR, Sugarbaker DJ, Meyerson M (2001). Classification of human lung carcinomas by mRNA expression profiling reveals distinct adenocarcinoma subclasses. PNAS 98(24):13790-13795.
Crossref
|
|
|
|
|
Binder H, Kirsten T, Loeffler M, Stadler PF (2004). The sensitivity of microarray oligonucleotide probes variability and the effect of base composition. Journal of Physical Chemistry 108:18003-18014.
Crossref
|
|
|
|
|
Boes T, Kruse E, H¨use J, J¨ockel KH (2004). Effects of the probe-set expression measure computation of gene expression data derived from affymetrix-chips. Biometrical Journal 46 Suppl.
Crossref
|
|
|
|
|
Johnson WE, Li C, Rabinovic A (2007). Adjusting batch effects in microarray expression data using empirical Bayes methods. Biostatistics 8:118-27.
Crossref
|
|
|
|
|
Calza S, Pawitan Y (2010). Normalization of gene-expression microarray data. Methods Molecular Biology 673:37-52.
Crossref
|
|
|
|
|
Costello AB, Jason O (2005). Best practices in exploratory factor analysis: four recommendations for getting the most from your analysis. Practical Assessment Research and Evaluation 10(7).
|
|
|
|
|
Dago DN (2012). Performance assessment of different microarray designs using RNA-Seq as reference Id prodotto: 67051; Id Ugov: 404537.
|
|
|
|
|
Dago DN, Alberto F, Diarassouba N, Fofana IJ, Silué S, Giovanni M, Massimo D (2014a). Probes specificity in array design influences the agreement between microarray and RNA-Seq in gene expression analysis. African Journal of Science and Research 3(5):08-12.
|
|
|
|
|
Dago DN, Giovanni M, Alberto F, Massimo D (2014b). Evaluation of microarray sensitivity and specificity in gene expression differential analysis by RNA-Seq and quantitative RT-PCR. Journal of Multidisciplinary Scientific Research 2(6):05-09.
|
|
|
|
|
Dago DN, Lallié HD, N'Goran KE, Mori A, Diarrassouba N, Massimo D, Giovanni M (2016). ROC curve assessing microarray oligonucleotide size calling differentially expressed genes by high-throughput sequencing approach. International Journal of Applied Biology and Pharmaceutical Technology 7(3):130-141.
|
|
|
|
|
de Wit NJ, Rijntjes J, Diepstra JH, van Kuppevelt TH, Weidle UH, Ruiter DJ, van Muijen GN (2005). Analysis of differential gene expression in human melanocytic tumour lesions by custom made oligonucleotide arrays. British Journal of Cancer 92:2249.
Crossref
|
|
|
|
|
Evertsz EM, Au-Young J, Ruvolo MV, Lim AC, Reynolds MA (2001). Hybridization cross-reactivity within homologous gene families on glass cDNA microarrays. Biotechniques 31(5):1182-1184.
Crossref
|
|
|
|
|
Gunnarsson RK, Lanke J (2002). The predictive value of microbiologic diagnostic tests if asymptomatic carriers are present. Statistics in Medicine 21(12):1773-1785.
Crossref
|
|
|
|
|
Held M, Gase K, Baldwin IT (2004). Microarrays in ecological research: a case study of a cDNA microarray for plant-herbivore interactions. BMC Ecology 4:13.
Crossref
|
|
|
|
|
Heston TF (2011). Standardizing predictive values in diagnostic imaging research. Journal of Magnetic Resonance Imaging 33(2):505-507.
Crossref
|
|
|
|
|
Hintze, JL, Nelson RD (1998). Violin plots: a box plot-density trace synergism. The American Statistician 52(2):181-184.
|
|
|
|
|
Joseph DC, Ton Z (2006). Microarray analysis of the transcriptomes as a stepping stone towards understanding biology system: practical consideration and perspectives. The Plant Biology Journal 45:630-650.
|
|
|
|
|
John CM, Christopher EM, Shrikant MM, Matthew S, Yoav G (2008). RNA-Seq: an assessment of technical reproducibility and comparison with gene expression arrays. Genome Research 18:1509-1517.
Crossref
|
|
|
|
|
Matthew ER, Jeremy S, Alicia O, Melissa H, Dileepa D, Andrew H, Gordon KS (2007). A comparison of background correction methods for two-colour microarrays. Bioinformatics 23(20):2700-2707.
Crossref
|
|
|
|
|
Modrek B, Resch A, Grasso C, Lee C (2001). Genome-wide detection of alternative splicing in expressed sequences of human genes. Nucleic Acids Research 29:2850-2859.
Crossref
|
|
|
|
|
Montgomery S, Sammeth M, Gutierrez-Arcelus M, Lach R, Ingle C, Nisbett J, Guigo R, Dermitzakis ET (2010). Transcriptome genetics using second generation sequencing in a caucasian population. Nature 464(8):773-777.
Crossref
|
|
|
|
|
Mortazavi A, Williams BA, McCue K, Schaeffer L, Wold B (2008). Mapping and quantifying mammalian transcriptomes by RNA-Seq. Nature Methods 5(6):621-628.
Crossref
|
|
|
|
|
Mutz KO, Heilkenbrinker A, Lo¨nne M, Walter JG, Stahl F (2013). Transcriptome analysis using next-generation sequencing. Current Opinion in Biotechnology 24:22-30.
Crossref
|
|
|
|
|
Nagalakshmi U, Waern K, Snyder M (2010). RNA-Seq: a method for comprehensive transcriptome analysis. Current Protocols in Molecular Biology Chapter 4: Unit 4.11.1-13. 7.
|
|
|
|
|
Nancy T, David G, Jérôme G, François B, Philippe A, Carole C, Agnès A, Rossitza A, Céline L, Jean-Pierre R, Fabienne D, Charles R, Serge D, Saïd H (2005). Isogene specific oligo arrays reveal multifaceted changes in gene expression during grape berry (Vitis vinifera L.) development. Plant 222(5):832-847.
Crossref
|
|
|
|
|
Noel DD, Alberto F, Luciano X, Antonio M, Massimo D, Giovanni M (2016). Heterogeneity of global gene expression microarray designs in detecting differentially expressed genes. International Journal of Bioinformatics Research 7(2):349-357.
|
|
|
|
|
Noel DD, Martial DYS, Nafan D, Antonio M, HD Lallié, Edouard KN, Lamine BM, Massimo D, Giovanni M (2017). RNA-Seq evaluating several custom microarrays background correction and gene expression data normalization systems. Biotechnology Journal International 19(4):1-14.
Crossref
|
|
|
|
|
Oshlack A, Emslie D, Corcoran LM, Smyth GK (2007). Normalization of boutique two-color microarrays with a high proportion of differentially expressed probes. Genome biology 8(1):R2.
Crossref
|
|
|
|
|
Patrick R (1995). Remark AS R94: A remark on Algorithm AS 181: The W test for normality. Applied Statistics 44:547-551.
Crossref
|
|
|
|
|
R Core Team (2014). R: A language and environment for statistical computing. R Foundation for Statistical Computing, Vienna, Austria. URL http://www.R-project.org/.
|
|
|
|
|
Sam SS, Martin BW (1965). An analysis of variance test for normality (complete samples). Biometrika 52(3):e4:591-611.
|
|
|
|
|
Shorack GR, Wellner JA (1986). Empirical processes with applications to statistics. New York, NY: John Wiley and Sons.
|
|
|
|
|
Smyth GK (2005). Limma: linear models for microarray data. In: Gentleman R, Carey VJ, Huber W, Irizarry RA, Dudoit S (eds). Bioinformatics and Computational Biology Solutions Using R and Bio-conductor. Statistics for Biology and Health. Springer, New York, NY.
Crossref
|
|
|
|
|
Song L, Lan L, Peng J, Dan W, Yi X (2011). A comparison of RNA-Seq and high-density exon array for detecting differential gene expression between closely related species. Nucleic Acids Research 39(2):578-588.
Crossref
|
|
|
|
|
Takahashi M, Kondoh Y, Tashiro H, Koibuchi N, Kuroda Y, Tashiro T (2005). Monitoring synaptogenesis in the developing mouse cerebellum with an original oligonucleotide microarray. Journal of Neuroscience Research 80:777-788.
Crossref
|
|
|
|
|
Vivian TYT, Hong Y (2012). Noise reduction in microarray gene expression data based on spectral analysis. International Journal of Machine Learning and Cybernetics 3(1):51-57.
Crossref
|
|
|
|
|
Van der Vaart AW (1998). Asymptotic Statistics. Cambridge, UK: Cambridge University Press.
Crossref
|
|
|
|
|
Wilson DL, Buckley MJ, Helliwell CA, Wilson IW (2003). New normalization methods for cDNA microarray data. Bioinformatics 19:1325-1332.
Crossref
|
|
|
|
|
Wurmbach E, Yuen T, Sealfon SC (2003). Focused microarray analysis. Methods 31:306-316.
Crossref
|
|
|
|
|
Xu W, Chen H, Du K, Asahara H, Tini M, Emerson BM, Montminy M, Evans RM (2001). A transcriptional switch mediated by cofactor methylation. Science 294(5551):2507-2511.
Crossref
|
|
|
|
|
Yang YH, Dudoit S, Luu P, Lin DM, Peng V, Ngai J, Speed TP (2002). Normalization for cDNA microarray data: a robust composite method addressing single and multiple slide systematic variation. Nucleic Acids Research 30(4):e15.
Crossref
|
|
|
|
|
Yang YH, Thorne NP (2003). Normalization for two-color cDNA microarray data. In: D. R. Goldstein (ed.), Science and Statistics: A Festschrift for Terry Speed, IMS Lecture Notes - Monograph Series 40:403-418.
Crossref
|
|
|
|
|
Yoav B, Yosef H (1995). Controlling the false discovery rate: a practical and powerful approach to multiple testing. Journal of the Royal Statistic Society. Series B (Methodological) 57(1):289-300.
Crossref
|
|
|
|
|
Zamboni A, Pierantoni L, De Franceschi P (2008). Total RNA extraction from strawberry tree (Arbutus unedo) and several other woody-plants. iForest 1:122-125.
|
|
|
|
|
Zenoni S, Ferrarini A, Giacomelli E, Xumerle L, Fasoli M, Malerba G, Bellin D, Pezzotti M, Delledonne M (2010). Characterization of transcriptional complexity during berry development in Vitis vinifera using RNA-Seq. Plant Physiology 152(4):1787-1795.
Crossref
|
|
|
|
|
Zhao S, Fung-Leung W-P, Bittner A, Ngo K, Liu X (2014). Comparison of RNA-Seq and Microarray in Transcriptome Profiling of Activated T Cells. PloS ONE 9(1):e78644.
Crossref
|
|