Full Length Research Paper

ABSTRACT
Due to advances in microscopic imaging, there are a plethora of biological molecules that can now be tagged and subsequentially imaged from almost any cell, organism, or tissue. However, the ability of software to analyze these images remains to be a challenge. ImageJ is open source software that allows for the processing of these images, but faces challenges when dealing with images that show weak contrast between objects of interest and background. DeutJ is an ImageJ plugin that color corrects and brightness corrects gradients that inhibit segmentation in confocal microscopy images. It can analyze hundreds of images from a given folder and produces binary mask images that are superior to existing ImageJ functions.
Key words: ImageJ, image analysis, cell segmentation, ImageJ plugin.
INTRODUCTION
A variety of biological molecules in almost any cell, organism, and tissue can now be imaged in large part due to advancements in microscopy equipment and improvements in labelling techniques. However, what has remained challenging is that often these images may be a challenge to interpret or rigorously evaluate. Particularly, it can be difficult to examine cells of interest if overlapping, shading, or colocalization may occur (Booij et al., 2019; Wilkinson, 1994).
Several factors may be responsible for the limited use of any current use of software that involves detailed image analysis. Particularly, customization of the software is often required to achieve optimal results for each specific laboratory’s purpose (Morris et al., 2010). Furthermore, while there are certain cases where images can be easily separated between foreground and background, sometimes images taken from microscopy may push the limits of detection, such as when there are significant amounts of non-specific signals in cells, or where intracellular signals are not much different in property than the extracellular signal (Garain et al., 2006). These conditions may occur due to labelling probes lacking specificity or the probes having inherently a weak signal relative to existing endogenous molecules. Finally, an additional factor may consist of overlapping molecules amongst a 3D space that appears washed in a 2D image, resulting in the mixing of colors and distortion of pixel values (Despotovi? et al., 2015).
These problems can often be corrected through the combination and modification of existing software, either through the program being available open-source or incorporating a multi-step pipeline that utilizes multiple analysis software. However, a singular software tool that can effectively and intuitively be used by non-programmers to reliably segment different sets of photos from fluorescence signals does not exist.
DeatJ was developed to provide customizability in segmentation on top of the existing functionality of ImageJ through modification and combination of different existing plugins that are further personalized by the user. This paper aims to describe the operation and use of the DeutJ software.
METHODOLOGY
Implementation
DeutJ was developed using ImageJ version 1.72 and Java version 8 (Schneider et al., 2012). The codebase was built off of open-source ImageJ software. To use the DeutJ program, one needs to be able to run java executables. When launching DeutJ, the user must select the folder that contains the images required for analysis, and will be prompted to select all files used for analysis. Once selected, parameter values will be entered into a dialog box, which includes the size limits of objects, the masking algorithm, and any preprocessing adjustments such as brightness or contrast modifications. Once the parameters are entered, the macro will search through the selected folder and one by one produce segmentations of those images, saving them in the same folder as before.
Images are first converted into the 8-bit format. Then, the program conducts a series of normalizations and local background subtractions that improve the process of separating the foreground from the background before thresholding. This is done to improve the masking accuracy by aligning the image histogram in conjunction with the threshold algorithm. First, a contrast correction factor (CCF) will be calculated for each pixel of the unprocessed 256-bit image and stored as a floating point. This is done to achieve a standardized saturation percentage of 35%, though this value is adjustable by the user. The CCF will then be applied to all pixels in the image, to produce a final photo with a contrast between the range of -256 and +256, which will be printed on the screen. Negative values indicate that there has been a decrease in contrast, while a positive value will indicate an increase in contrast. The CCF is calculated as follows:
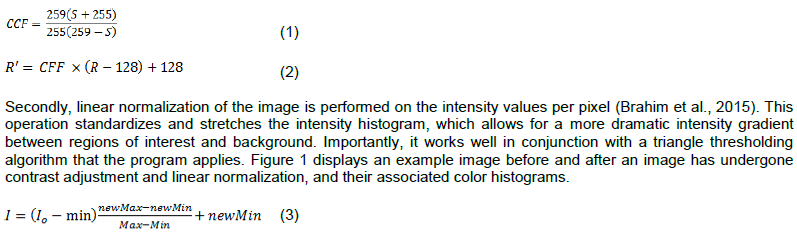
Thirdly, within individual regions of interest, a Sternberg’s local background subtraction is conducted to further reduce shading effects (Sternberg, 1983). Sternberg’s method of subtraction is particularly effective for uneven shading and correcting for large spatial variations in background intensity. An example of before and after an image has been background subtracted is displayed in Figure 2. This method is advantageous as most contemporary thresholding methods use a global subtraction process, which performs poorly when provided with unevenly shaded images.
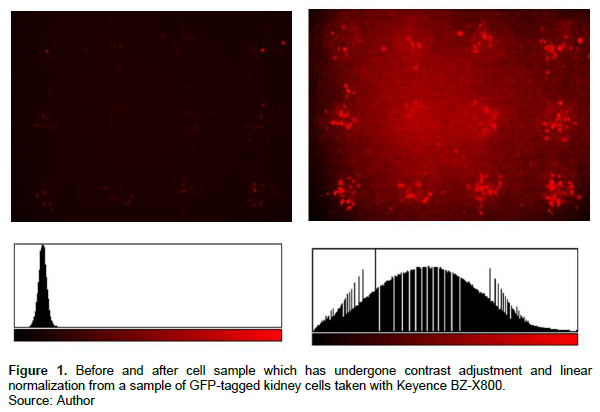
These three pre-processing adjustments serve to reduce background artifacts, shading, and unevenly focused images, and handle a wide array of tagged samples in our lab. Previously, only fluorescence confocal microscope images could be reliably masked, while DeutJ can now mask samples taken with light microscopy or inverted microscopes, despite the presence of significant shading. Figure 3 shows an example of the DeutJ program compared with ImageJ’s “automatic thresholding” function.
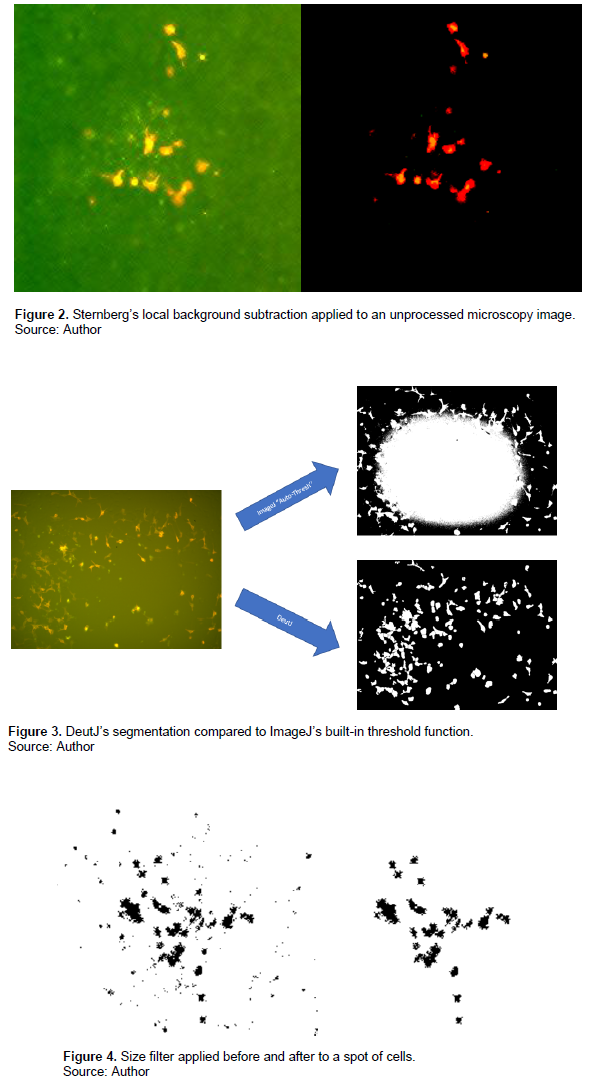
DeutJ also incorporates post-thresholding improvements over traditional functions available in ImageJ. Notably, a size threshold has been implemented, which filters out small artifacts that arise from masking. The program achieves this by using a Sobel edge detection algorithm to find the gradient of image intensity at each pixel within an image (Garain et al., 2006), and the direction of maximal increase (Despotovi? et al., 2005) from light to dark of said pixel, to construct the edge lines (Vincent and Folorunso, 2009). Once edges have been detected, the program filters all edges out under a size of 25 pixels squared, which we have found to be most optimized for cells examined, but are adjustable in the software (Figure 4).

Where, Gx and Gy are gradient approximations in the approximations of x and y direction, respectively.
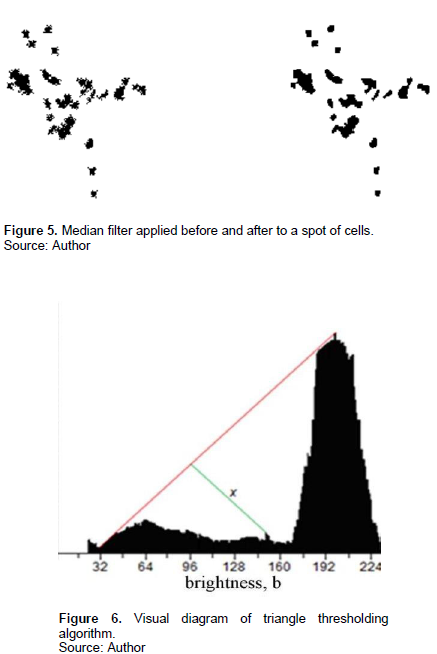
Another post-mask feature the program includes a median filter, which replaces each pixel with a median value in the array of its 3×3 neighbourhood (Chen et al., 1999). When the median filter is applied to a binary image, this produces rounded out cells that more accurately capture the natural shape of cells (Figure 5).
Finally, the DeutJ uses a triangle thresholding algorithm (Tajima and Kato, 2011). Popular algorithms like Otsu assume a foreground and background class, and seek to minimize the variance of each class in the image’s resulting bimodal histogram, which is later split for image segmentation (Zhu et al., 2009). Unfortunately, in the case of uneven shading, Otsu will “force” a bimodal distribution and inadvertently encapsulate objects into the background or capture background elements into the foreground.
To combat this, DeutJ uses the triangle algorithm, which thresholds by determining the line of maximal length perpendicular to the connection between the maximum and minimum points of the intensity histogram. This works well with the conjunction of linear normalization adjustments described previously (Figure 6).
Operation
DeutJ works on desktop computers running either OS or Windows operating systems. Computers must have Java 8 or later installed and requires no internet connection. The software is open source under Apache 2.0 license. To use, run the file from an IDE, and select the folder that contains the desired microscopy images. All images of interest must be in a single folder. Click “open folder”, and the program will automatically create a folder inside the previously selected folder with file names that end with “_mask #X”, where X corresponds to the nth mask generated.
RESULTS AND DISCUSSION
This paper aims to present the results of DeutJ, a software tool for segmenting and masking images from various types of fluorescent microscopy. Most notably confocal, DeutJ also works with widefield types. The software is designed to accurately identify and segment specific objects within an image, and then apply a mask to those objects in order to obscure or remove them given differing background intensity values. Our lab uses GFP, but any molecule-of-interest that emits fluorescent radiation will suffice. Within our laboratory, DeutJ performs with a higher degree of precision and accuracy compared to ImageJ’s native plugins. However, further research is needed in order to fully evaluate its performance in other areas of image segmentation. Furthermore, requiring ImageJ installed on the user’s computer when running the application is a limitation. Therefore, in future work we hope to turn DeutJ into a standalone program in order to increase portability and access. Though ImageJ-accompanying macros and plugins have been well documented, few have attempted to build upon the software’s existing segmentation tools (Guzmán et al., 2014; Pool et al., 2008; Poulet et al., 2014; Roels et al., 2020; Valente et al., 2017; Whitehead et al., 2019; Handala et al., 2019).
CONCLUSION
DeutJ is a robust, easy-to-use, free tool that automates the segmentation of confocal microscopy images under poor light conditions. It works particularly well to create masks from images that suffer from uneven light shading and significant speckle. In our laboratory it is used to segment kidney samples that have been shaded with GFP. Furthermore, the software may serve many researchers in applications related to counting labeled cells or even for test segmentation software in photos. Future work may build off of DeutJ’s open source to develop imaging software for non-confocal segmentation.
CONFLICT OF INTERESTS
The author has not declared any conflict of interests.
REFERENCES
|
Booij TH, Price LS, Danen EHJ (2019). 3D Cell-based assays for drug screens: Challenges in imaging, image analysis, and high-content analysis. SLAS Discovery: Advancing Life Sciences R&D 24(6):615-627. |
|
|
Brahim A, Ramírez J, Górriz JM, Khedher L, Salas-Gonzalez D (2015). Comparison between Different Intensity Normalization Methods in 123I-Ioflupane Imaging for the Automatic Detection of Parkinsonism. Plos One 10(6):e0130274. |
|
|
Chen T, Ma KK, Chen LH (1999). Tri-state median filter for image denoising. IEEE Transactions on Image processing 8(12):1834-8. |
|
|
Despotovi? I, Goossens B, Philips W (2015). MRI segmentation of the human brain: Challenges, methods, and applications. Computational and Mathematical Methods in Medicine 2015:1-23. |
|
|
Garain U, Paquet T, Heutte L (2006). On foreground - background separation in low quality document images. International Journal of Document Analysis and Recognition 8(1):47-63. |
|
|
Guzmán C, Bagga M, Kaur A, Westermarck J, Abankwa D (2014). ColonyArea: An ImageJ plugin to automatically quantify colony formation in clonogenic assays. Rota R, ed. PLoS ONE 9(3):e92444. |
|
|
Handala L, Fiore T, Rouillé Y, Helle F (2019). QuantIF: An ImageJ macro to automatically determine the percentage of infected cells after immunofluorescence. Viruses 11(2):165. |
|
|
Morris RR, Kirschbaum CR, Picard RW 2010. Broadening accessibility through special interests: a new approach for software customization. In Proceedings of the 12th international ACM SIGACCESS conference on Computers and accessibility (ASSETS '10). Association for Computing Machinery, New York, NY, USA pp. 171-178. |
|
|
Pool M, Thiemann J, Bar-Or A, Fournier AE (2008). NeuriteTracer: A novel ImageJ plugin for automated quantification of neurite outgrowth. Journal of Neuroscience Methods 168(1):134-139. |
|
|
Poulet A, Arganda-Carreras I, Legland D, Probst AV, Andrey P, Tatout C (2014). NucleusJ: an ImageJ plugin for quantifying 3D images of interphase nuclei. Bioinformatics 31(7):1144-1146. |
|
|
Roels J, Vernaillen F, Kremer A, et al (2020). An interactive ImageJ plugin for semi-automated image denoising in electron microscopy. Nature Communications 11(1):771. |
|
|
Schneider CA, Rasband WS, Eliceiri KW (2012). NIH Image to ImageJ: 25 years of image analysis. Nature Methods 9(7):671-675. |
|
|
Sternberg SR (1983). Biomedical image processing. Computer 16(01):22-34. |
|
|
Tajima R, Kato Y (2011). Comparison of threshold algorithms for automatic image processing of rice roots using freeware ImageJ. Field Crops Research 121(3):460-463. |
|
|
Valente AJ, Maddalena LA, Robb EL, Moradi F, Stuart JA (2017). A simple ImageJ macro tool for analyzing mitochondrial network morphology in mammalian cell culture. Acta Histochemica 119(3):315-326. |
|
|
Vincent O, Folorunso O (2009). A descriptive algorithm for sobel image edge detection. Accessed January 21, 2023. |
|
|
Whitehead MJ, McCanney GA, Willison HJ, Barnett SC (2019). MyelinJ: an ImageJ macro for high throughput analysis of myelinating cultures. Murphy R, ed. Bioinformatics 35(21):4528-4530. |
|
|
Wilkinson MHF (1994). Shading correction and calibration in bacterial fluorescence measurement by image processing system. Computer Methods and Programs in Biomedicine 44(2):61-67. |
|
|
Zhu N, Wang G, Yang G, Dai W (2009). A fast 2D otsu thresholding algorithm based on improved histogram. 2009 Chinese Conference on Pattern Recognition. Published online November. |
|
Copyright © 2024 Author(s) retain the copyright of this article.
This article is published under the terms of the Creative Commons Attribution License 4.0


