Full Length Research Paper

ABSTRACT
This study investigated the effects of solidification/stabilization (S/S) variables on visible and near-infrared (vis-NIR) spectral reflectance of solidified/stabilized low-temperature thermally desorbed (pre-treated) oil-based drill cuttings. Partial least squares (PLS) regression models were also developed to rapidly estimate the levels of total petroleum hydrocarbon (TPH), Cu, and Ba present in the solidified/stabilized matrix. Composite samples of the drill cuttings were collected from a drill cutting Treatment Company in the Niger Delta region (5.317°N and 6.467°E), Nigeria and subjected to cement-based S/S. Reference TPH analysis was done by gas chromatography mass spectrometry and heavy metals by flame atomic absorption spectrometry. Sample optical measurement was carried out with a portable fibre-optic LabSpec2500® vis-NIR spectrophotometer (350–2,500 nm) (PANalytical, Boulder, CO, USA). Results show that spectral absorption minima observed around 1411, 1759, 1950, and 2204 nm in the NIR band are linked to relics of hydrocarbon-based oil, oxides of metallic ions, sulphate, and water (but not necessarily in that order). Spectral reflectance increased with drill cuttings addition, days of curing, and water-to-cement ratio. PLS model predictions were almost good for Cu (validation residual prediction deviation [RPD] = 1.97) and excellent for both TPH and Ba (RPDs = 2.41 and 3.45, respectively). Hence, vis-NIR diffuse reflectance spectroscopy is a potential means for semi-quantitative measurement of the levels of TPH and heavy metals present in cement-based solidified/stabilized pre-treated oil-based drill cuttings.
Key words: Characterization, hazardous waste management, near-infrared spectroscopy, solidification/ stabilization, hydrocarbons, heavy metals
INTRODUCTION
MATERIALS AND METHODS
Study area
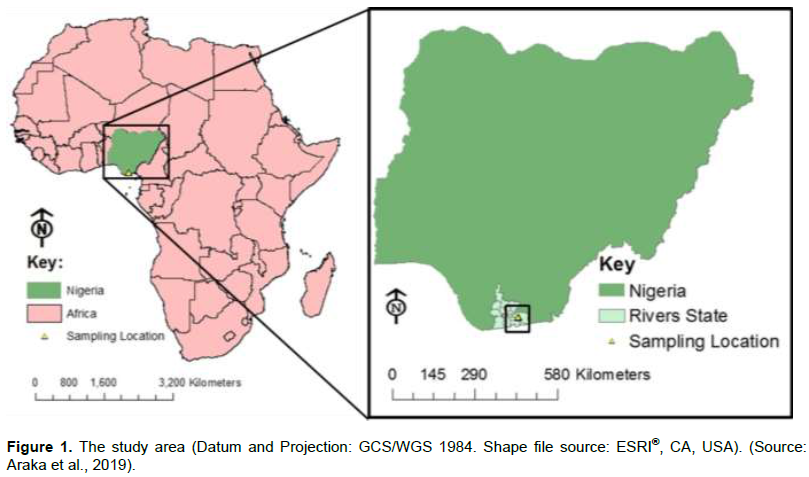
This investigation was carried out in Rivers State, Niger Delta region of Nigeria (Figure 1). The Niger Delta region is located in the southern part of the country between latitudes 4º and 6º north of the equator and longitudes 5º and 7º east of Greenwich. The region is mostly a natural wetland covering about 70,000 km2 (NDES, 1995) with a predominance of sandy-clay soils (United Nations Environment Programme (UNEP), 2011). The region has a population of over 10 million people and is the hub of Nigeria’s crude oil and natural gas activities; the main driver of the country’s economy (NDES, 1995). It has been reported that a total of 4,492,057.9 tons of petroleum wastes were generated in only 6 offshore platforms from 2010 to 2013 in Nigeria (Nwokedi et al., 2015). With most of the oil and gas production activities concentrated in the Niger Delta region, it is most likely that a majority of these wastes would come from the region.
Sample collection
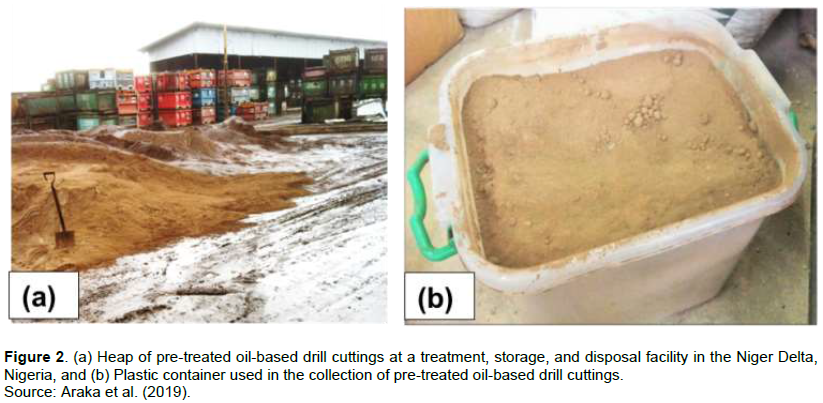
Composite samples of the drill cuttings were collected with plastic containers from a drill cutting Treatment Company in the Niger Delta region (Figure 2) and taken to the laboratory for cement-based S/S treatment and subsequent chemical analyses and optical measurement. Sample management followed guidelines in local regulatory framework (DPR, 2002)
Statistical indices used to evaluate the quality of the Ba-, Cu-, and TPH-PLS models were the root-mean-square error (RMSE) of cross-validation and prediction and residual prediction deviation (RPD) (Williams and Sobering, 1986; Naes et al., 2002). Coefficient of determination (r2) was used to determine what percentage of the variability in the dataset was explained by the estimated regression line. Model prediction ability was categorized on the basis of the following criteria proposed by Chang et al. (2001): excellent if RPD > 2.0, almost good if 1.4 ≤ RPD < 2.0, and unreliable if RPD < 1.4.
RESULTS AND DISCUSSION
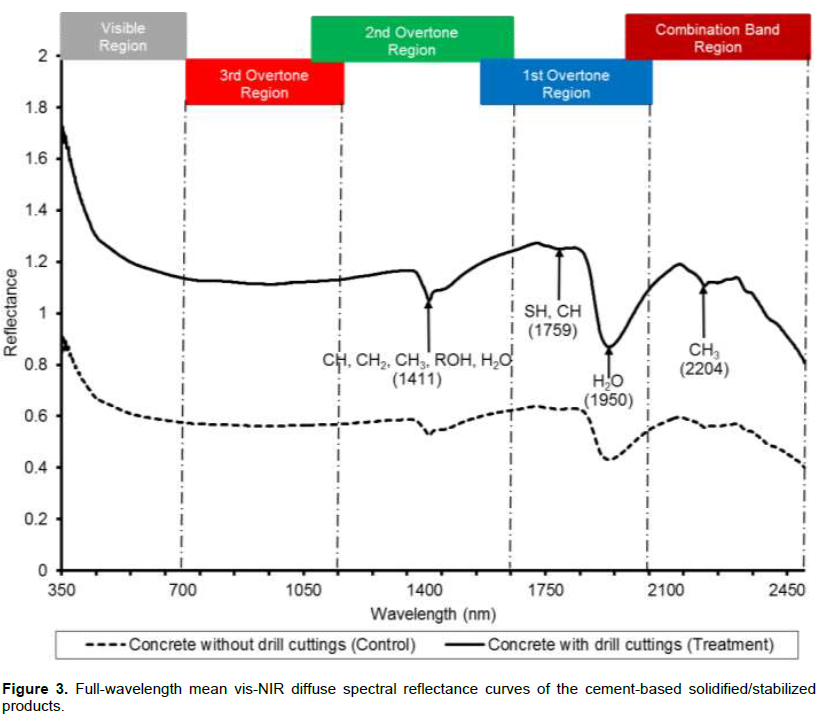
As stated, concrete is widely known to contain large amounts of heavy metals predominantly from constituent metal oxides such as Al2O3, SiO2, Fe2O3, MgO, CaO, etc. Another equally important contributing source of heavy metals is the mud additives. The O–H functional group is linked to water (Whalley and Stafford, 1992). The absorption around 1759 nm in the first overtone region (Figure 3) is associated with C–H stretching modes of saturated CH2 and terminal CH3 groups and S-H stretching mode of S–H functional group. As stated, saturated CH2 and terminal CH3 groups are linked to TPH. Moreover, the S–H functional group may be linked to sulphate in the calcium aluminate mono-sulphate reported to be formed during the conversion of primary ettringite at the early stages of hydration of the concrete (Portland Cement Association, 2001). The absorption feature around 1950 nm in the first overtone region is associated with vibrational O-H stretching modes of O–H functional group linked to water while the absorption around 2204 nm in the combination band region (Figure 3) is associated with terminal CH3 group linked to TPH. These fingerprints suggest that cement-based stabilization/solidification of pre-treated oil-based drill cuttings does not completely eliminate the hydrocarbons and heavy metals in the cuttings.
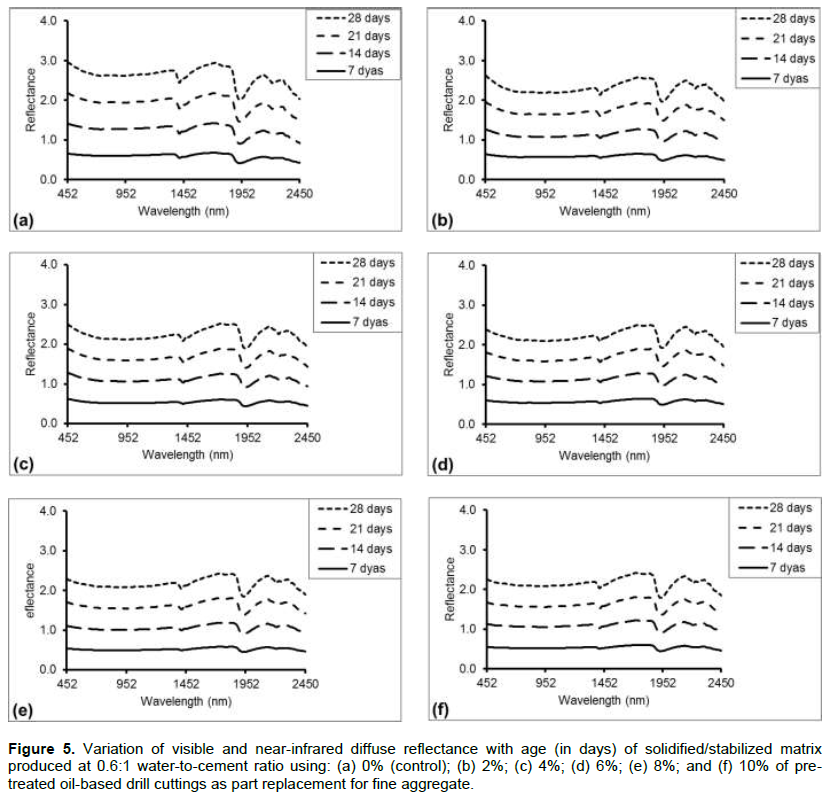
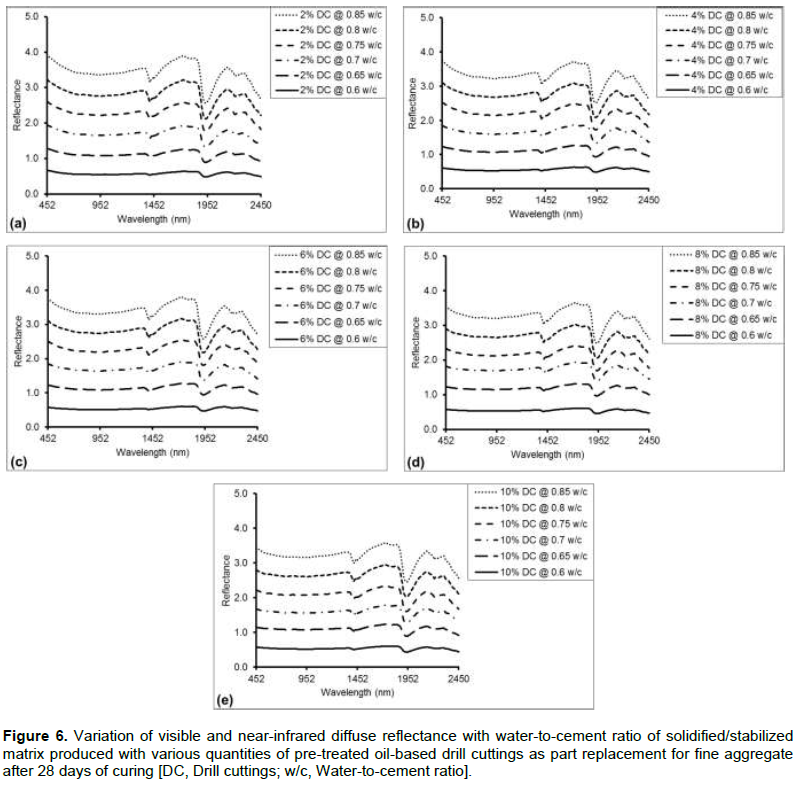
Effects of drill cuttings content, days of curing, and water-to-cement ratio on diffuse reflectance of solidified/stabilized pre-treated oil-based drill cuttings
Variations of vis-NIR diffuse reflectance of the solidified/ stabilized matrix with drill cuttings content, days of curing (age), and water to cement ratio are shown in Figures 4 to 6, respectively. Reports in the literature suggest that due to age and contamination with other materials such as soil and vegetation, older concretes are darker in colour than newer concretes and absorb more light as well (Fairbarn, 2013). However, concretes produced with pre-treated oil-based cuttings clearly showed the opposite. It is clear that spectral reflectance increased with drill cuttings content (Figure 4), age (Figure 5), and water-to-cement ratio (Figure 6), and vice versa. The increase in reflectance or decrease in absorption with drill cuttings content, age, and water-to-cement ratio might be due to colour-associated changes of the concrete mix material.
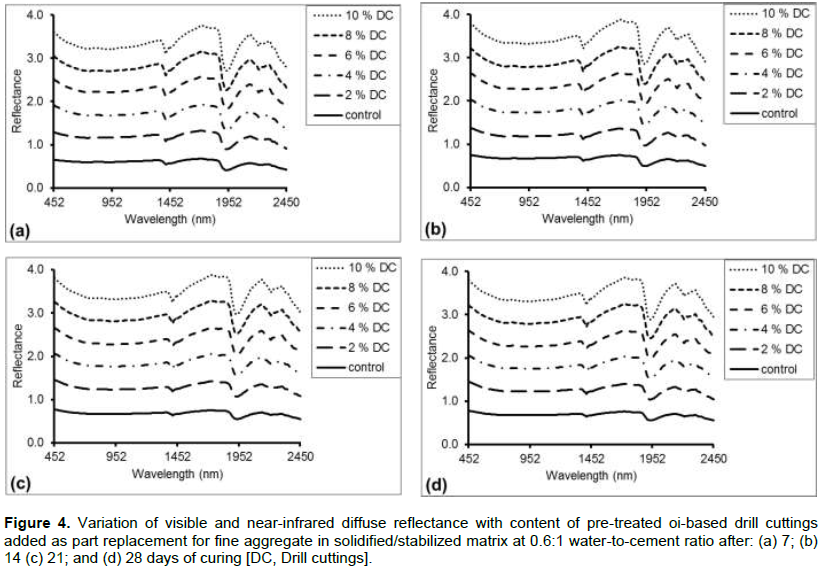
Pre-treated oil-based drill cuttings (Figure 2) are light in colour and generally would reflect more light than it would absorb. Even though fine aggregate is lighter in colour than pre-treated oil-based drill cuttings, Figure 4 shows that the concrete produced without pre-treated oil-based drill cuttings had the least reflectance or the most absorption. This suggests that concrete produced without pre-treated oil-based drill cuttings appears darker in colour than concretes produced with pre-treated oil-based drill cuttings when immersed in water in the process of curing. Thus, it is likely that the replacement of fine aggregate with pre-treated oil-based drill cuttings actually lightens the colour of the concrete during curing, thereby increasing the reflectance. This phenomenon may be partly attributed to the effect of water on relics of petroleum-based oil in the pre-treated oil-based drill cuttings. This is because the presence of water has been reported to lighten the colour of relics of petroleum-based oil such as diesel in the soil leading to increased soil reflectance and decreased absorption (Okparanma and Mouazen, 2013b).
Again, the absence of contaminations such as vegetation and dusts from soil in the curing water may be another reason for the observed increase in reflectance of concrete produced with pre-treated oil-based drill cuttings. More so, soil reflectance is known to decrease as moisture content increases due to natural increase in soil darkness with moisture content (Mouazen et al., 2005).
Quality of PLS regression models for the prediction of TPH and selected heavy metals in cross-validation and validation datasets
In the modelling process, only the 112 crushed stabilized/ solidified samples containing pre-treated oil-based drill cutting were used. The remaining 12 control samples were left out since they did not contain drill cuttings. Table 1 shows sample statistics of PLS regression models for the prediction of TPH, Cu, and Ba in cross-validation and validation data sets. Even though samples of the cross-validation and validation sets were randomly selected, cross-validation dataset means and standard deviations were similar to those of validation datasets. This similarity among cross-validation and validation datasets implied that the prediction models for Cu and Ba were not skewed. This situation was a bit different for TPH; the cross-validation dataset mean was similar to the validation dataset mean and the standard deviation of the validation dataset was only one-half that of the cross-validation dataset.
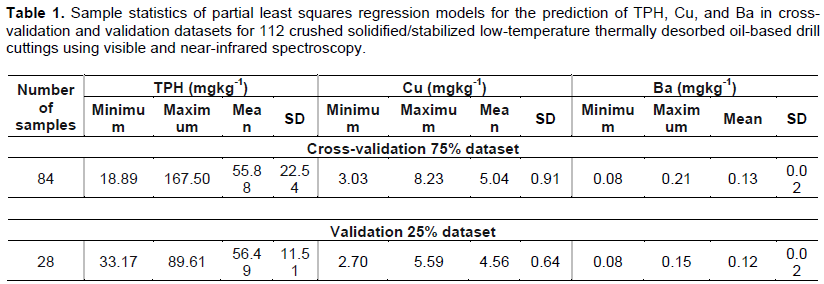
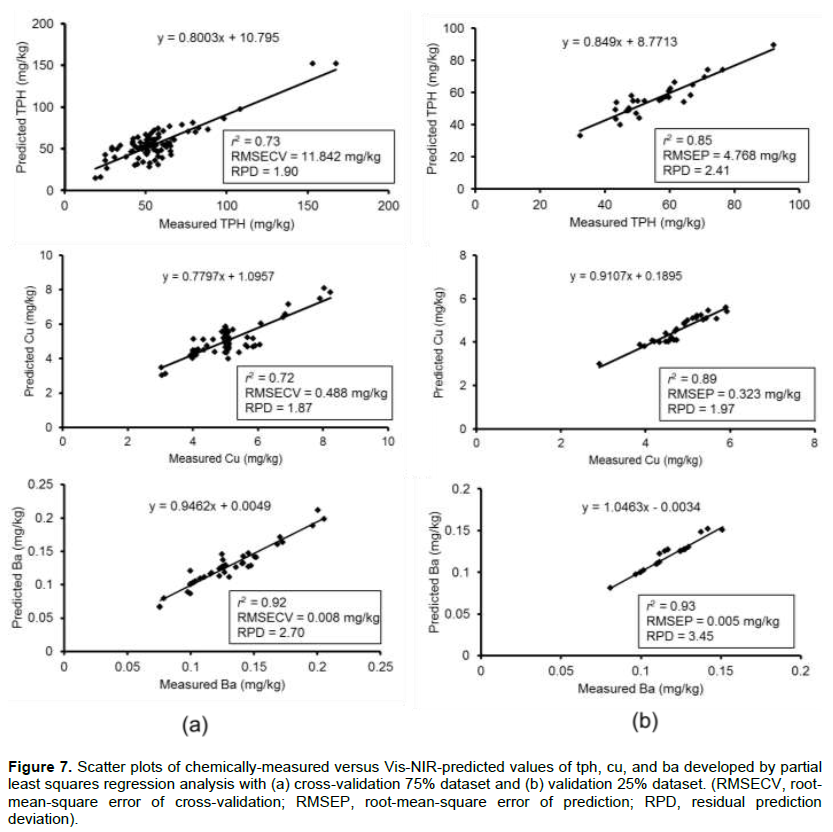
Figure 7 shows the scatter plots of measured versus predicted TPH, Cu, and Ba of the PLS regression models in cross-validation and validation sets for the 112 randomly split treatment samples — 75% for cross-validation and 25% for independent validation. As can be seen in Figure 7, the values of validation r2 (0.85, 0.89, and 0.93) and RPD (2.41, 1.97, and 3.45) obtained in this study for TPH, Cu, and Ba predictions respectively indicate the potential of vis-NIR spectroscopy to predict TPH, Cu, and Ba in stabilized/solidified pre-treated oil-based drill cuttings. Similarly, the RMSECV of 7% (TPH) and 6% (Cu) achieved in this study are comparable to the 7% reported by Okparanma (2013b) for PAH prediction in contaminated soils. On the other hand, the RMSECV of 4% for Ba achieved in this study is much better than the 7% reported by Okparanma (2013b) for PAH prediction in contaminated soils. Moreover, on the basis of the RPD values as recommended by Chang et al. (2001), model prediction ability achieved in this study can be categorized as almost good for Cu (validation RPD = 1.97) and excellent for both TPH and Ba (validation RPDs = 2.41 and 3.45, respectively).
Regression coefficients
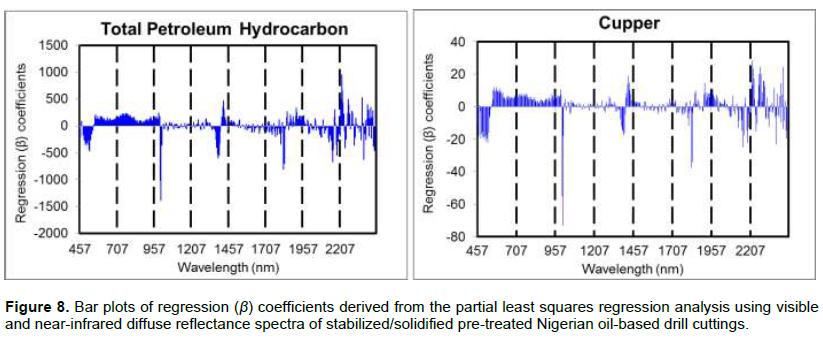
Figure 8 is the bar plots of regression (β) coefficients against wavelength from the PLS regression analysis using combined pre-processed vis-NIR spectral data and reference chemical data with 112 calibration samples for TPH and Cu, respectively. Regression coefficients plots are widely used for the identification of important wavelengths for the prediction of pertinent sample properties. The intensity (in absolute terms) of the β coefficients indicates how important the X-variables are in the regression model. Variables with large β coefficient play a key role in the model, with a positive coefficient showing a positive link to the response and a negative coefficient showing a negative link (CAMO, 2016). As can be seen in Figure 8, both positive and negative β coefficients are present throughout the modelling wavelength range of 457–2450 nm. From Figure 8, it is clear that the intensities of the β coefficients vary considerably in magnitude for TPH and Cu models; which suggests that the β coefficients for the two variables are not homogeneous. However, there are striking similarities in the positions of important wavelengths, which indicate a similarity in the composition of the solidified/stabilized matrix. Larger β coefficients were observed for TPH (957.54–1391.01) compared with Cu (28.35–73.28), which reflect the relative concentrations of the two contaminants in the solidified/stabilized matrix. In the bar plots, positive β coefficients can be seen around 1411 and 1950 nm while negative β coefficients can be seen around 1759 and 2204 nm. The positions of these spectral signatures are exactly the same with those observed earlier in the reflectance curve shown in Figure 3.
CONCLUSIONS
The applicability of vis-NIR diffuse reflectance spectroscopy in the rapid semi-quantitative measurement of the level of TPH ,Cu, and Ba in cement-based solidified/stabilized pre-treated oil-based drill cuttings was investigated vis-à-vis the effects of S/S variables on spectral reflectance of the solidified/stabilized matrix. Results showed that vis-NIR spectral absorption minima of hydrocarbon-based oil were observed around 1411, 1759, and 2204 nm in the second overtone, first overtone, and combination band regions respectively. Absorption minimum of oxides of metallic ions was observed around 1411 nm in the second overtone region. Absorption minima of water were seen around 1411 and 1950 nm in the second and first overtone regions respectively while absorption minimum of sulphate was observed around 1759 nm in the first overtone region. Spectral reflectance of the stabilized/solidified pre-treated oil-based drill cuttings increased with drill cuttings content, days of curing, and water-to-cement ratio; and vice versa. Model prediction ability was almost good for Cu (validation RPD = 1.97) and excellent for both TPH and Ba (validation RPDs = 2.41 and 3.45, respectively); suggesting the likelihood of using vis-NIR diffuse reflectance spectroscopy as a means for rapid semi-quantitative measurement of TPH, Cu, and Ba contents in cement-based solidified/stabilized pre-treated oil-based drill cuttings.
RECOMMENDATIONS
This study has shown the possibility of using vis-NIR spectroscopy for rapid semi-quantitative assessment of TPH, Cu, and Ba levels in solidified/stabilized pre-treated oil-based drill cuttings using only the design mix ratio of 1:2:4 for a grade-20 concrete. Since all the mix ratios were not considered in the current study, it is possible that not all the sources of variability have been taken into account in the modelling process. Therefore, it is recommended that other mix ratios should be explored.
CONFLICT OF INTERESTS
The authors have not declared any conflict of interests.
ACKNOWLEDGMENTS
Cranfield University, Bedfordshire, England is highly appreciated for offering Visiting Student admission to the first author (Student Reference: 254371). Special thanks to Prof. A.M. Mouazen (now in Ghent University, Belgium) for recommending the first author for the admission.
REFERENCES
|
Abbas Y (2015). In-situ measurement of chloride ion concentration in concrete. PhD Thesis, University of Twente. |
|
|
Adamchuk VI, Hummel JW, Morgan MT, Upadhyaya SK (2004). On-the-go soil sensors for precision agriculture. Computer and Electronics in Agriculture 44:71-91. |
|
|
American Public Health Association (APHA) (1998). Method 3111C: Standard Methods for the Examination of Water and Wastewater. 12th ed. 1015 Fifteenth Street, NW Washington, DC. |
|
|
Araka PP, Okparanma RN, Ayotamuno JM. (2019). Diagnostic screening of organic contaminant level in solidified/stabilized pre-treated oil-based drill cuttings. Heliyon 5(10):1-10. |
|
|
Brook A, Ben-Dor E (2011). Reflectance spectroscopy as a tool to assess the quality of concrete in situ. Journal of Civil Engineering and Construction Technology 2(8):169-188. |
|
|
CAMO (2016). Interpreting PLS plots. The Unscrambler® X Version 10.5 User's Guide. CAMO Software AS, Oslo, Norway. |
|
|
Chang C, Laird DA, Mausbach MJ, Hurburgh CR (2001). Near infrared reflectance spectroscopy: Principal components regression analysis of soil properties. Soil Science Society of America Journal 65:480-490. |
|
|
Department of Petroleum Resources (DPR) (2002). Environmental Guidelines and Standards for the Petroleum Industry in Nigeria. Abuja. |
|
|
Drilling Waste Management Information Systems (DWMIS) (2000). Drilling Waste Management Technology Descriptions. |
|
|
Environmental Protection Agency (EPA) (1994a). Method 8270. Semi Volatile Organic Compounds (SVOCS) by Gas Chromatography/Mass Spectrometry (GC/MS): SW-846 Manual. United States Environmental Protection Agency, Government Printing Office, Washington, DC, USA. |
|
|
Environmental Protection Agency (EPA) (1994b). Method 8270B. Semi Volatile Organic Compounds (SVOCS) by Gas Chromatography/Mass Spectrometry (GC/MS): Capillary Column Technique. United States Environmental Protection Agency, Government Printing Office, Washington, DC, USA. |
|
|
Fairbarn KG Jr. (2013). Visible-Near Infrared (VNIR) and Shortwave Infrared (SWIR) Spectral Variability of Urban Materials. MSc. Thesis. Naval Postgraduate School, Monterey, California, |
|
|
Forrester ST, Janik LJ, McLaughlin MJ, Soriano-Disla JM, Stewart R, Dearman B (2013). Total petroleum hydrocarbon concentration prediction in soils using diffuse reflectance infrared spectroscopy. Soil Science Society of America Journal 77:450-460. |
|
|
Igwe EA, Ayotamuno MJ, Okparanma RN, Ogaji SOT, Probert SD (2009). Road-surface properties affecting rates of energy dissipation from vehicles. Applied Energy 86(9):1692-1696. |
|
|
International Association of Oil and Gas Producers (IOGP) (2016). Drilling Waste Management Technology Review. Report 557. IOGP London, United Kingdom. |
|
|
Kogbara RB, Dumkhana BB, Ayotamuno JM, Okparanma RN (2017). Recycling stabilised/solidified drill cuttings for forage production in acidic soils. Chemosphere 184:652-663. |
|
|
Lee JD, Dewitt BA, Lee SS, Bhang KJ, Sim JB (2012). Analysis of concrete reflectance characteristics using spectrometer and VNIR hyperspectral camera. In: XXII ISPRS Congress. International Archives of the Photogrammetry, Remote Sensing and Spatial Information Sciences, Melbourne 39-B7: pp. 127-130. |
|
|
Lyons WC (1996). Drilling Muds and Completion Fluids. In: WC Lyons (Ed.), Standard Handbook of Petroleum and Natural Gas Engineering 1: Gulf Publishing Company Houston, Texas, USA. |
|
|
Mouazen AM, De Baerdemaeker J, Ramon H (2005). Towards development of on-line soil moisture content sensor using a fibre-type NIR spectrophotometer. Soil Tillage Research 80:171-183. |
|
|
Naes T, Isaksson T, Fearn T, Davies T (2002). A user friendly guide to multivariate calibration and classification. NIR Publications, Chichester, UK. |
|
|
Niger Delta Environmental Survey (1995). Background and Mission: Briefing Note 1. Publication of the Steering Committee, NDES, Falomo, Lagos, Nigeria pp. 1-7. |
|
|
Nwokedi TC, Okoroji LI, Nze IC, Ndukwu IP (2015). Oil exploration and production waste management practices: comparative analysis for reduction in hazardous E & P waste generation in offshore oil platforms in Nigeria. Journal of Environment and Earth Science 5(4):101-107. |
|
|
Okparanma RN, Mouazen AM (2013a). Determination of total petroleum hydrocarbon (TPH) and polycyclic aromatic hydrocarbon (PAH) in soils: A review of spectroscopic and nonspectroscopic techniques. Applied Spectroscopic Reviews 48(6):458-486. |
|
|
Okparanma RN, Mouazen AM (2013b). Combined effects of oil concentration, clay and moisture contents on diffuse reflectance spectra of diesel-contaminated soils. Water Air and Soil Pollution 224(5):1539-1556. |
|
|
Okparanma RN, Azuazu I, Ayotamuno JM (2017). Assessment of the effectiveness of onsite exsitu remediation by enhanced natural attenuation in the Niger Delta region, Nigeria. Journal of Environmental Management 204:291-299. |
|
|
Okparanma RN, Araka PP, Ayotamuno JM, Mouazen AM (2018). Towards enhancing sustainable reuse of pre-treated drill cuttings for construction purposes by near-infrared analysis: A review. Journal of Civil Engineering and Construction Technology 9(3):19-39. |
|
|
Pasquini C (2003). Near-Infrared Spectroscopy: Fundamentals, Practical Aspects and Analytical Applications. Journal of Brazilian Chemical Society 14(2):198-219. |
|
|
Portland Cement Association (2001). Concrete information: ettringite formation and the performance of concrete. PCA R&D Serial No. 2166. Skokie, Illinois, USA. |
|
|
Song HW, Saraswathy V (2007). Corrosion Monitoring of Reinforced Concrete Structures-A Review. International Journal of Electrochemical Science 2:1-28. |
|
|
Toda K, Nakamura Y, Kurata A (2012). System for diagnosing concrete deterioration with spectroscopic analysis. IHI Engineering Review 45(1):31-36. |
|
|
United Nations Environment Programme (UNEP) (2011). Environmental Assessment of Ogoniland. UNEP, Nairobi, Kenya. |
|
|
Viscarra-Rossel RA, McGlynn RN, McBratney AB (2006). Determining the composition of mineral-organic mixes using UV-vis-NIR diffuse reflectance spectroscopy. Geoderma 137:70-82. |
|
|
Webster GT, Soriano-Disla JM, Kirk J, Janik LJ, Forrester ST, McLaughlin MJ, Stewart RJ (2016). Rapid prediction of total petroleum hydrocarbons in soil using a hand-held mid-infrared field instrument. Talanta 160:410-416. |
|
|
Whalley WR, Stafford JV (1992). Real-time sensing of soil water content from mobile machinery: options for sensor design. Computer and Electronics in Agriculture 7:269-358. |
|
|
Williams PC, Sobering DC (1986). Attempts at standardization of hardness testing of wheat. II. The near-infrared reflectance method. Cereal Foods World 31:417-420. |
|
Copyright © 2024 Author(s) retain the copyright of this article.
This article is published under the terms of the Creative Commons Attribution License 4.0


